
EB Weekly Market Report - Monday, March 4, 2024
ChartLists Updated
Several ChartLists have been updated on our website since Friday:
- Strong Earnings (SECL)
- Strong Future Earnings (SFECL)
- Raised Guidance (RGCL)
- Bullish Trifecta (BTCL)
- Upcoming Earnings (5)
Weekly Market Recap
Major Indices
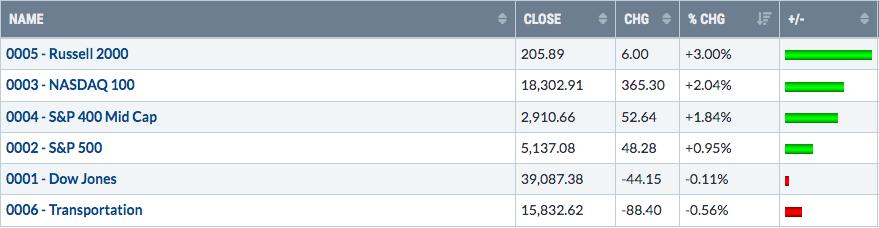
I think ever since I said the Russell 2000 and the transportation index were positively correlated, they've moved 100% opposite of one another. Murphy's Law, I suppose. Anyhow, this opposite effect was on full display once again last week as small caps led and transports lagged.
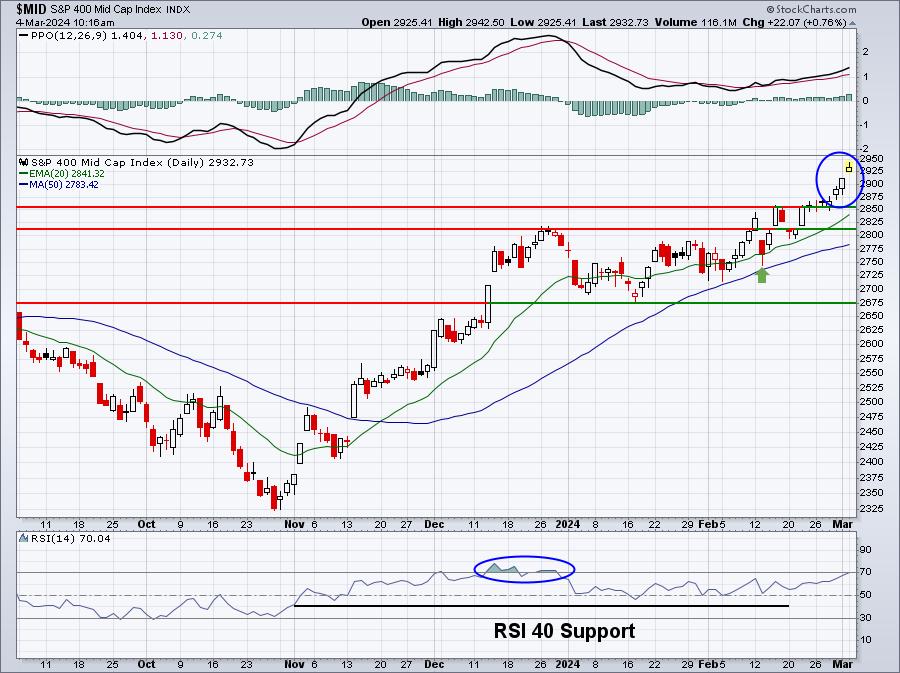
Last week, mid caps ($MID) made another key breakout and it comes on the heels of successful 20-day EMA tests. also, the daily PPO has turned higher fro just above the zero line. Everything looks good here:
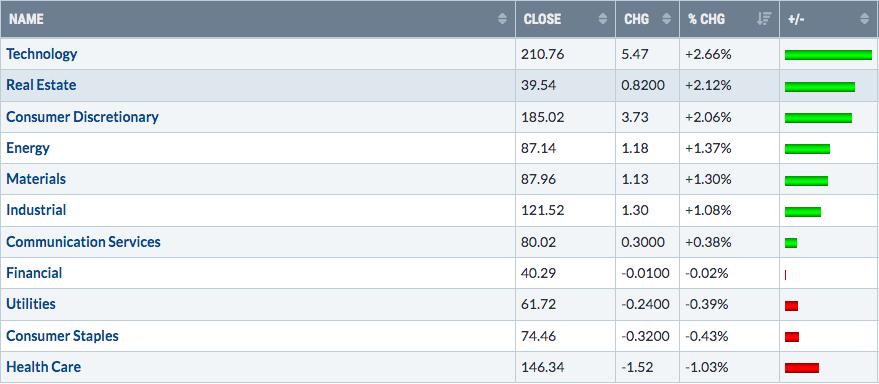
Sectors
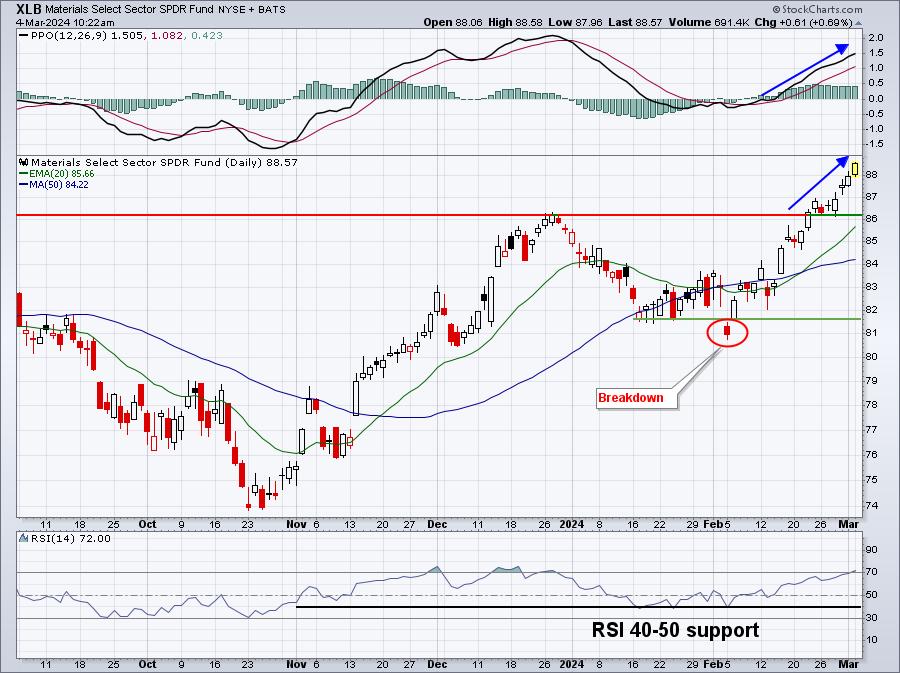
One month ago, it appeared as though materials (XLB) were dead technically. It lost its January price support and saw a death cross, which is when a shorter-term moving average closes beneath a longer-term moving average. After its February surge, an argument could be made that the XLB is now the hottest sector:
Top 10 Industries Last Week
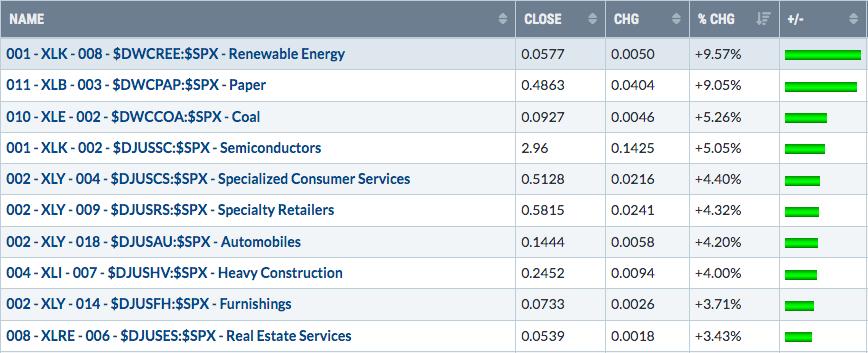
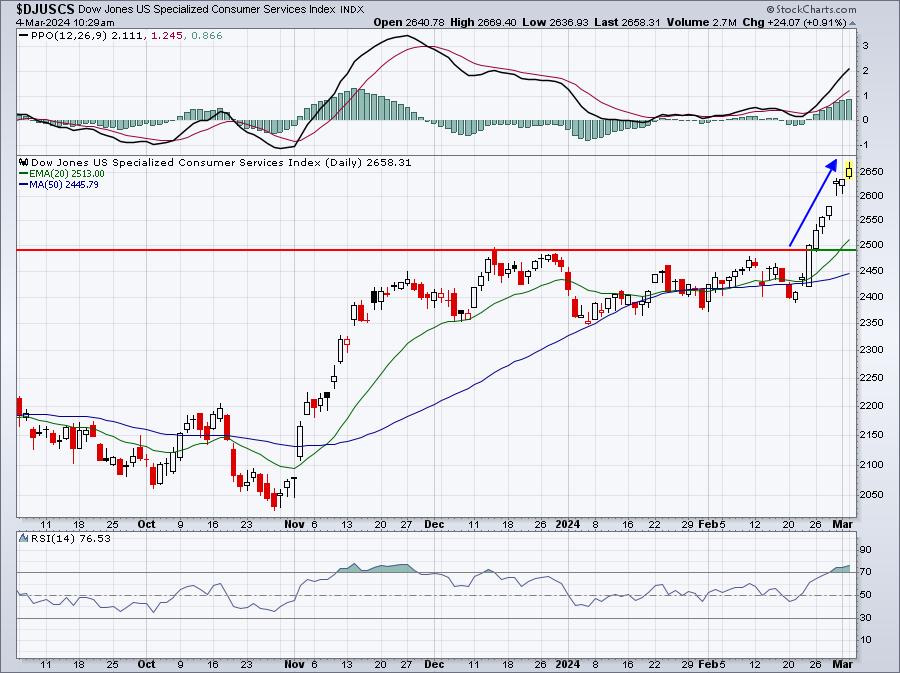
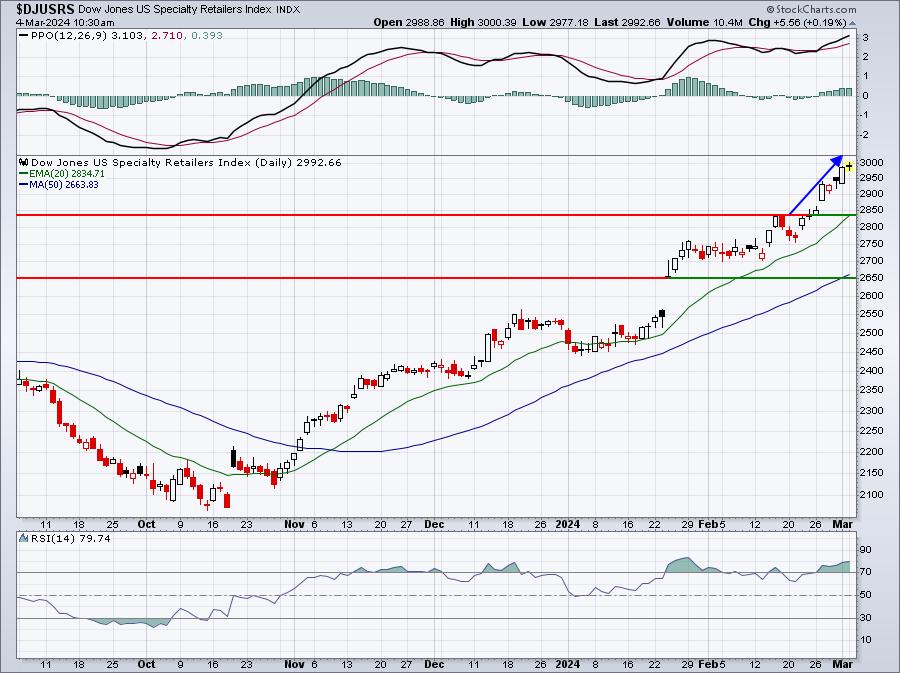
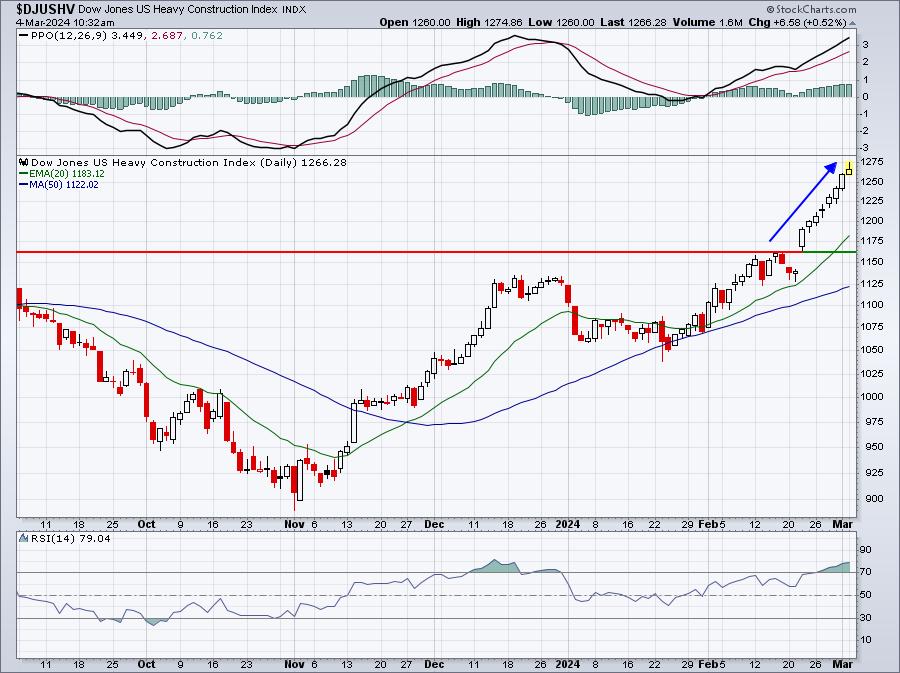
There are still plenty of folks talking up the Magnificent 7, suggesting this market is only going higher, because of their strength. Yes, I'll admit those stocks (some, not all) have definitely led U.S. equities higher the past two years, but they're not the only stocks moving rapidly higher now. On the strong industry groups list from last week, here are 4 industry charts, all in consumer discretionary (XLY) or industrials (XLI), that highlight significant strength OUTSIDE of the Mag 7:
Specialized consumer services ($DJUSCS):
Specialty retailers ($DJUSRS):
Heavy construction ($DJUSHV):
Furnishings ($DJUSFH)
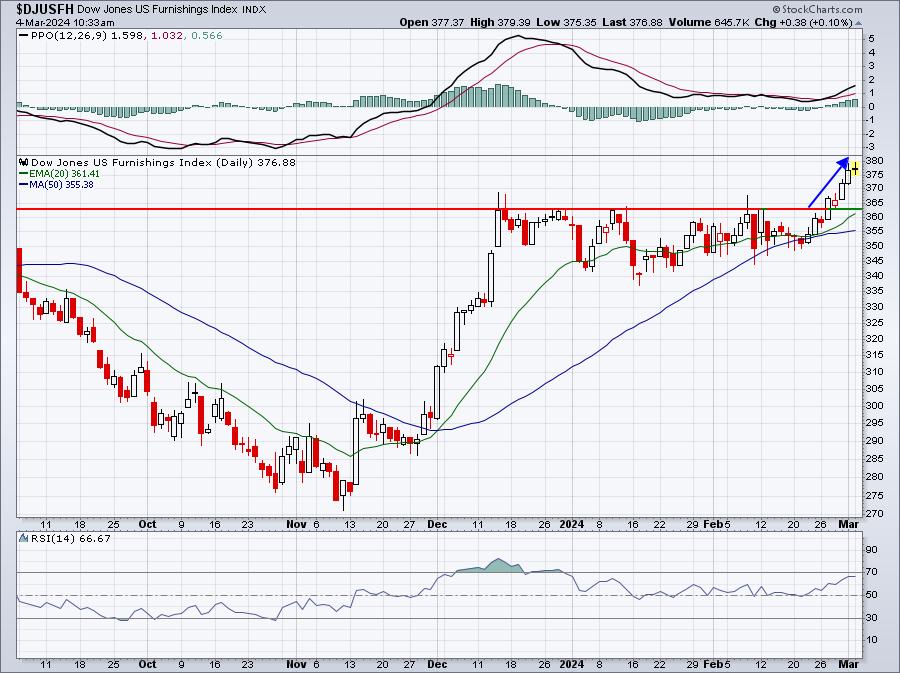
Bears can only be fighting this secular bull market advance for one reason. They've been 100% WRONG and cannot admit it. That's a very painful and expensive lesson to learn in the stock market, right Peter Schiff?
Bottom 10 Industries Last Week
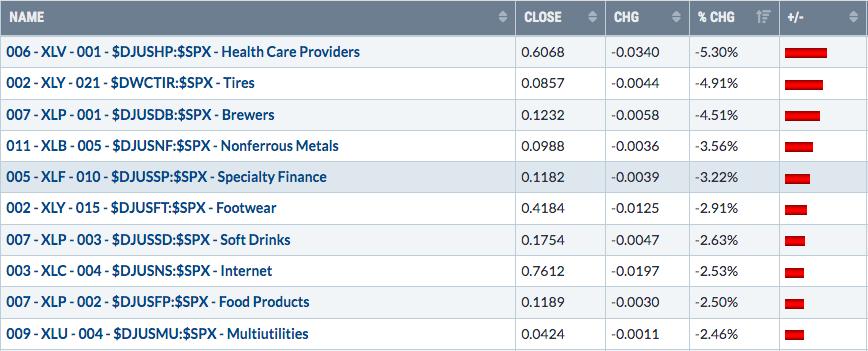
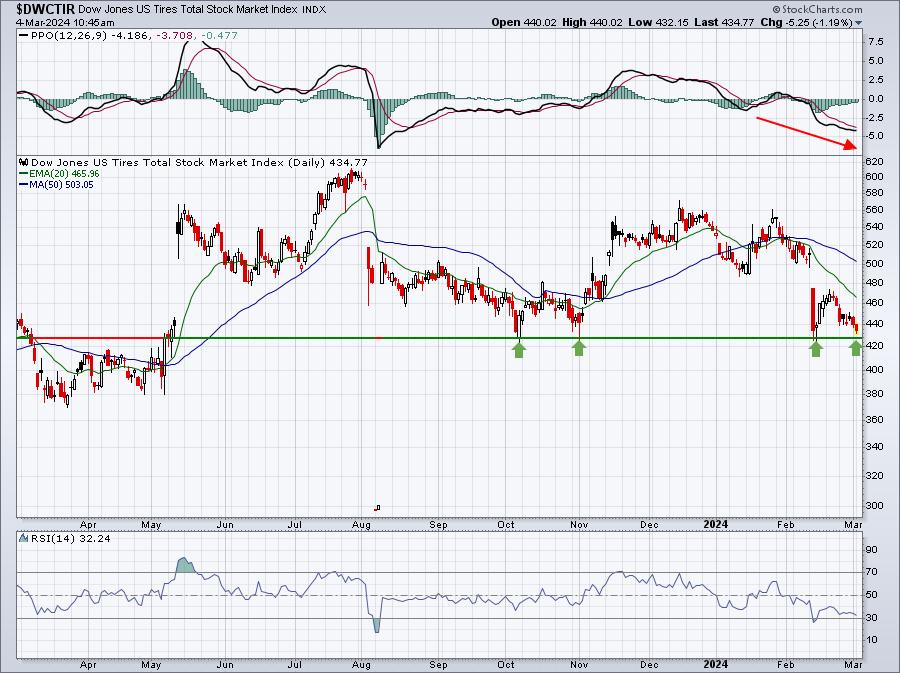
Specialty finance ($DJUSSP) and internet ($DJUSNS) have both been very strong industry groups that simply enjoyed a healthy pullback last week. The others have technical difficulties and the one group that appears to be nearing total distress is tires. Check this chart out and let's see if key price support holds:
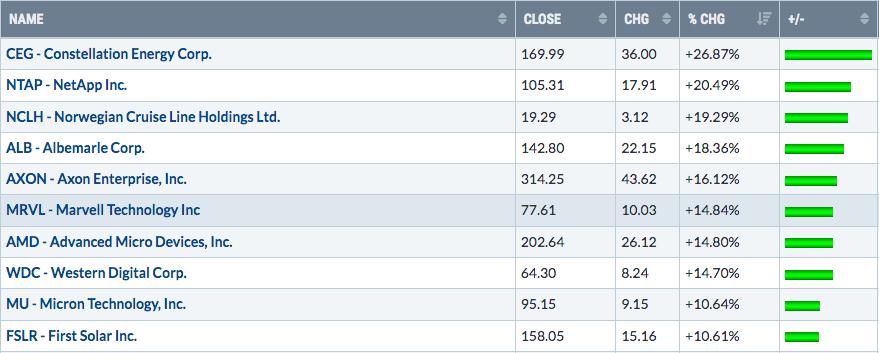
Top 10 Stocks - S&P 500/NASDAQ 100
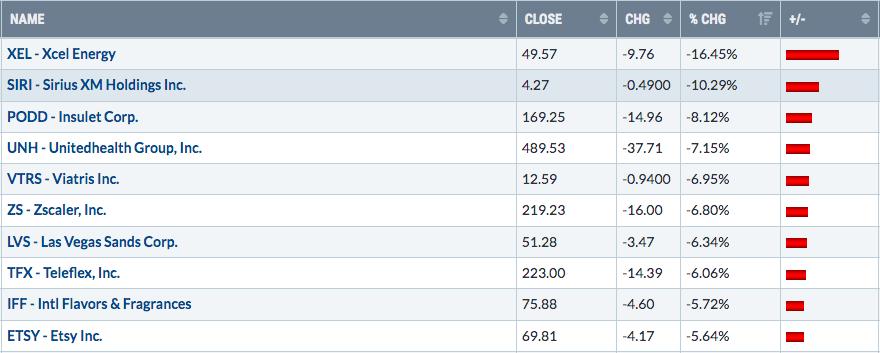
Bottom 10 Stocks - S&P 500/NASDAQ 100
Big Picture
As we see small caps and mid caps break out, expect all the breadth naysayers to grow very quiet in coming weeks. Apple (AAPL, -12%), Tesla (TSLA, -35%), and Alphabet (GOOGL, -13%) are all significantly off their 52-week highs, yet who would have predicted the NASDAQ moving to an all-time high at the same time, coinciding with these stalwarts' weakness?
Rotation is a powerful part of secular bull market advances. The money leaving AAPL, TSLA, and GOOGL has not left U.S. equities. It's ROTATED to other areas like small caps and mid caps. This is why it is not ever a good idea to bet against these bull market rallies. Next, we'll hear bearish-minded analysts saying that it's unlikely the stock market can continue higher without some of its market-cap leading stocks like AAPL, TSLA, and GOOGL. The media BS never ends.
Stay the bullish course and let's be reminded by this Big Picture chart:
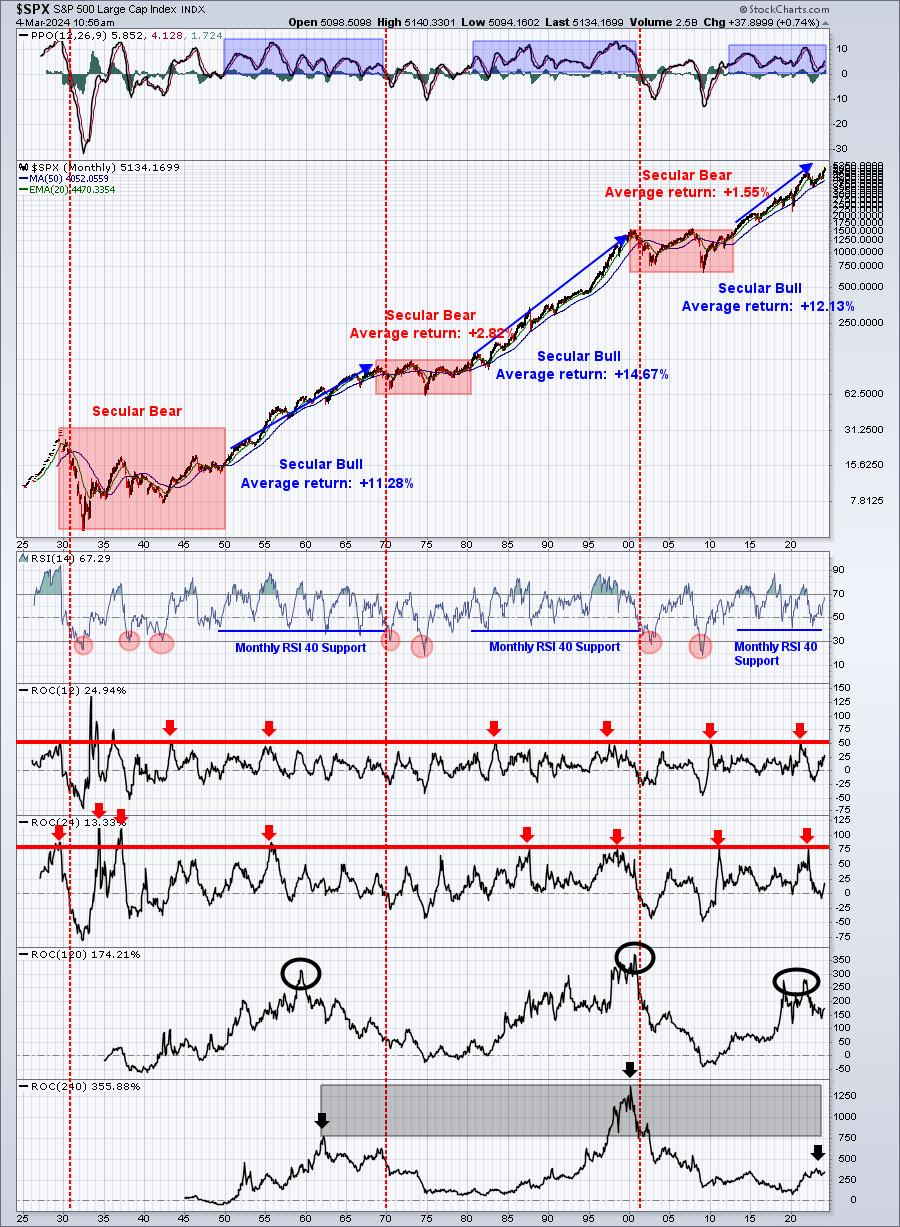
That monthly PPO just keeps moving up beautifully above the centerline. It'll take quite awhile for us to reach a monthly PPO of 10, but I'd guess that's where we'll head eventually.
Sentiment
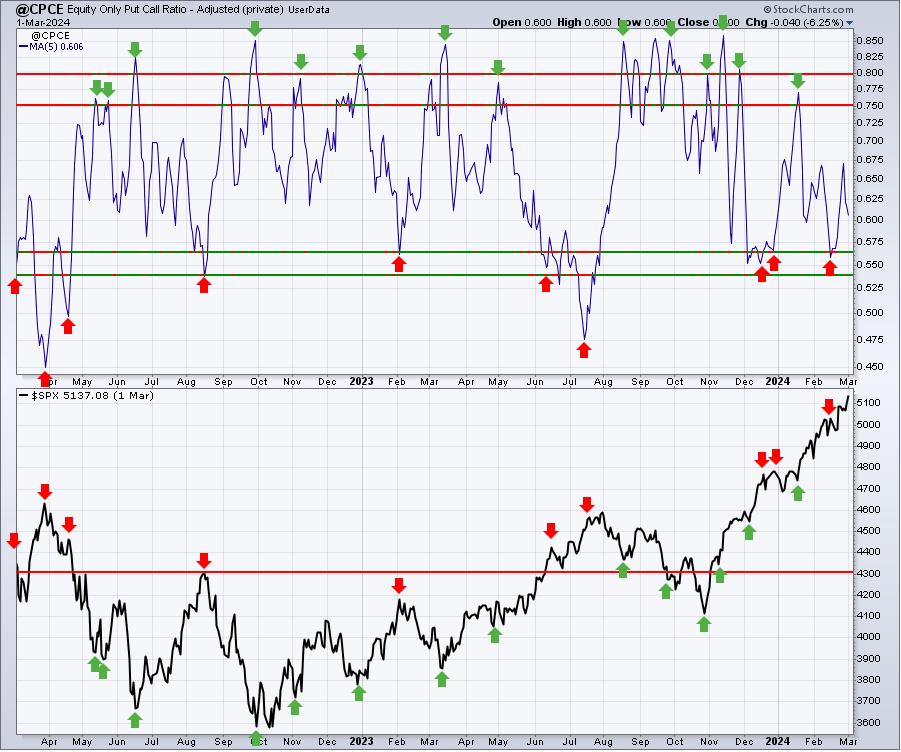
Our short-term sentiment signal is the 5-day SMA of the equity only put call ratio ($CPCE). It didn't exactly do a great job of forecasting weakness ahead when this 5-day reading became quite complacent and approached .55. We saw very minor stock market weakness, but it did not last long at all. Right now, this signal is between .57 and .75, at .61, which is neutral. In other words, this CPCE reading is providing us no actionable signal:
The 253-day SMA of the CPCE, however, has clearly rolled over and that is VERY GOOD NEWS for bulls:
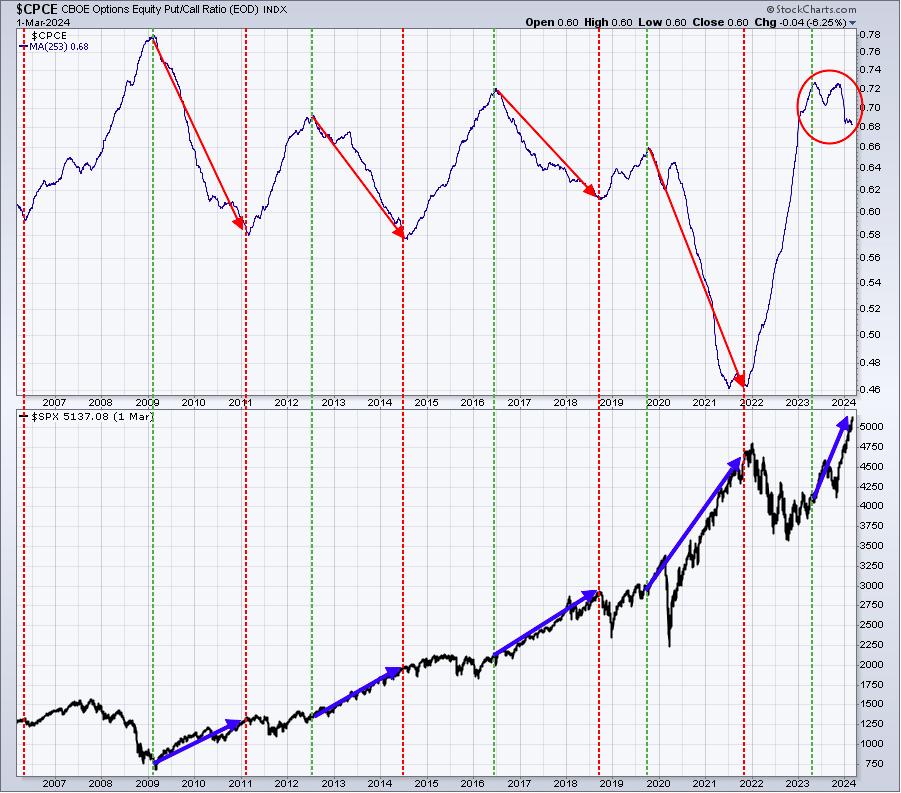
When this long-term moving average finally reverses off of a top, it provides us an extremely valuable bullish signal historically. The opposite is true when it bottoms and begins to turn higher, which is what we saw at the end of 2021/start of 2022, just before the cyclical bear market.
This is one of my most important signals, certainly my most important sentiment signal, and it is clearly VERY BULLISH.
Bet against it at your own risk.
Rotation/Intermarket Analysis
Here's the latest look at our key intraday ratios as we follow where the money is traveling:
QQQ:SPY
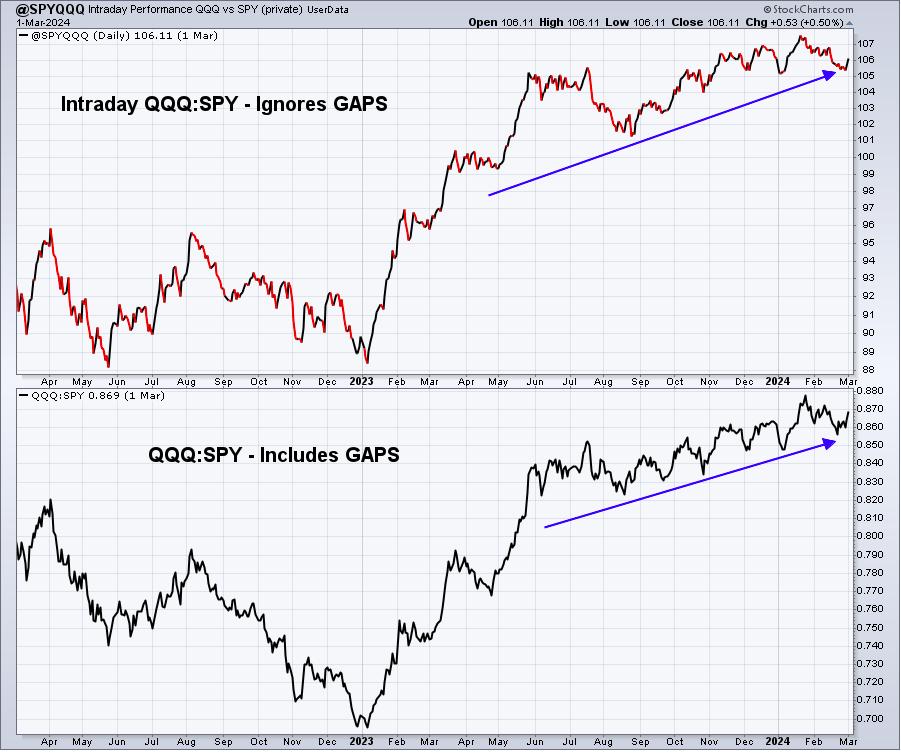
While the name of this chart says "@SPYQQQ", the ratio is actually based on the QQQ price divided by the SPY. I simply picked a bad name for my User Defined Index. I like the fact that the QQQ turned up vs. the SPY. I believe we could sustain a bull market in other ways, but it's always helpful to have the more growth-oriented QQQ leading the more value-oriented SPY higher on an intraday basis.
IWM:QQQ
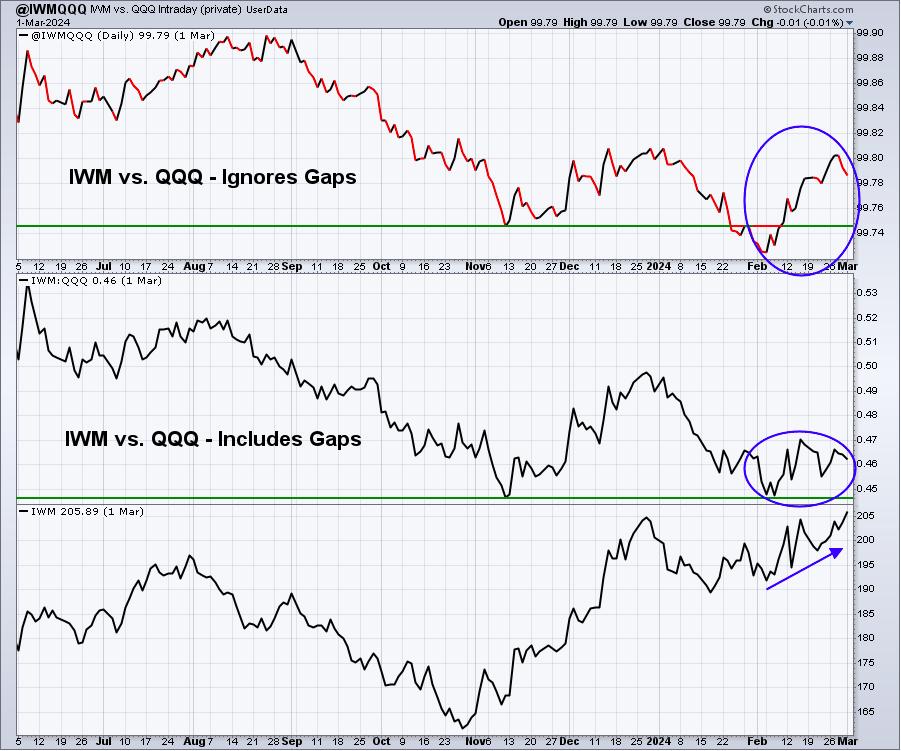
If you're a small cap fan, you'd like to see this IWM:QQQ ratio move higher as it would suggest that key rotation between the two is taking place. Again, the IWM can keep moving higher without support from this intraday rotation signal, but if we're looking for small caps to outperform the QQQ over the balance of 2024, then these relative strength lines need to push higher. We saw them roll over a bit late last week and it's something I'll be keying in on this week.
XLY:XLP
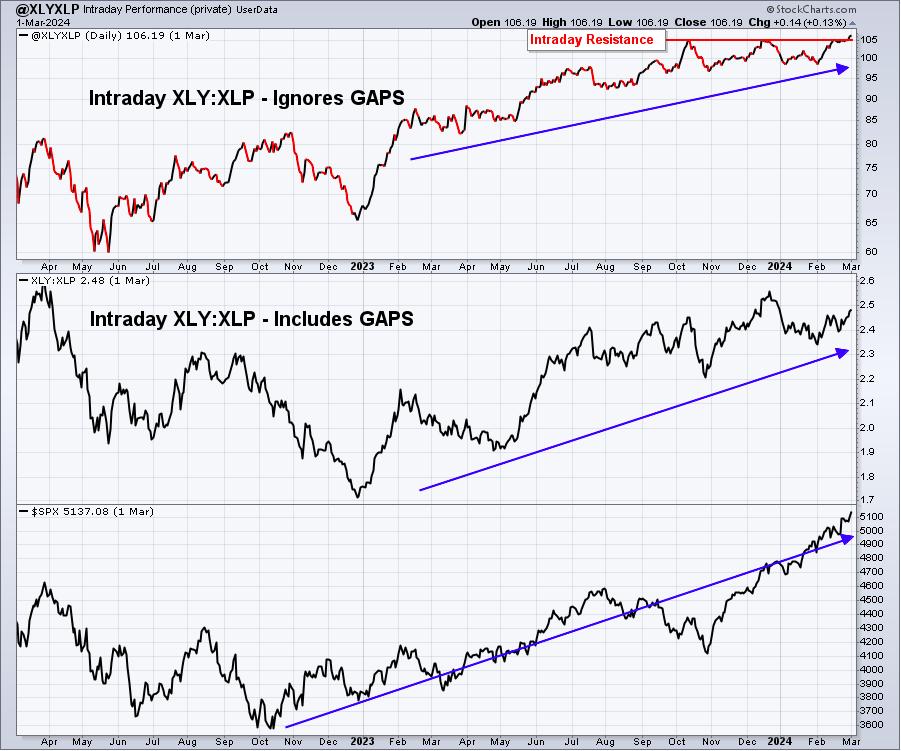
It's subtle, but I see an XLY:XLP intraday breakout last week. If you've been following me and EarningsBeats.com for awhile, you know that I believe the XLY:XLP ratio is as important as ANYTHING from an intermarket perspective. Our GDP is comprised of roughly two-thirds consumer spending. It's very important to understand if big Wall Street firms believe the aggressive consumer discretionary sector (XLY) will outperform the defensive consumer staples sector (XLP). The positive correlation between the direction of the S&P 500 and the direction of the XLY:XLP ratio is UNDENIABLE. So if the S&P 500 keeps making new highs and the XLY:XLP ratio trends lower, it's a warning sign. It's just ONE warning sign, but it's an important signal. Any time I see a new XLY:XLP breakout, it only adds to my bullish mindset.
Sustainability Ratios
The XLY:XLP is certainly one ratio that I consider to be a sustainability ratio. When the S&P 500 is rising, I like to see my key sustainability ratios rising as well. Failure to do so may not mean the market will reverse, but it tells me to at least consider that possibility. Here is a chart of the S&P 500 with growth vs. value ratios in panels below that cover 3 different asset classes - large cap, mid cap, and small cap:
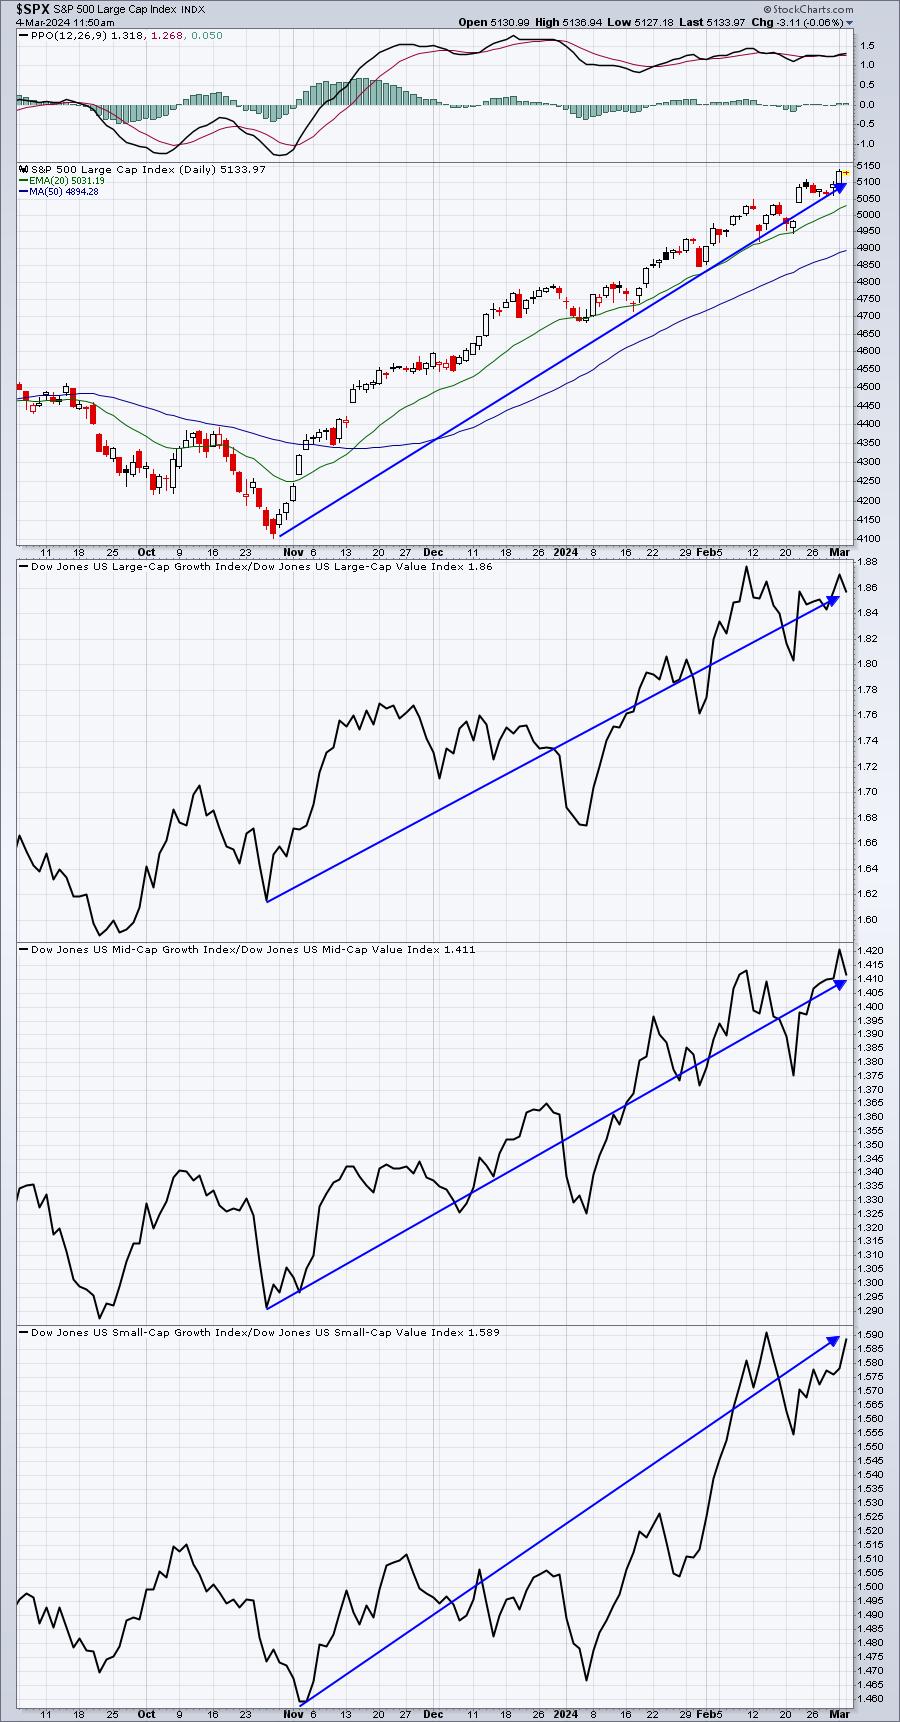
It's difficult to misunderstand the signal that's being sent to us here. Growth stocks continue to dominate value stocks, which reeks of a "risk on" environment. Risk-on environments mean that investors are willing to take risks to achieve higher returns. I won't be calling for bear markets, or even corrections, with this type of market environment.
Trade Setup
Since beginning this Weekly Market Report in early September, I've discussed the long-term trade candidates below that I really like. Generally, these stocks have excellent long-term track records and many pay nice dividends that mostly grow every year. Only in very specific cases (exceptions) would I consider a long-term entry into a stock that has a poor or limited long-term track record. Check these out:
- JPM
- BA
- FFIV
- MA
- GS - breaking above previous trendline resistance near 350-355 was bullish
- FDX
- AAPL
- CHRW
- JBHT
- STX
- HSY
- DIS
- MSCI
- SBUX
- KRE
I'm going to add our first utility stock. Historically, utility stocks tend to perform quite well during March and April, so the idea here is to add a solid long-term performer with respect to capital appreciation, knowing that the stock pays a very nice dividend. There were a number of very solid utility stocks to consider, but I've chosen to go with Consolidated Edison (ED). Here's the long-term track record, showing nice capital appreciation over time:
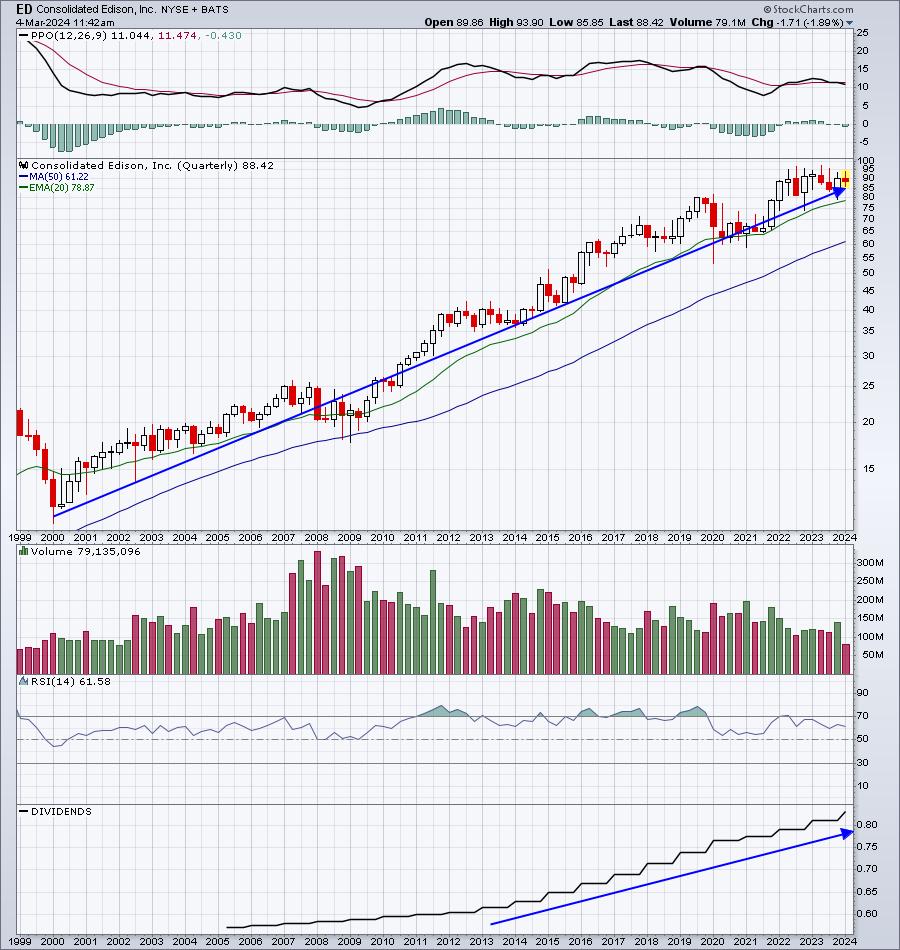
I love the fact that the monthly PPO on ED has been positive for 25 years and running. It tells us that it doesn't matter if we're in a bull market or a bear market, ED maintains its long-term positive upside momentum. Also, note the consistently-rising dividend. For those seeking both capital appreciation AND a solid dividend payment, ED's long-term chart and dividend yield of 3.82% would seem to satisfy both.
Keep in mind that our Weekly Market Reports favor those more interested in the long-term market picture. Therefore, the list of stocks above are stocks that we believe are safer to own with the long-term in mind. Nearly everything else we do at EarningsBeats.com favors short-term momentum trading, so I wanted to provide an explanation of what we're doing with this list.
Looking Ahead
Upcoming Earnings:
Earnings season is winding down, but we still have companies reporting from time to time that could have an impact on our major indices. I've identified what I believe are key companies that will report this week, with their respective market caps in parenthesis. This is NOT a list of ALL companies reporting this week, so please be sure to check for earnings of any companies that you own or add. Any companies in BOLD represent stocks in one of our Portfolios:
- Monday: None
- Tuesday: CRWD ($78 billion), TGT ($71 billion), ROST ($50 billion)
- Wednesday: None
- Thursday: AVGO ($603 billion), COST ($330 billion)
- Friday: None
Key Economic Reports:
- Monday: None
- Tuesday: January factory orders
- Wednesday: February ADP employment report
- Thursday: Initial jobless claims, Q4 productivity & costs
- Friday: February nonfarm payrolls
Historical Data
I'm a true stock market historian. I am absolutely PASSIONATE about studying stock market history to provide us more clues about likely stock market direction and potential sectors/industries/stocks to trade. While I don't use history as a primary indicator, I'm always very aware of it as a secondary indicator. I love it when history lines up with my technical signals, providing me much more confidence to make particular trades.
Below you'll find the next two weeks of historical data and tendencies across the 3 key indices that I follow most closely:
S&P 500 (since 1950)
- March 4: +52.43%
- March 5: +24.57%
- March 6: -19.08%
- March 7: -65.68%
- March 8: +3.73%
- March 9: -18.01%
- March 10: +41.86%
- March 11: +37.84%
- March 12: -38.59%
- March 13: +46.36%
- March 14: -21.54%
- March 15: +69.71%
- March 16: +32.01%
- March 17: +85.33%
NASDAQ (since 1971)
- March 4: +81.27%
- March 5: -2.45%
- March 6: -27.03%
- March 7: -65.06%
- March 8: +15.37%
- March 9: -39.99%
- March 10: +42.11%
- March 11: +32.40%
- March 12: -94.79%
- March 13: +123.39%
- March 14: -26.53%
- March 15: +10.10%
- March 16: -8.26%
- March 17: +97.19%
Russell 2000 (since 1987)
- March 4: +100.91%
- March 5: -32.60%
- March 6: -52.45%
- March 7: -33.62%
- March 8: +15.13%
- March 9: -76.04%
- March 10: +10.07%
- March 11: +19.85%
- March 12: -81.26%
- March 13: +93.19%
- March 14: -43.91%
- March 15: -27.25%
- March 16: -89.92%
- March 17: +159.72%
The S&P 500 data dates back to 1950, while the NASDAQ and Russell 2000 information date back to 1971 and 1987, respectively.
New money tends to send U.S. equities higher to open March, but later in the week we could experience profit taking, which is usually seen for a few days after the bullish opening of the month.
Final Thoughts
Last week, I gave the edge to the bears and we saw what happened - another push higher on Friday to all-time highs and a key close above 5100 on the S&P 500. It's difficult to even think about a position other than a bullish one, until we see some kind of deterioration in price action and that simply hasn't happened.
Here are several things to consider in the week ahead:
- Nonfarm payrolls. This is another key piece that the Fed will be watching closely. The current expectation is for jobs to come in around 188,000. A number significantly higher could spook traders, while a modest number at or below this level could be seen as nirvana - low job growth and falling inflation. That would provide the Fed a big opportunity to begin more honest discussions about when we might expect to see the first of several rate cuts.
- Interest rates. The 10-year treasury yield ($TNX) closed on Friday at 4.18%, slightly below key yield support at 4.20%. Today, we've seen the TNX jump 4 basis points to 4.22%. While yield bulls and bears are contesting this 4.20%, I believe next week's (Tuesday, March 12th) February CPI report will be the real key.
- Small caps (IWM) and mid caps (MDY). We've spent most of the past 18 months talking about relative strength on the NASDAQ, then the S&P 500 and Dow Jones. Let's don't overlook the IWM and MDY, which are just now making key price breakouts. Should the more prominent stocks found on the NASDAQ 100 and S&P 500 slow down or take a break, money rotating could send small and mid caps much, much higher. It's probably a bit too early to make this call, but it'll certainly be something I continue to watch.
- Rotation. I spent some time above, discussing what I'm seeing in rotation and what we might expect to see as we move forward. This is a VERY important factor in sustaining bull market advances.
- Earnings. They're slowing down for sure, but our portfolios could be impacted by 3 companies that report the next couple days. CRWD, AVGO, and COST all report their latest quarterly results. All 3 show exceptional AD lines and they remain leaders amongst their industry peers. I'm looking for all 3 to report excellent results, but what type of market reaction might we see? Those reactions will likely have a significant short-term impact on our Model (CRWD, COST) and Aggressive (AVGO) portfolios.
- Sentiment. Just because the 5-day (SMA) CPCE's recent bearish call didn't result in much selling, I'm not abandoning one of the most important short-term signals for traders. If U.S. equities keep rising, we could see another 5-day CPCE reading back near or below that .55 reading that typically marks tops. It would be foolish to ignore it.
Feedback
If you'd like to share your thoughts on our Weekly Market Report, positive or negative, you can reach us at "[email protected]".
Happy trading!
Tom