
EB Weekly Market Report - Monday, March 11, 2024
ChartLists Updated
Several ChartLists have been updated on our website since Friday:
- Strong Earnings (SECL)
- Strong Future Earnings (SFECL)
- Raised Guidance (RGCL)
- Bullish Trifecta (BTCL)
- Short Squeeze (SSCL)
- Upcoming Earnings (5)
Weekly Market Recap
Major Indices
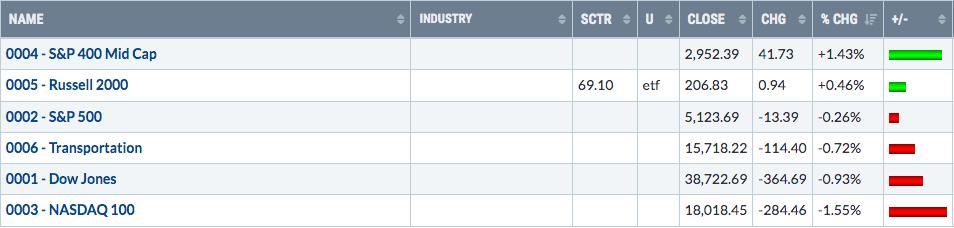
The NASDAQ 100 ($NDX) lagged last week, while mid caps ($MID) and small caps (IWM) outperformed. This rotation is bullish in my view as we're not seeing selling across the board. Instead, rotation is keeping most money in U.S. equities. We do have to be careful in the week ahead as there are some BIG economic reports, particularly February CPI, and it's March options expiration week. Anything goes!
Sectors
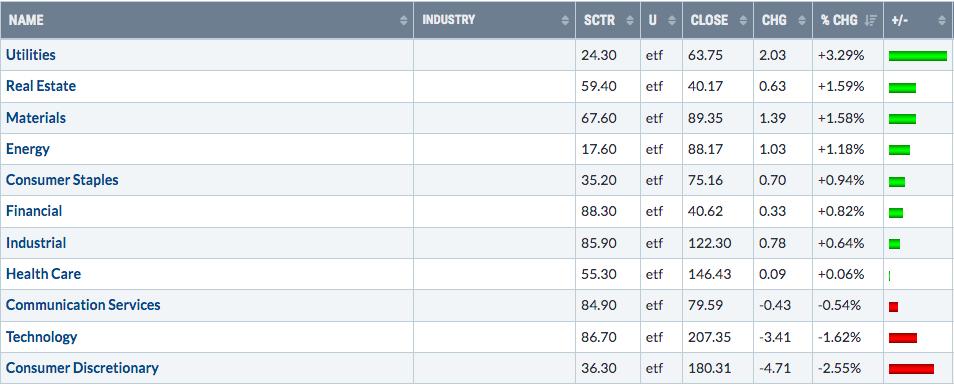
It looks to me like traders are being somewhat cautious, based on leadership last week. The top 5 sectors are either defensive or neutral sectors. Our three most aggressive sectors were the worst-performing sectors last week. The S&P 500 made a fairly significant top on February 12th, before recently trading slightly above that high. I thought it would be interesting to look at sector leadership over the past month. Check this out:
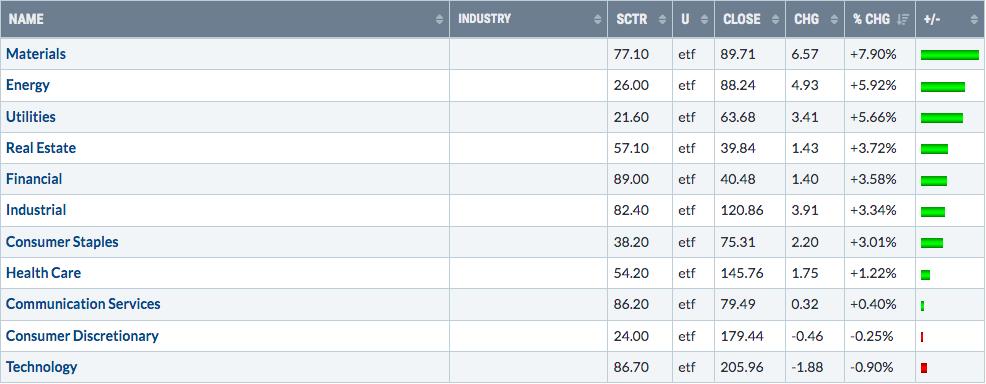
This absolutely reeks of rotation. The S&P 500 has moved higher, but it's been totally due to rotation to defensive areas from aggressive areas. This is a signal that we should pay attention to as it could be the big Wall Street firms moving more towards safety - at least in the near-term. My long-term signals are clearly bullish, so I'm not concerned about a MAJOR selloff, but further short-term selling remains a high risk. Options expiration adds to this possibility.
Top 10 Industries Last Week
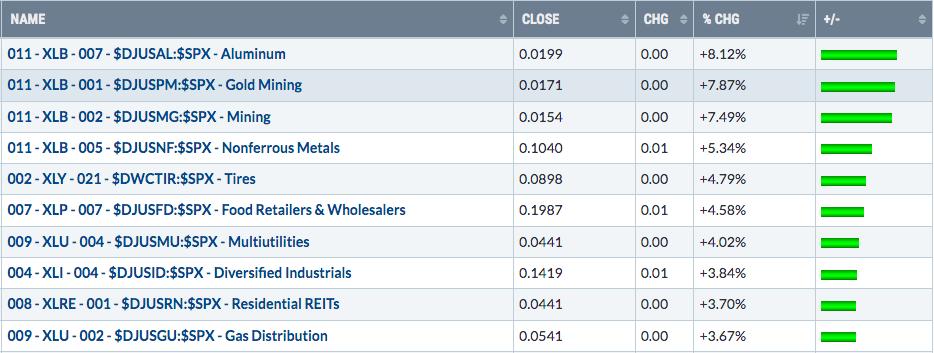
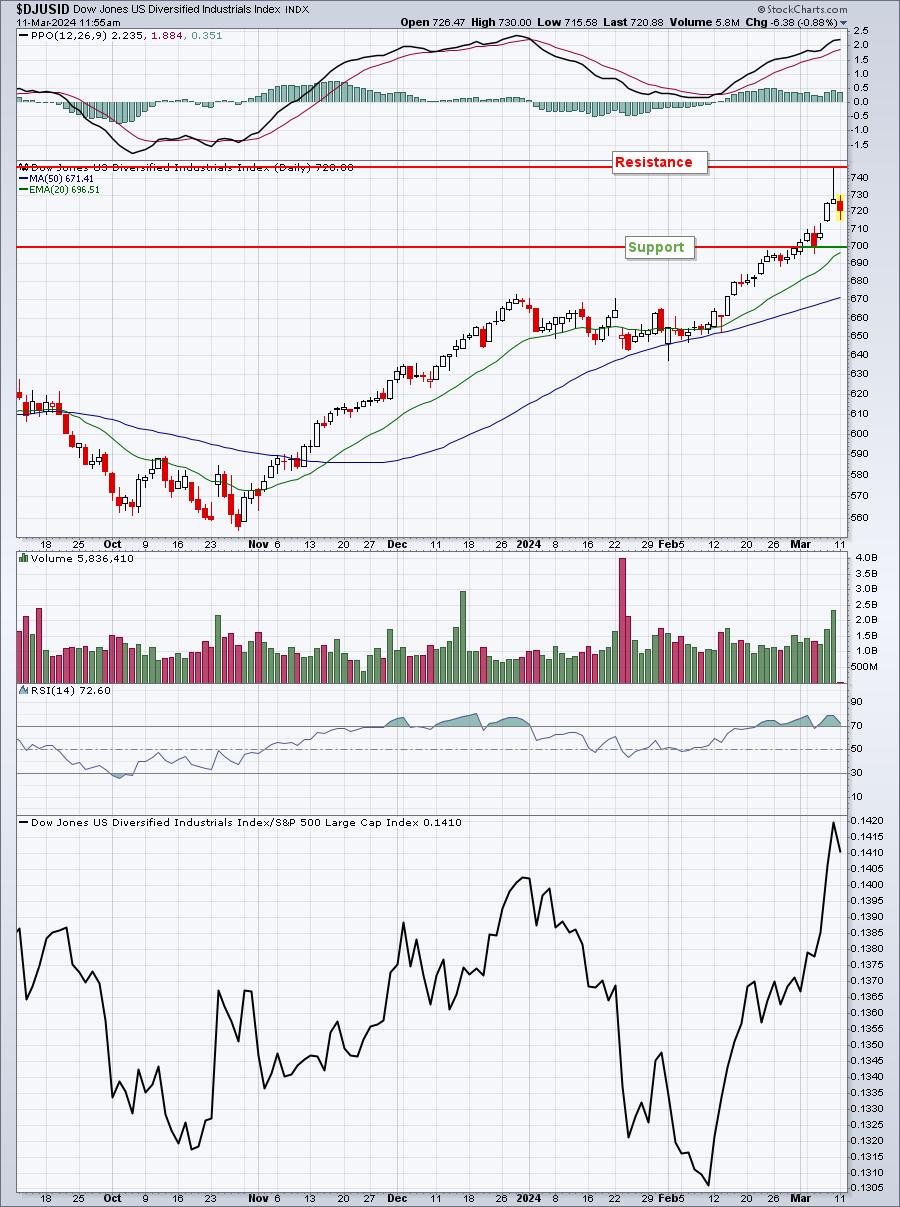
There is only one somewhat aggressive industry group ($DJUSID) on this list of leaders last week and it even printed a reversing, shooting star candle on Friday:
Bottom 10 Industries Last Week
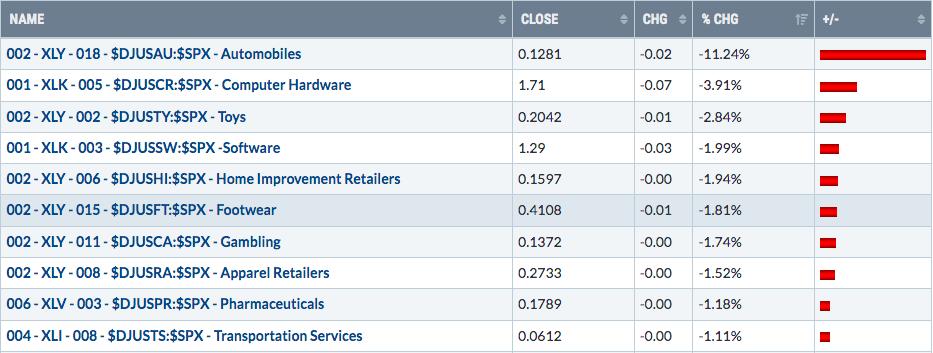
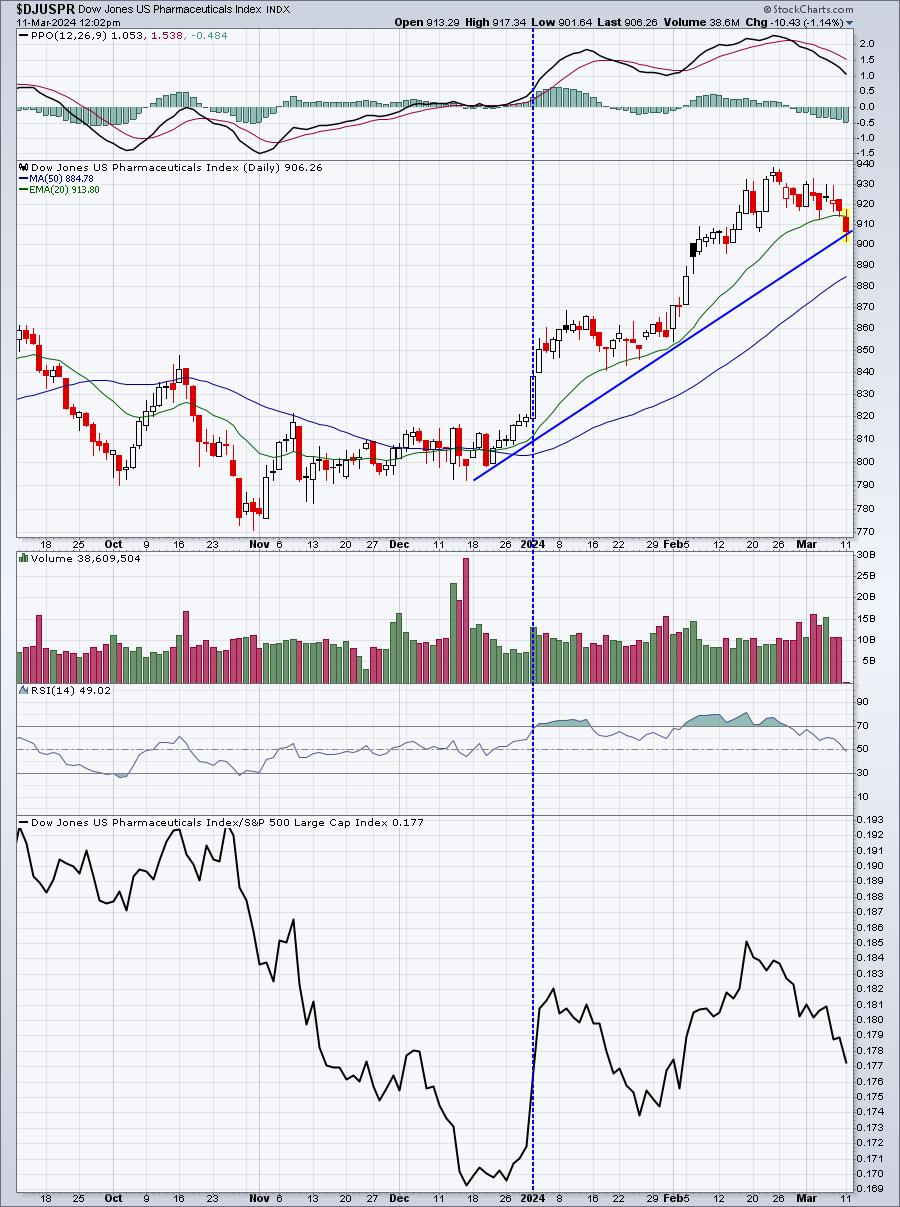
This is another visual that tells us money is rotating away from consumer discretionary (XLY) and technology (XLK). Of the 10 groups lagging the most last week, the worst 8 performers belong to either the XLY or XLK. And #10 belongs to industrials (XLI). Pharmaceuticals ($DJUSPR) is the only defensive group on this list and this group has been in a significant uptrend in 2024:
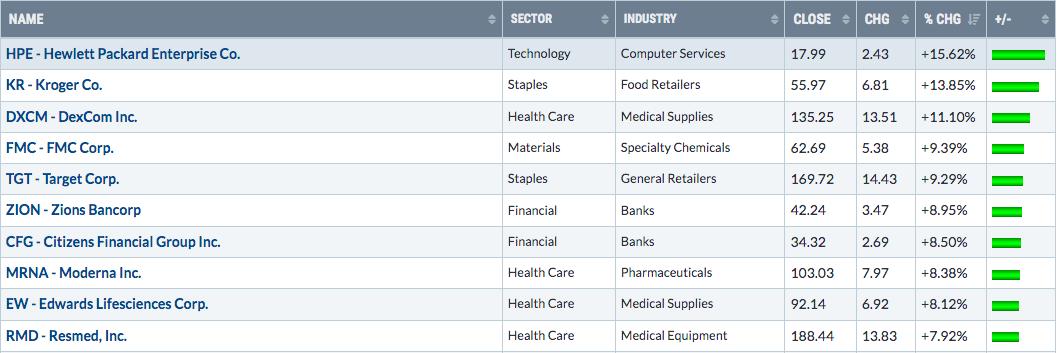
Top 10 Stocks - S&P 500/NASDAQ 100
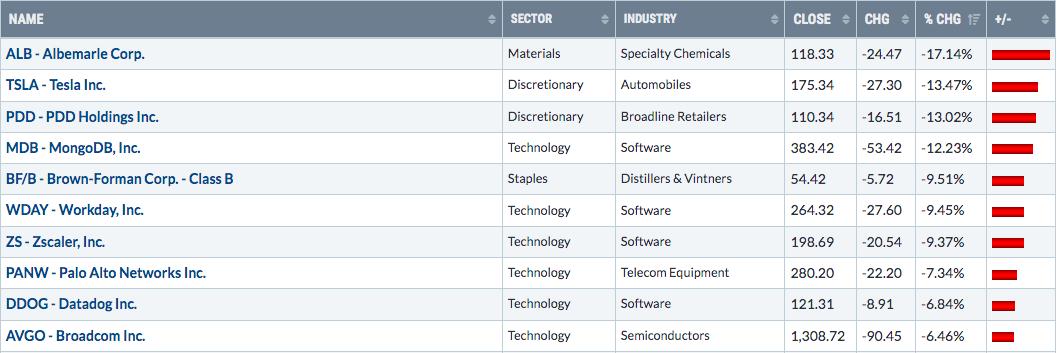
Bottom 10 Stocks - S&P 500/NASDAQ 100
Big Picture
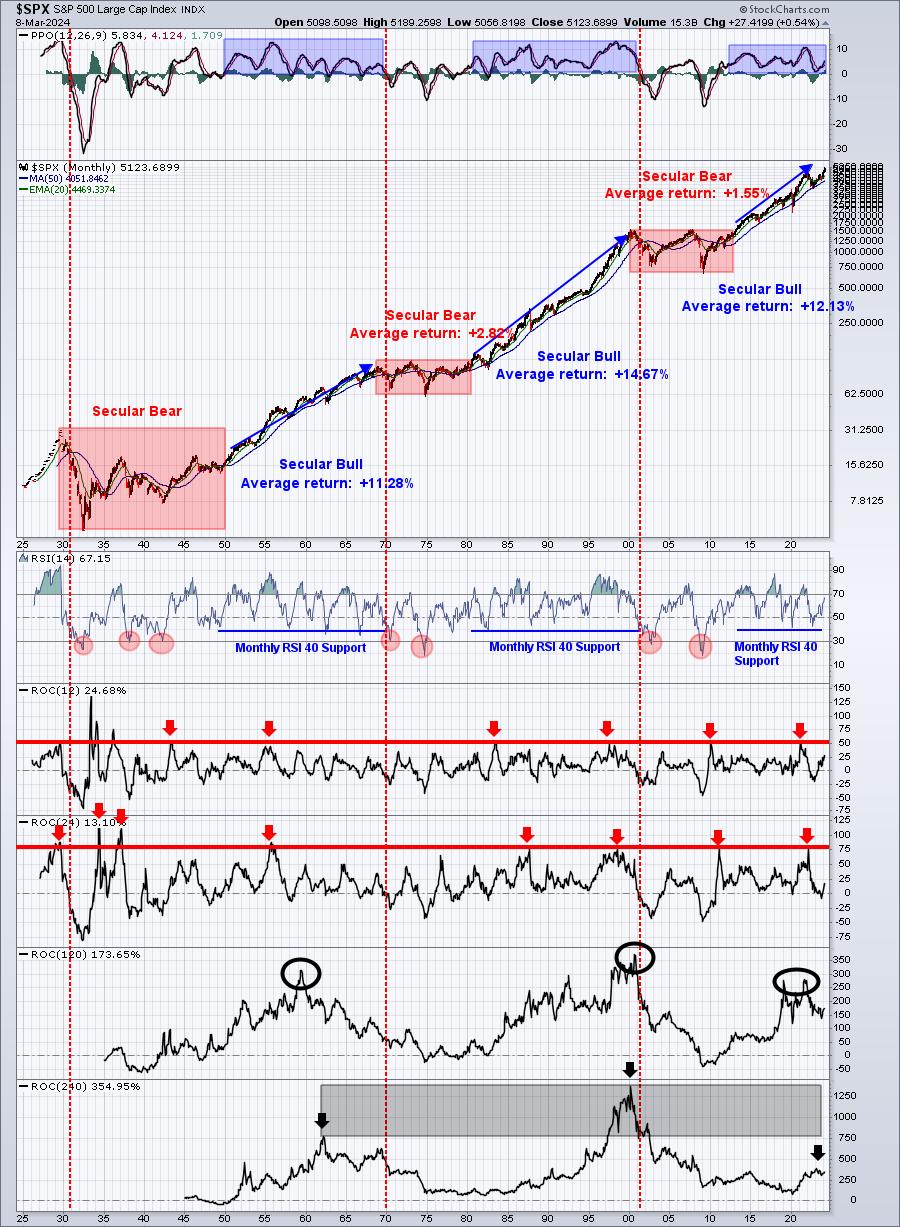
In the very short-term, we're seeing some rotation into other areas of the market, which are trying to lead our major indices higher. That's not a great recipe for success and can be viewed bearishly. But with my longer-term signals much more positive and, given the resilience of secular bull markets, a more bullish view looks at recent rotation as much wider participation in the ongoing uptrend. This is the hallmark of secular bull markets.
I tend to listen most closely to my long-term signals, understanding that we'll see volatility and potentially scary developments in the stock market quite often. I'll stick to that philosophy, suggesting that any further rotation or, even (gasp!) selling, is a necessary evil.
Stay the bullish course and remember that this Big Picture chart does NOT care a bit about the short-term market issues that we discuss frequently:
If trading is your thing, though, understand that the stock market remains short-term vulnerable, given the defensive rotation, overbought conditions on key areas like semiconductors ($DJUSSC), and the calendar period of the year - 2nd half of Q1.
Sentiment
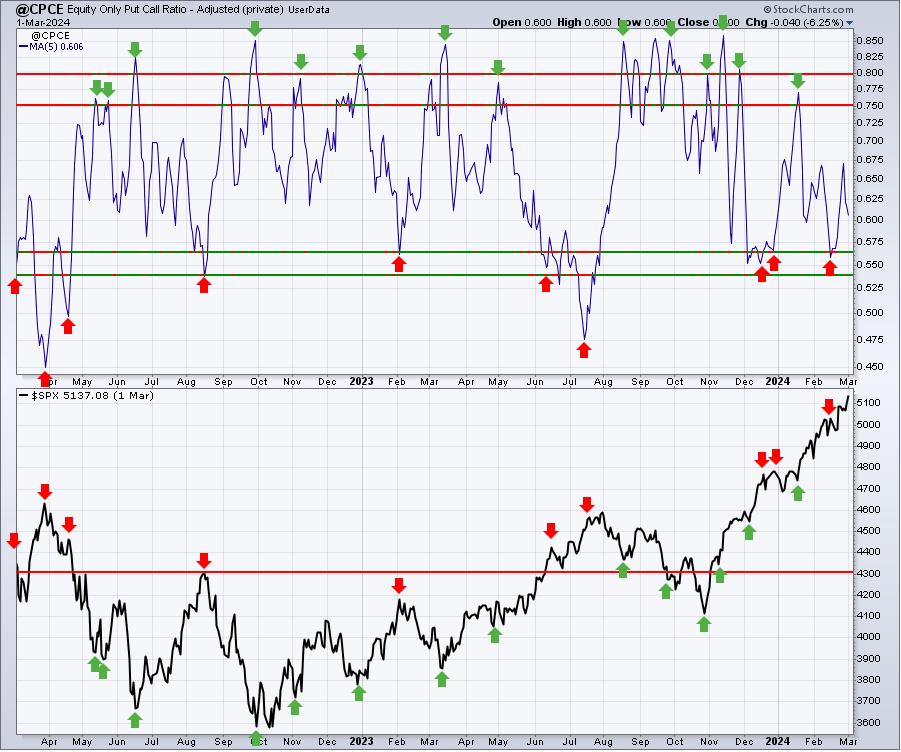
Right now, our short-term 5-day SMA of the equity only put call ratio ($CPCE) is in neutral territory. If we do see the stock market continue rising, a drop in the 5-day SMA of the CPCE below .56 or so would be a further short-term warning sign of a stop. Currently, however, we're fine:
The 253-day SMA of the CPCE, however, has clearly rolled over and that is VERY GOOD NEWS for bulls. I showed a chart of it in last week's EB Weekly Market Report and it doesn't change much. If you'd like to see a chart, simply refer to last week's report.
Rotation/Intermarket Analysis
Here's the latest look at our key intraday ratios as we follow where the money is traveling:
QQQ:SPY
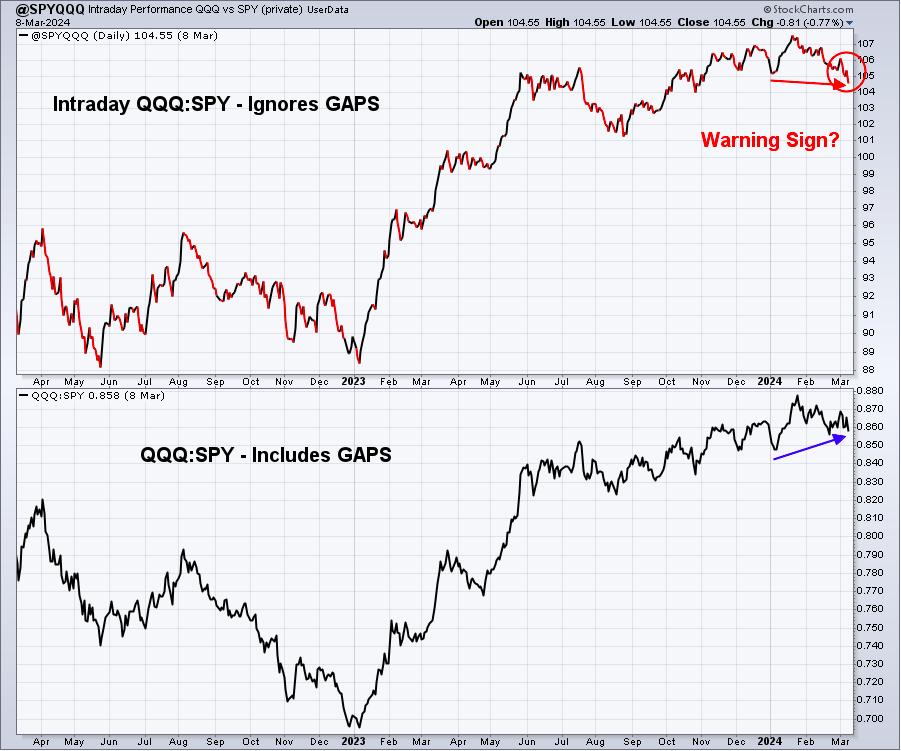
During the day, we're definitely seeing money move away from the aggressive growth areas of the market and this is the chart that helps us visualize it. I'm certainly not viewing this chart as one that SCREAMS get out of stocks as the drop in the ratio is fairly subtle. It happens from time to time, but make no mistake about it, this ratio moving higher is much more bullish than the alternative.
IWM:QQQ
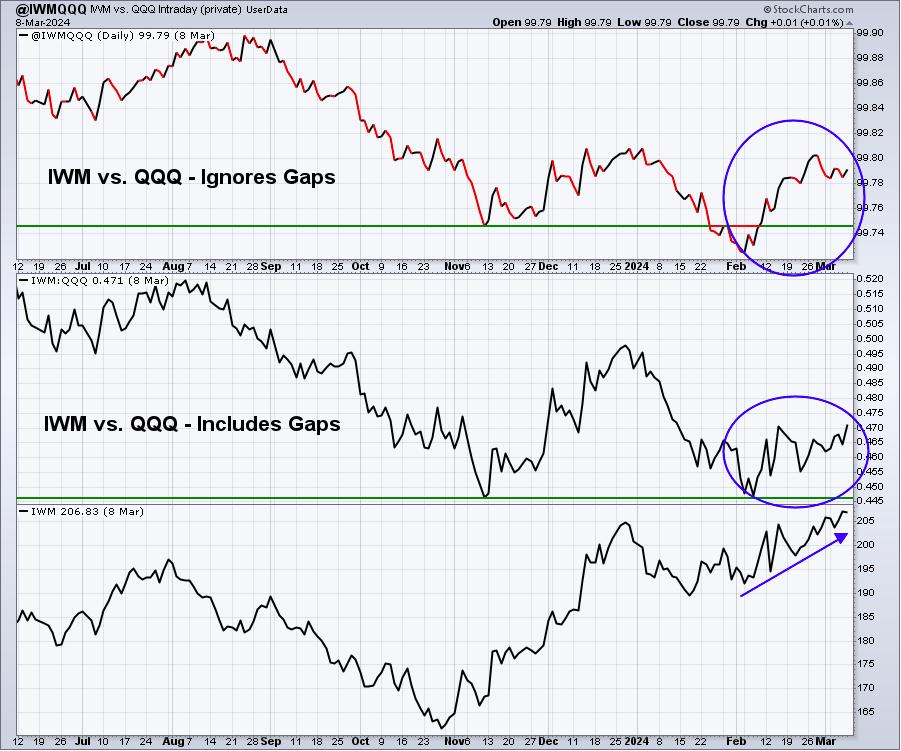
This chart keeps small cap bulls fairly optimistic. Both ratios (including and excluding gaps) are trending higher and that tells us that, for now, rotation from large caps to small caps is alive and kicking. Is it temporary or is it the start of further rotation in 2024. Personally, I believe it's the latter, but this is a chart to watch to provide us a more objective answer as the year moves on.
XLY:XLP
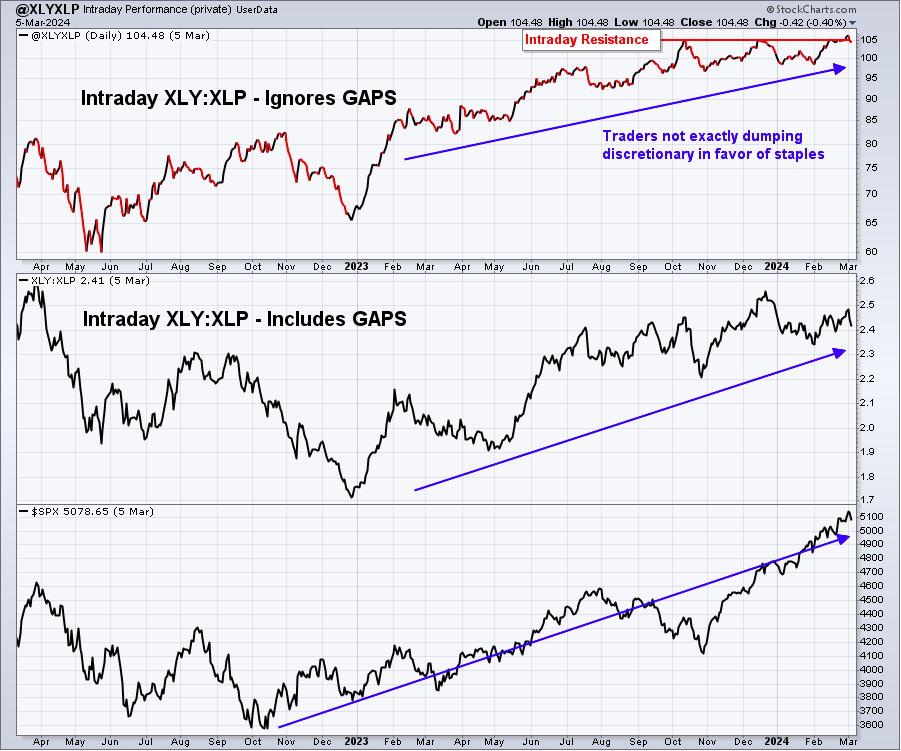
If we ignore gaps and only look at what happens from the opening bell to the closing bell, this XLY:XLP ratio suggests that there's been little rotation into the defensive staples area, and that's a bullish signal. Last week, I pointed out and we saw a minor breakout in this ratio, which is bullish. It's failed to hold that breakout, but the uptrend remains in play.
Interest Rates, The Dollar, and Select Commodities
While short-term interest rates are expected to decline at some point during 2024, the long-term U.S. 10-year treasury yield ($UST10Y) vs. Germany's 10-year treasury yield ($DET10Y) has always been the relationship that I watch to evaluate the strength of our economy vs. Germany's. That relationship helps us determine the likely direction in the U.S. Dollar ($USD). In turn, the $USD can provide us clues about future commodity performance. It's kind of like a domino effect.
Let's start with that U.S. - Germany relationship in terms of 10-year treasury yields ($UST10Y-$DET10Y):
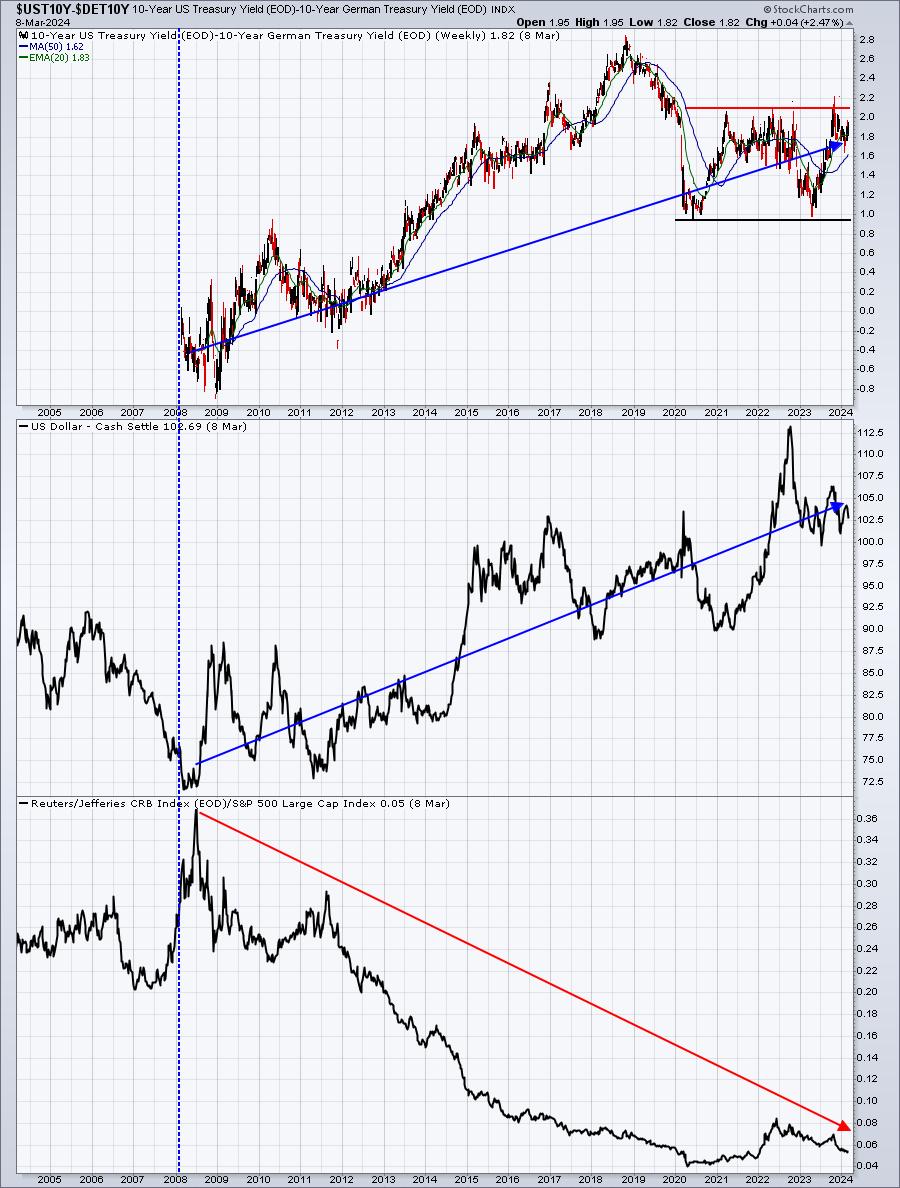
There are periods of counter trend moves, but I believe it's obvious that interest rates in the U.S. are still rising vs. Germany. That suggests to me that our economy is stronger, lifting our currency. The bottom panel tells a story as well. When the U.S. economy is strong or strengthening faster than other parts of the world, the dollar rises, putting downtrend RELATIVE pressure on commodities. Keep in mind that the bottom panel of this chart shows commodity performance vs. the benchmark S&P 500. It tells me to avoid commodities for the most part, despite their recent relative gains (XLB and XLE have shown some leadership of late). I don't believe it'll last as I trust the current uptrend in the dollar.
Trade Setup
Since beginning this Weekly Market Report in early September, I've discussed the long-term trade candidates below that I really like. Generally, these stocks have excellent long-term track records and many pay nice dividends that mostly grow every year. Only in very specific cases (exceptions) would I consider a long-term entry into a stock that has a poor or limited long-term track record. Check these out:
- JPM
- BA
- FFIV
- MA
- GS - breaking above previous trendline resistance near 350-355 was bullish
- FDX
- AAPL
- CHRW
- JBHT
- STX
- HSY
- DIS
- MSCI
- SBUX
- KRE
- ED
Last week, I added our first utility stock, Consolidated Edison (ED), a very strong performing utility stock over the years. I'm a little skeptical of the overall market right now, so I'll pass on adding any other stocks to this long-term list of buy and holds.
Keep in mind that our Weekly Market Reports favor those more interested in the long-term market picture. Therefore, the list of stocks above are stocks that we believe are safer to own with the long-term in mind. Nearly everything else we do at EarningsBeats.com favors short-term momentum trading, so I wanted to provide an explanation of what we're doing with this list.
Looking Ahead
Upcoming Earnings:
Earnings season is winding down, but we still have companies reporting from time to time that could have an impact on our major indices. I've identified what I believe are key companies that will report this week, with their respective market caps in parenthesis. This is NOT a list of ALL companies reporting this week, so please be sure to check for earnings of any companies that you own or add. Any companies in BOLD represent stocks in one of our Portfolios:
- Monday: ORCL ($315 billion)
- Tuesday: None
- Wednesday: LEN ($46 billion), DLTR ($33 billion)
- Thursday: ADBE ($252 billion), DG ($35 billion), ULTA ($27 billion)
- Friday: None
Key Economic Reports:
- Monday: None
- Tuesday: February CPI
- Wednesday: None
- Thursday: Initial jobless claims, February PPI, February retail sales, January business inventories
- Friday: March empire state manufacturing index, February industrial production and capacity utilization, March consumer sentiment
Historical Data
I'm a true stock market historian. I am absolutely PASSIONATE about studying stock market history to provide us more clues about likely stock market direction and potential sectors/industries/stocks to trade. While I don't use history as a primary indicator, I'm always very aware of it as a secondary indicator. I love it when history lines up with my technical signals, providing me much more confidence to make particular trades.
Below you'll find the next two weeks of historical data and tendencies across the 3 key indices that I follow most closely:
S&P 500 (since 1950)
- March 11: +37.84%
- March 12: -38.59%
- March 13: +46.36%
- March 14: -21.54%
- March 15: +69.71%
- March 16: +32.01%
- March 17: +85.33%
- March 18: +39.17%
- March 19: -33.38%
- March 20: -13.99%
- March 21: -14.69%
- March 22: -25.39%
- March 23: +32.57%
- March 24: +16.48%
NASDAQ (since 1971)
- March 11: +32.40%
- March 12: -94.79%
- March 13: +123.39%
- March 14: -26.53%
- March 15: +10.10%
- March 16: -8.26%
- March 17: +97.19%
- March 18: +42.85%
- March 19: -19.90%
- March 20: -76.24%
- March 21: +12.37%
- March 22: -7.85%
- March 23: +38.54%
- March 24: +7.04%
Russell 2000 (since 1987)
- March 11: +19.85%
- March 12: -81.26%
- March 13: +93.19%
- March 14: -43.91%
- March 15: -27.25%
- March 16: -89.92%
- March 17: +159.72%
- March 18: +23.53%
- March 19: +23.45%
- March 20: -97.83%
- March 21: +19.15%
- March 22: -94.32%
- March 23: +13.92%
- March 24: +29.36%
The S&P 500 data dates back to 1950, while the NASDAQ and Russell 2000 information date back to 1971 and 1987, respectively.
Historically, March provides swings in both directions, resulting overall in docile month. The March 23rd to April 10th period, however, does lean towards the bulls. Here are the annualized returns for each major index over this period:
- S&P 500 (since 1950): +22.20%
- NASDAQ (since 1971): +16.06%
- Russell 2000 (since 1987): +26.00%
Final Thoughts
Which way is the market heading? That's the big question, right? I don't know the answer, but I can keep reminding you that betting against a secular bull market usually gets you in a lot of trouble. Personally, I will not take a bearish stance, meaning I will not short, during a secular bull market UNLESS I believe an extended period of selling is likely and directly in front of us. I see the "possibility" of selling and/or consolidation based upon many factors I've discussed in this report, but I am not expecting a length decline.
Here are several things to consider in the week ahead:
- Inflation. A month ago, the January Core CPI was released and it came in higher than expected, spooking the stock market. But, if you recall, the selling lasted less than 6 hours before a quick rally erased the entire CPI-related drop. I suspect another higher-than-expected number tomorrow morning would have a similar effect - at least initially - with a price drop. I doubt there'd be a whole lot of selling after that, however.
- Interest rates. Is the 10-year treasury yield ($TNX) telling us something? We've seen a lot of bond buying (with corresponding yields falling) heading into tomorrow's CPI report. The TNX, which had yield support near 4.20%, has fallen 25 basis points over the past couple weeks and now resides at 4.09%. This is LOWER than the yield was at the time of the January CPI report a month ago. It sure seems like the bond market is anticipating a bullish February CPI reading (lower than expected).
- Rotation. We've seen rotation into more defensive areas over the past week and month. What if the CPI report is hotter than expected? Does this rotation accelerate?
- Calendar. Usually, if we're going to see March weakness, it historically lasts until around the 23rd, which ironically marked the pandemic low in 2020.
- Options expiration. We've seen some crazy things happen around options expiration. If you saw our Max Pain report that was sent out earlier this morning, you know there is a TON of net in-the-money call premium with respect to the SPY and QQQ, and several key stocks like NVDA, META, AMD, and others. A brief significant selloff, followed by a recovery, cannot be ruled out. I just don't believe that's the most likely course. Market makers will definitely take advantage of any bad news and gap prices lower, however, so the February CPI report looming makes me a little nervous.
- Indecisiveness. If I sound indecisive, it's because I am. Short-term action is very difficult to predict. I fully believe 2024 will be a very good year and will end at or near its all-time high. But how we get there can send your emotions all over the place. I am remaining fully long, willing to accept any short-term downside that might take place.
Feedback
If you'd like to share your thoughts on our Weekly Market Report, positive or negative, you can reach us at "[email protected]".
Happy trading!
Tom