
EB Weekly Market Report - Monday, March 18, 2024
ChartLists Updated
Several ChartLists have been updated on our website since Friday:
- Strong Earnings (SECL)
- Strong Future Earnings (SFECL)
- Raised Guidance (RGCL)
- Bullish Trifecta (BTCL)
- Short Squeeze (SSCL)
Weekly Market Recap
Major Indices
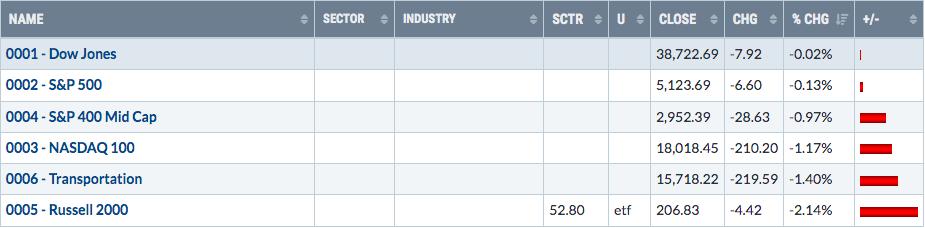
It was another options-expiration week last week and action definitely turned more bearish late in the second half of the week. Surprisingly, small caps (IWM) performed worst. That surprised me because most small caps either don't have options traded or they trade few options. Heading into the week, I was looking for max pain to hit the S&P 500 and NASDAQ the hardest, yet the former trailed only the Dow Jones and finished close to its flat line for the week.
Sectors
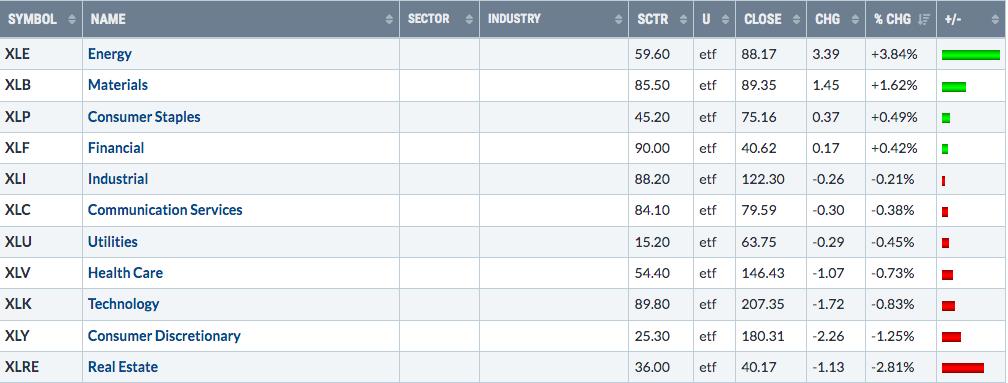
The strong week in both energy and materials helped carry the Dow Jones and S&P 500 to relative outperformance for the week. Listen, I've watched both the XLE and XLB storm higher in recent weeks and they most definitely qualify for bullish short-term trades as long as price action and momentum remain strong. It's the long-term that worries me most about these two sectors as they don't historically outperform when the U.S. Dollar ($USD) is rising. Here's what I'm referring to:
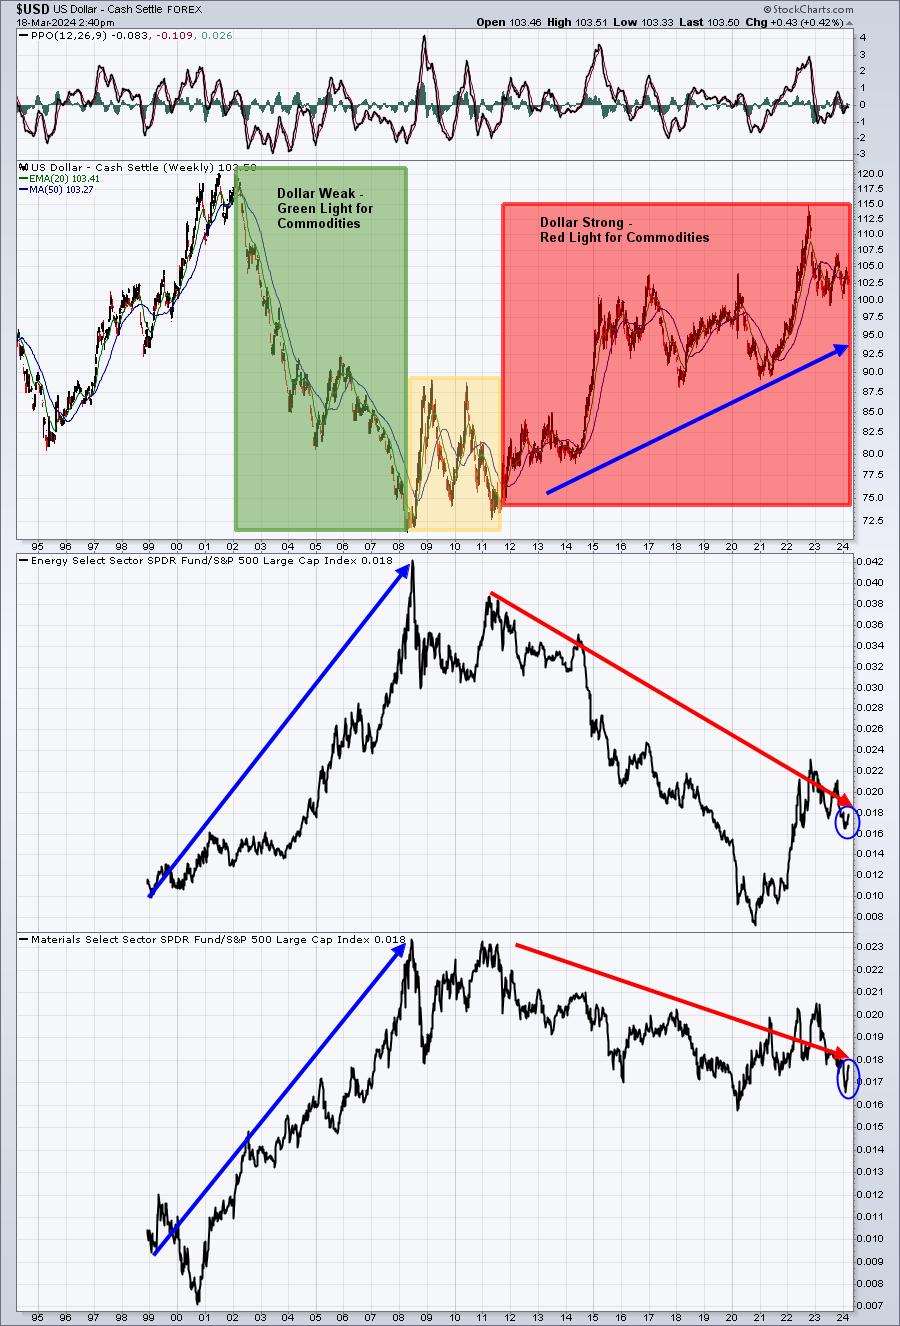
I've circled, at the far right, the current relative uptrend. It doesn't look quite as impressive on this long-term relative chart. It's very clear to me that the USD remains in a long-term uptrend and that at least makes me want to pause about growing too bullish on energy and materials. Please understand, this doesn't mean that energy and materials will collapse or even move lower. What it means to me is that I should continue to expect long-term underpeformance from these two groups. Therefore, if you're trading stocks or ETFs in these two sectors, just be careful and pay attention to your stops.
Top 10 Industries Last Week
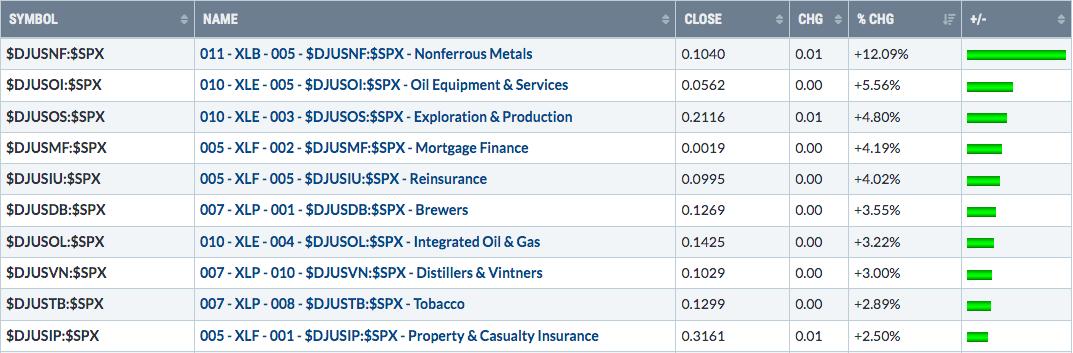
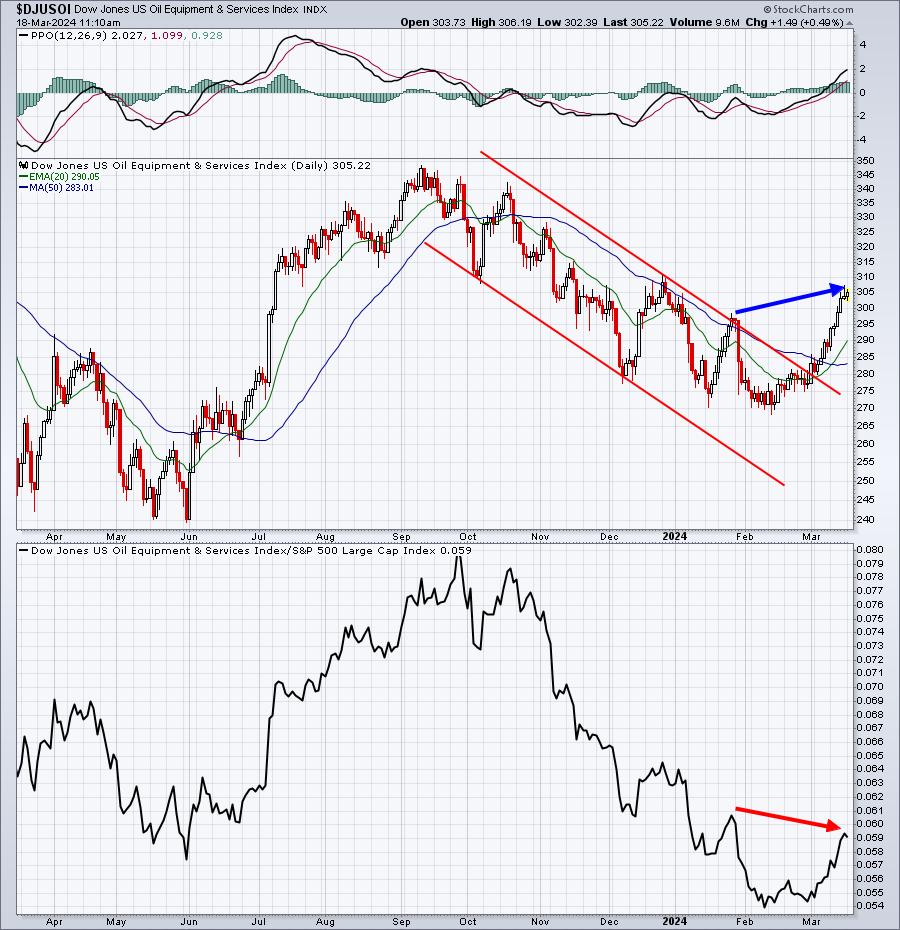
I discussed the short-term bullishness on the XLE earlier. Two of the top three industry groups last week came from the energy sector. The following two charts shows you what I mean by the short-term bullishness that these two groups are currently exhibiting:
Oil Equipment & Services ($DJUSOI):
Exploration & Production ($DJUSOS):
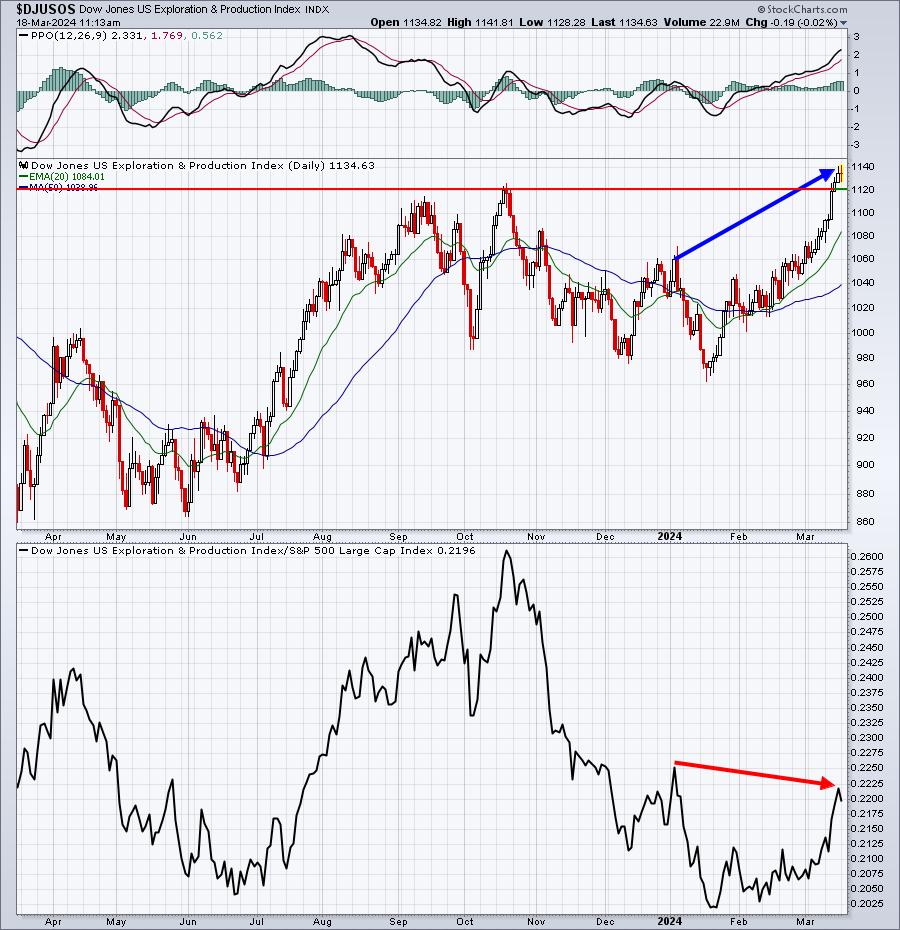
Yes, the short-term has been strong. But check out the relative strength. While absolute strength on both charts is impressive in the near-term, we're not seeing the same type of relative strength and, given the long-term rising USD, expecting too much out of this group could be a big mistake to those holding for the long-term.
Bottom 10 Industries Last Week
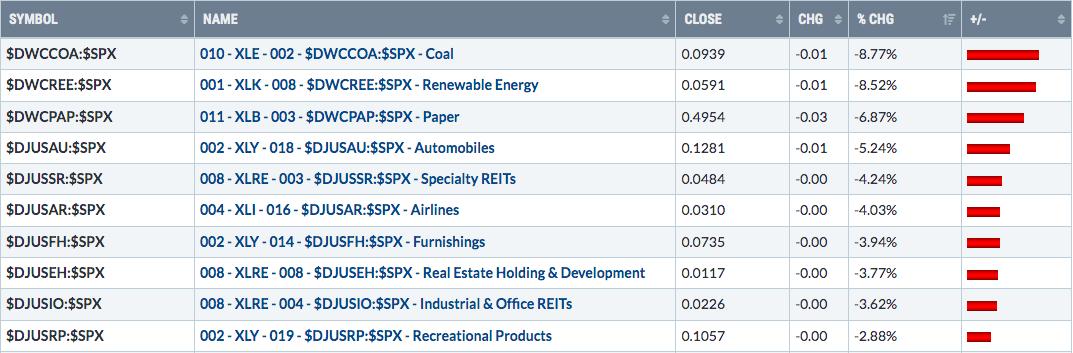
The last industry group on this list is perhaps the most interesting technically. Recreational products ($DJUSRP) rallied off its downtrend during the late summer correction and then consolidated in what might be construed as a bullish ascending triangle continuation pattern:
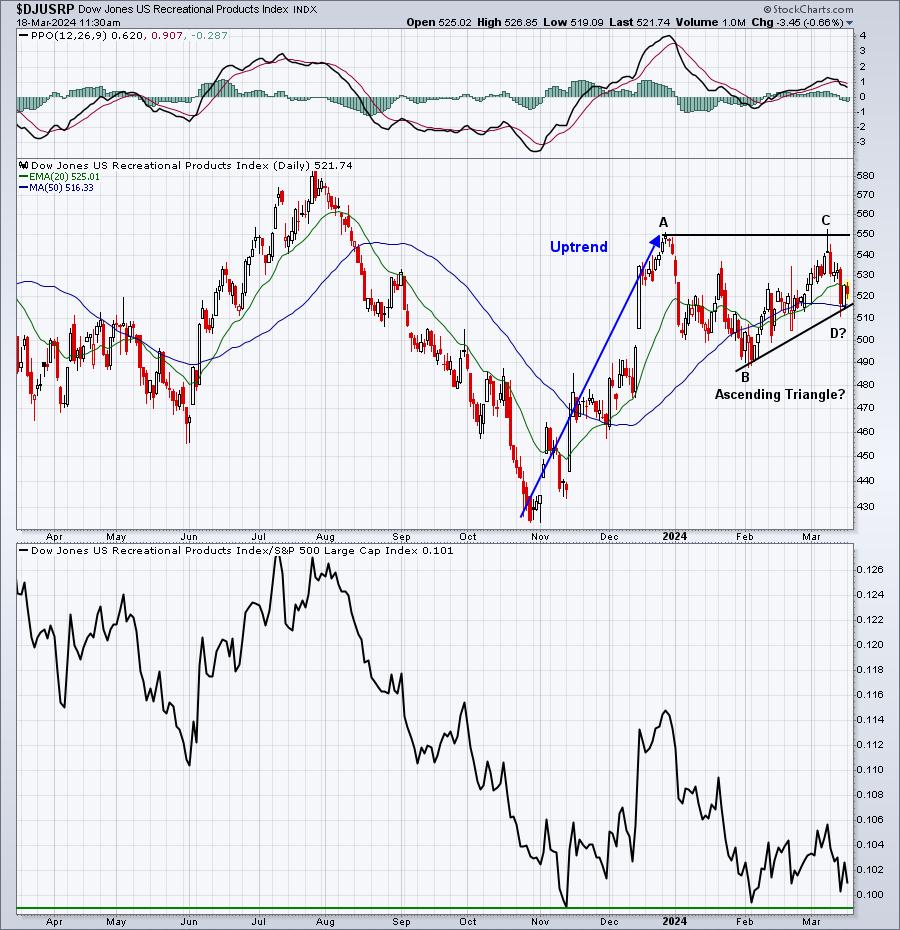
This pattern is not complete. The "D" of this "A-B-C-D-E" pattern isn't set in stone. The D isn't confirmed until we have an E, which is the breakout of the pattern. Also, look at the DJUSRP's relative performance vs. the benchmark S&P 500 in the bottom panel. The mostly sideways relative action the past several weeks is okay, because price action is also consolidating and moving sideways. I would NOT want to see B support lost, nor would I want to see relative support from November lost.
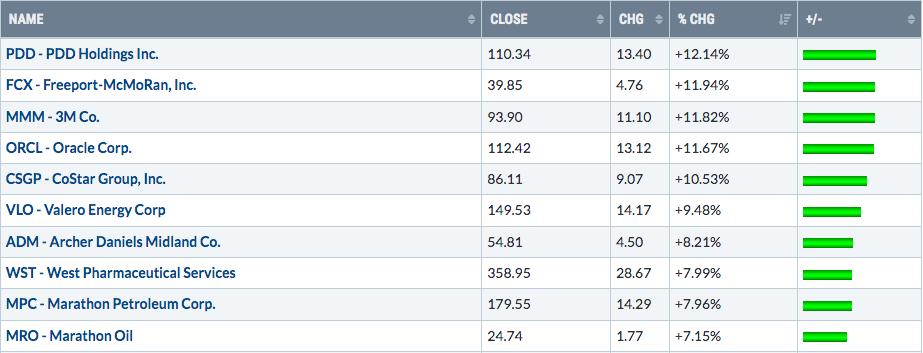
Top 10 Stocks - S&P 500/NASDAQ 100
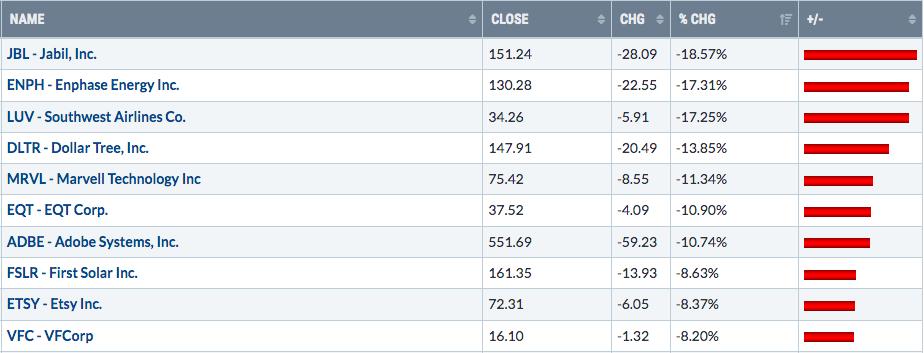
Bottom 10 Stocks - S&P 500/NASDAQ 100
Big Picture
There was more rotation last week, especially late in the week as technology (XLK) and other key aggressive sectors struggled a bit on a relative basis. The good news, however, is that other areas of the market saw buying, keeping the S&P 500 near its all-time high. This is resulting in more and more areas of the market seeing breakouts and turning more bullish.
As we always do, and as a reminder of the strength and power of secular bull market advances, here's the latest Big Picture of the S&P 500, appearing relentless to the upside.
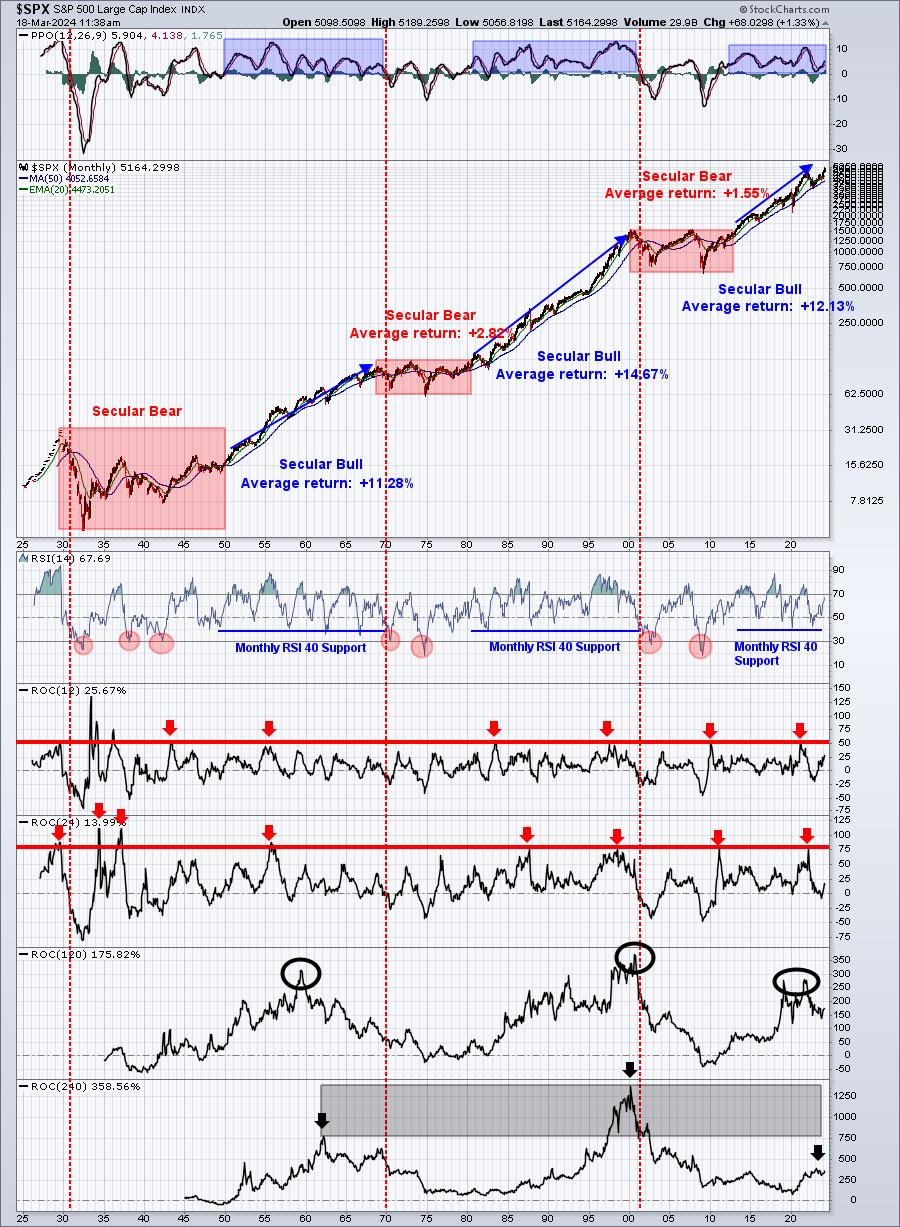
One critical component to the start of every SECULAR bear market is a drop in the monthly PPO beneath zero. After nearly testing the PPO centerline during the 2022 cyclical bear market, this PPO is now soaring higher and THIS is what occurs during secular bull markets.
Sentiment
I've had questions come in, asking me why the rotation in December 2021, which led to much selling in 2022, is different than the current rotation. Why wouldn't this rotation into value-oriented and defensive sectors suggest a market top like the end of 2021?
Great question.
It's like going in for an oil change or tire rotation with a car that's otherwise in nearly perfect condition vs. going in for the same regular maintenance when your car is 15 years old, leaking oil, smoke's coming out of the exhaust, an you're hearing weird things under the hood. Rotation in the stock market is like normal maintenance. But normal maintenance won't fix a car that has a HUGE number of existing problems.
At the end of 2021, there were a plethora of "engine problems" in the stock market. The stock market had just moved 115% higher in 22 months, the largest such move over a 22-month period since back during the Great Depression in the 1920s/1930s. Crazy overbought. We had negative divergence after negative divergence for months on the S&P 500 weekly chart, beating us over the head that long-term momentum was running out of gas. Inflation was rising. There was pressure on the Federal Reserve to begin raising interest rates SIGNIFICANTLY to contain inflation. But as I pointed out at MarketVision 2022, NONE of those issues were the most important. The really big deal was that sentiment had turned the most bullish it had EVER been! The 253-day SMA of the equity only put call ratio ($CPCE) reached AND STAYED AT levels never seen before. The pandemic had created a whole new set of traders and they only knew one thing from March 2020 to December 2021 - a rapidly rising market. They could buy ANYTHING and it would go up. My stepson was 16 at the time and I remember him telling me he was going to be a full-time trader and his portfolio size was $300. I told him that 10% return on his money for a year is solid. So he'd need to live off $30 a year. He said he could double his balance every week. He no longer trades stocks.
THAT type of sentiment and mentality is what causes tops.
Long-term sentiment doesn't turn on a dime. It's why I call my 253-day SMA of the CPCE my "ocean liner" indicator and my 5-day SMA of the CPCE my "speed boat" indicator. The 5-day SMA is great for short-term reversals in the stock market, aiding short-term traders. The 253-day SMA takes a long, LONG time to top or bottom and knowing the current direction gives us a HUGE advantage in calling market direction.
So, to me, the absolute biggest reason the overall market is not going lower is that my ocean-liner sentiment indicator reached an extreme top and it will take the next year or two to "reset" this in more bullish sentiment fashion, which could mark the next stock market top. I'm not worried about that in 2024. Check out this chart and realize what history tells us about market direction when this 253-day SMA of the CPCE is declining:
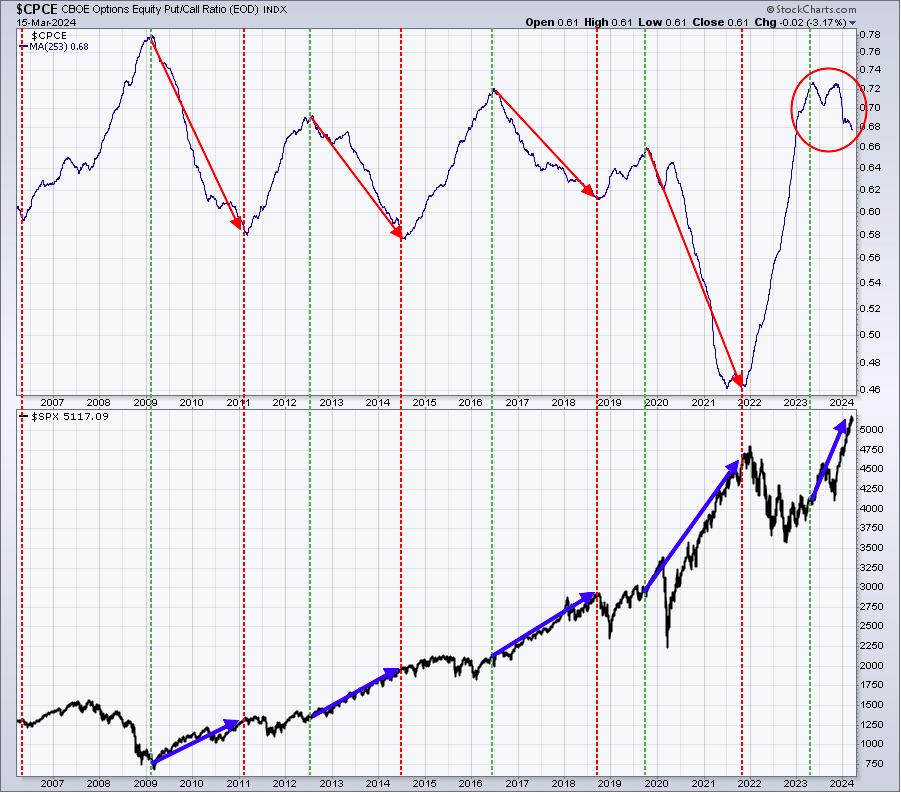
The only time that we saw sentiment grow more bearish (which is bullish for stocks, because sentiment is a contrarian indicator) than it was during and after the 2022 cyclical bear market was during the financial crisis in 2008/2009. It's a signal that whoever wants to sell has sold. Once that panic hits, there are no more big sellers and the market is then free to rally higher, which is exactly what we've been seeing for the past 15-18 months.
For what it's worth, I've NEVER seen anyone else use a long-term sentiment analysis like this, so it's our little secret. But the charts do not lie and the direction of long-term sentiment providing a solid signal on future market performance just makes good common sense. And its track record is undeniable.
Rotation/Intermarket Analysis
Here's the latest look at our key intraday ratios as we follow where the money is traveling:
QQQ:SPY
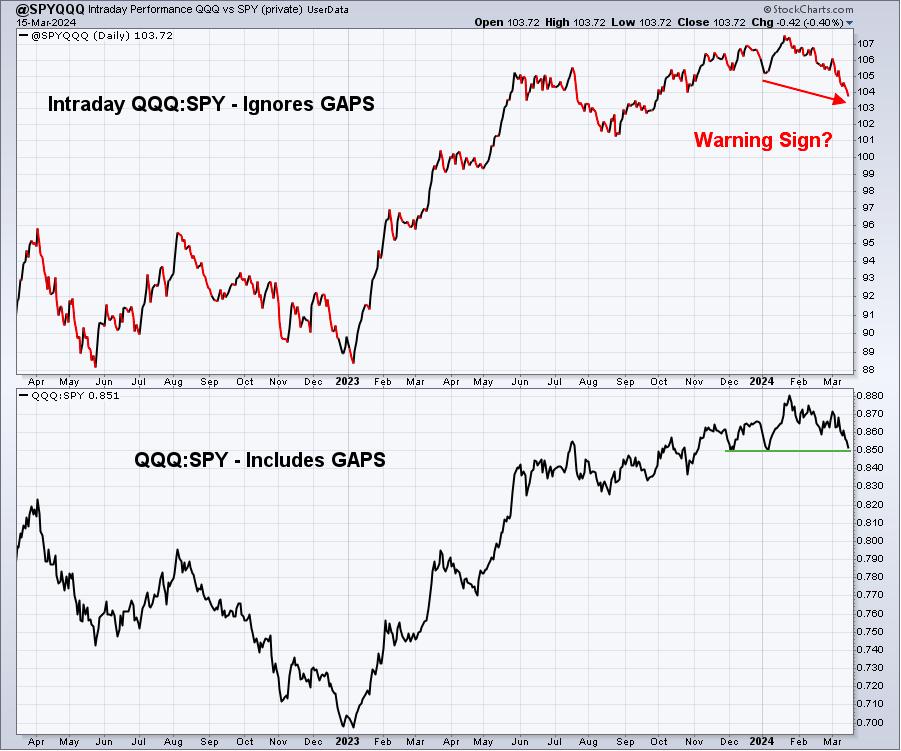
Should we be concerned about this intraday relative weakness? Absolutely. But it's nothing more than a short-term indicator as money rotates. The problem is that perma-bears will look for ANY bearish signal and use that one signal as the reason for a major selloff ahead. It doesn't work that way. This signal tells me the odds of further consolidation, possibly even short-term selling of 3-5%, is increasing in likelihood, though not a guarantee. Given all of my bullish long-term signals, especially sentiment, a trip on the S&P 500 down to 4800-4900 is my worst-case scenario, not my most likely downside target. But VERY important to understand is that secular bull markets wait for no one. I would not remain cautious for long, especially if we see money begin to rotate more bullishly and aggressively to support the next big rally.
IWM:QQQ
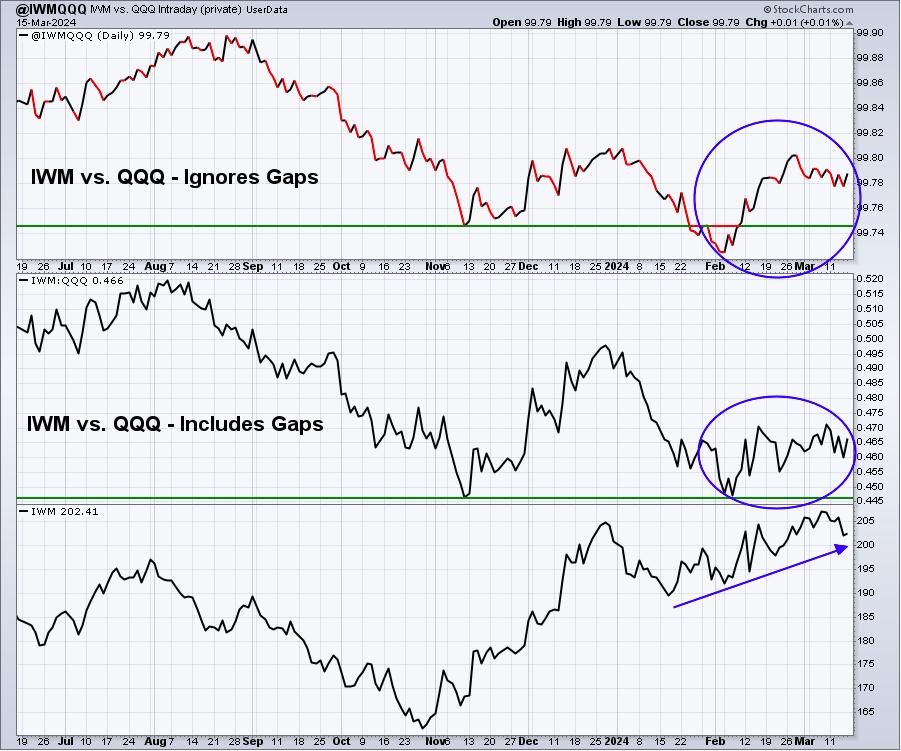
As I look at the IWM:QQQ relationship, I simply see indecision here in March. I believe the uptrend from early February remains intact, but we'll keep watching this from week to week.
XLY:XLP
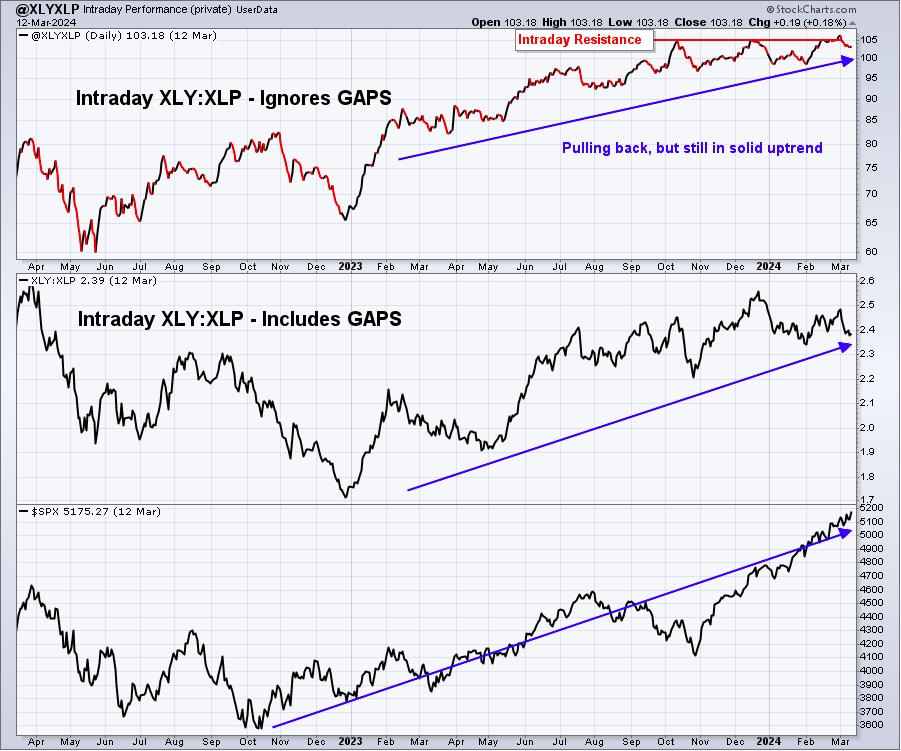
If you don't try to nitpick every turn lower in the XLY:XLP ratio and simply stand back and look at the overall direction of these ratios, it's really hard to think bearish thoughts. Do you not see all 3 charts above rising from left to right? The biggest short-term issue in the top two panels is that the XLY is being heavily affected by Tesla's (TSLA) awful performance in 2024. That could change this week, however, as TSLA is up 5.7% today (at last check). It's got a lot of work to do in order to reverse the current downtrend, but it has to start somewhere. If today's the day and TSLA moves up from here, this XLY:XLP ratio will likely look much more bullish in the weeks ahead. Keep an open mind.
The Dollar
I discussed the dollar earlier and I also discussed it in last week's EB Weekly Market Report, but I am going to post it again. Materials (XLB) have been the best-performing sector over the past month and if that's to continue long-term, it'll likely need a weakening dollar to provide a tailwind for the sector. Same goes for energy (XLE).
The best signal that I've found to help with direction in the U.S. Dollar ($USD) is comparing the 10-year treasury yield picture in the U.S. ($UST10Y) vs. Germany ($DET10Y). When the "difference" (not ratio) between these two yields ($UST10Y-$DET10Y) is rising, it generally results in a rising U.S. Dollar. The opposite is true when this difference is declining.
Here's where this 10-year treasury yields relationship currently stands:
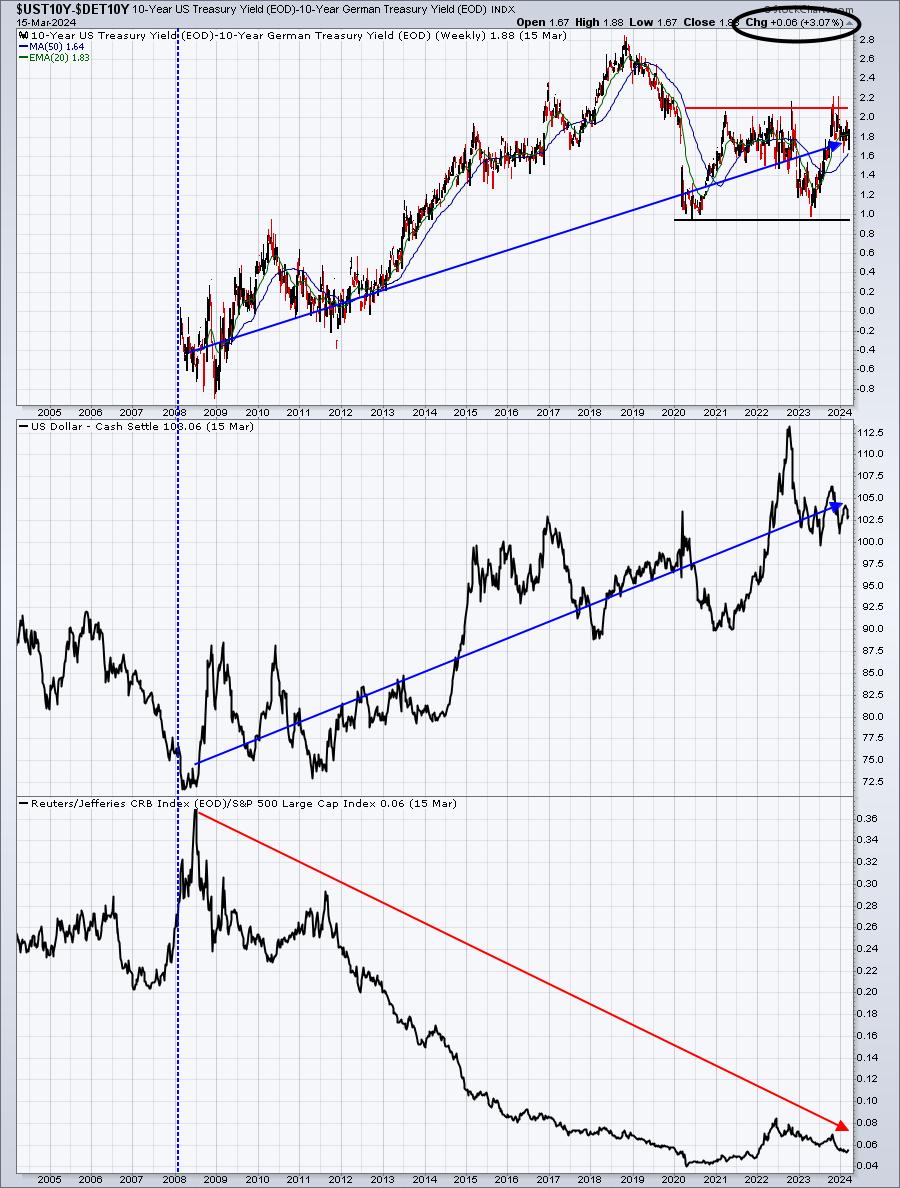
The difference in yields rose from 1.82 to 1.88 and it's highlighted above with a black circle. However, the dollar dipped, which aided short-term strength in energy and materials. If we see the difference, however, break back above the key 2.00-2.20 level, I'd find it very difficult to stick with the XLE and/or XLB.
Trade Setup
Since beginning this Weekly Market Report in early September, I've discussed the long-term trade candidates below that I really like. Generally, these stocks have excellent long-term track records and many pay nice dividends that mostly grow every year. Only in very specific cases (exceptions) would I consider a long-term entry into a stock that has a poor or limited long-term track record. Check these out:
- JPM
- BA
- FFIV
- MA
- GS - breaking above previous trendline resistance near 350-355 was bullish
- FDX
- AAPL
- CHRW
- JBHT
- STX
- HSY
- DIS
- MSCI
- SBUX
- KRE
- ED
Keep in mind that our Weekly Market Reports favor those more interested in the long-term market picture. Therefore, the list of stocks above are stocks that we believe are safer to own with the long-term in mind. Nearly everything else we do at EarningsBeats.com favors short-term momentum trading, so I wanted to provide an explanation of what we're doing with this list. As we approach the end of March, my hope is that short-term weakness, if we see it, will enable us to add another long-term stock next week.
Looking Ahead
Upcoming Earnings:
Earnings season is winding down, but we still have companies reporting from time to time that could have an impact on our major indices. I've identified what I believe are key companies that will report this week, with their respective market caps in parenthesis. This is NOT a list of ALL companies reporting this week, so please be sure to check for earnings of any companies that you own or add. Any companies in BOLD represent stocks in one of our Portfolios:
- Monday: None
- Tuesday: None
- Wednesday: PDD ($163 billion), MU ($101 billion)
- Thursday: ACN ($237 billion), NKE ($153 billion), FDX ($64 billion), LULU ($59 billion)
- Friday: None
Key Economic Reports:
- Monday: March housing market index
- Tuesday: FOMC meeting begins, February housing starts & permits
- Wednesday: FOMC announcement
- Thursday: Initial jobless claims, March Philadelphia Fed manufacturing index, March PMI composite flash, February existing home sales, February leading indicators
- Friday: None (other than a bunch of FedSpeak throughout the day)
Historical Data
I'm a true stock market historian. I am absolutely PASSIONATE about studying stock market history to provide us more clues about likely stock market direction and potential sectors/industries/stocks to trade. While I don't use history as a primary indicator, I'm always very aware of it as a secondary indicator. I love it when history lines up with my technical signals, providing me much more confidence to make particular trades.
Below you'll find the next two weeks of historical data and tendencies across the 3 key indices that I follow most closely:
S&P 500 (since 1950)
- March 18: +39.17%
- March 19: -33.38%
- March 20: -13.99%
- March 21: -14.69%
- March 22: -25.39%
- March 23: +32.57%
- March 24: +16.48%
- March 25: +17.59%
- March 26: +85.36%
- March 27: -43.22%
- March 28: -4.68%
- March 29: +51.39%
- March 30: -39.66%
- March 31: -7.16%
NASDAQ (since 1971)
- March 18: +42.85%
- March 19: -19.90%
- March 20: -76.24%
- March 21: +12.37%
- March 22: -7.85%
- March 23: +38.54%
- March 24: +7.04%
- March 25: +15.85%
- March 26: +129.71%
- March 27: -110.82%
- March 28: -61.77%
- March 29: +53.31%
- March 30: -12.85%
- March 31: +39.81%
Russell 2000 (since 1987)
- March 18: +23.53%
- March 19: +23.45%
- March 20: -97.83%
- March 21: +19.15%
- March 22: -94.32%
- March 23: +13.92%
- March 24: +29.36%
- March 25: +109.10%
- March 26: +197.25%
- March 27: -99.59%
- March 28: -76.94%
- March 29: +64.48%
- March 30: +26.93%
- March 31: +78.83%
The S&P 500 data dates back to 1950, while the NASDAQ and Russell 2000 information date back to 1971 and 1987, respectively.
Historically, March provides swings in both directions, resulting overall in docile month. The March 23rd to April 10th period, however, does lean towards the bulls. Here are the annualized returns for each major index over this period:
- S&P 500 (since 1950): +22.20%
- NASDAQ (since 1971): +16.06%
- Russell 2000 (since 1987): +26.00%
Final Thoughts
Well, monthly options-expiration week has come and gone. We're in the midst of a historically-challenging period with little weakness to show for it thus far. Rotation has been a bullish factor as many struggling areas, particularly value-oriented areas, have seen much more absolute strength and even some relative strength to offset a bit of weakness in technology (XLK) names. This type of bullish rotation and greater participation in the bull market is a very positive signal, in my opinion. The short-term problem, however, is that if the sectors that are heavily represented in the S&P 500 underperform, it'll be a big struggle for the S&P 500 to break 5200 and trade measurably higher.
Here are several things to consider in the week ahead:
- Inflation and The Fed. Last week, both February CPI and February PPI came in hotter than expected. The Fed has obviously been very concerned about the lingering effects of inflation and its stubbornness. I still see the annual rate of inflation dropping, even if the short-term action has produced a few stumbling blocks for the bulls. The Fed has a TON of power, however, so which way will Fed Chief Powell lean for this week's Fed meeting? I do NOT trust Fed Chief Powell as I believe he speaks out of both sides of his mouth and is inconsistent in his messaging to the bond and stock markets.
- Interest rates. There was a lot of buying of treasuries heading into the inflation reports last week, sending yields considerably lower and beneath key moving averages, suggesting a renewed downtrend was underway. Everything changed, though, with the CPI and PPI reports last week. Now the 10-year treasury yield ($TNX) is moving higher and threatening a very important short-term CLOSING yield resistance level of 4.34%. As of 1pm ET today, the TNX is at 4.33%, up another 3 basis points. If the Fed talks about the possibility of fewer rate cuts this year OR keeping rates unchanged longer, the TNX could break out and I'd "expect" U.S. stocks to sell off. If the Fed sticks with their plan of cutting rates, the brief selling in areas like technology could be over. It's up to the Fed now, and that scares me a bit.
- Rotation. I view the rotation as bullish, but it's not bullish for areas that have led much of the secular bull market advance. After the Fed's policy announcement at 2pm on Wednesday, where most everyone expects them to leave the fed funds rate unchanged, I'll be watching all of my key intermarket ratios throughout the balance of the week to try to determine what the big Wall Street firms believe moving forward. Follow the clues of the money, not the cluelessness of the CNBC crew.
- Calendar. March weakness and uncertainty remains in play. Keep in mind that any key price lows in March tend to mark bottoms in Presidential Election year cycles. Historical returns do improve as we move past this week.
- Options expiration. Max pain suggested a directional move lower based on our analysis at our Max Pain event on Tuesday after the market closed. It wasn't much, but that's the direction we headed. It's not at all unusual to see option-expiration week selling carry over into the following week, because many options holders exercise their call options, buying the underlying stock, to avoid paying taxes. That buying of stock leaves market makers as short sellers in the near-term. Accordingly, market makers remain interested in seeing lower prices for a brief period.
Feedback
If you'd like to share your thoughts on our Weekly Market Report, positive or negative, you can reach us at "[email protected]".
Happy trading!
Tom