
EB Weekly Market Report - Monday, March 25, 2024
Weekly Market Recap Video
Our latest Weekly Market Recap video is available on YouTube. You can CLICK HERE to watch my latest. This video is NOT the same as this EB Weekly Market Report. Some content is similar, but this report is much more about the LONG-TERM. The Weekly Market Recap video has more of a trader's feel to it, in my opinion. Having both of them together, however, will likely fill gaps in what you might be looking for.
Be sure to check it out and leave us comments under the video to let us know what you think. If you want to send something to us more anonymously, feel free to write us at "[email protected]". Thanks for any and all feedback!
ChartLists Updated
Several ChartLists have been updated on our website since Friday:
- Strong Earnings (SECL)
- Strong Future Earnings (SFECL)
- Raised Guidance (RGCL)
- Bullish Trifecta (BTCL)
Weekly Market Recap
Major Indices
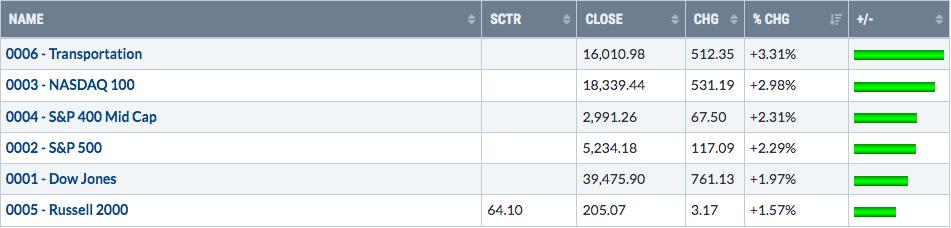
First, it's nice to see green across all of our key indices. Transportation ($TRAN) has been a real laggard for quite awhile, but it ripped higher after challenging support at 15400 and printing a reversing piercing candle:
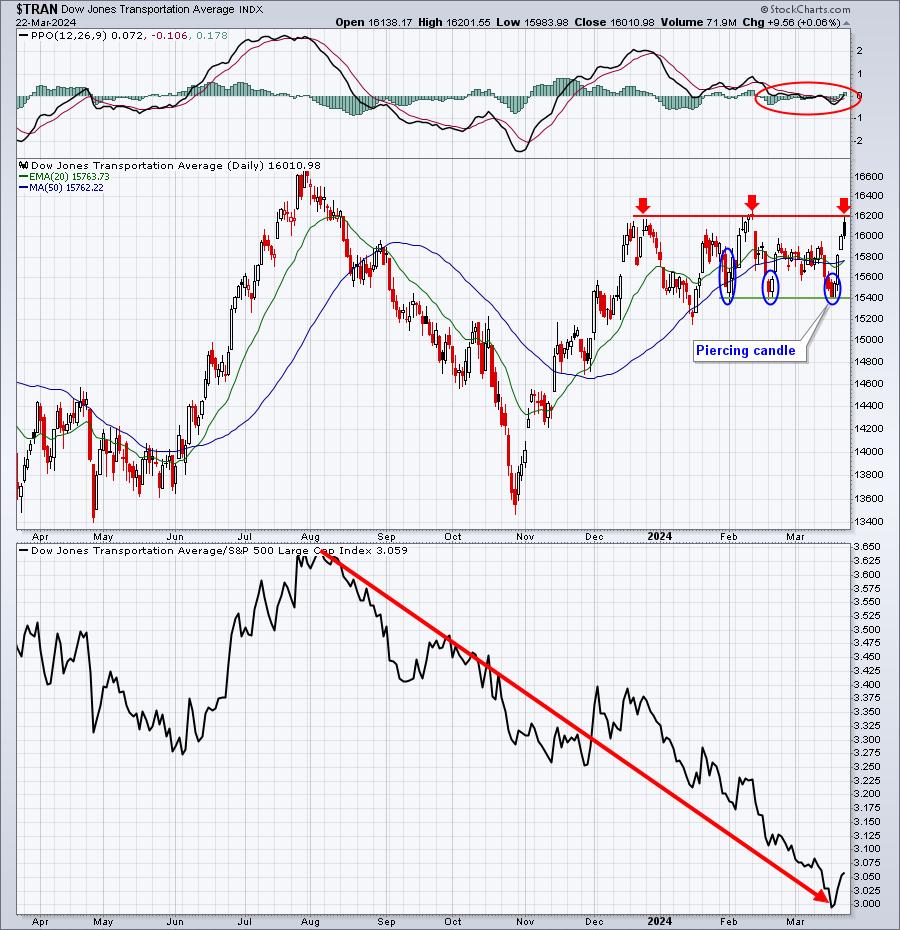
After the nice reversal, transports now quickly find themselves up against key price resistance at 16200. Let's see what happens this week, but a breakout would be another bullish development in this secular bull market advance.
It's also worth noting that the S&P 500 broke above the 5200 level for the first time ever on Wednesday, after the Fed announcement seemed to almost ignore the higher-than-expected February CPI and PPI reports.
Sectors
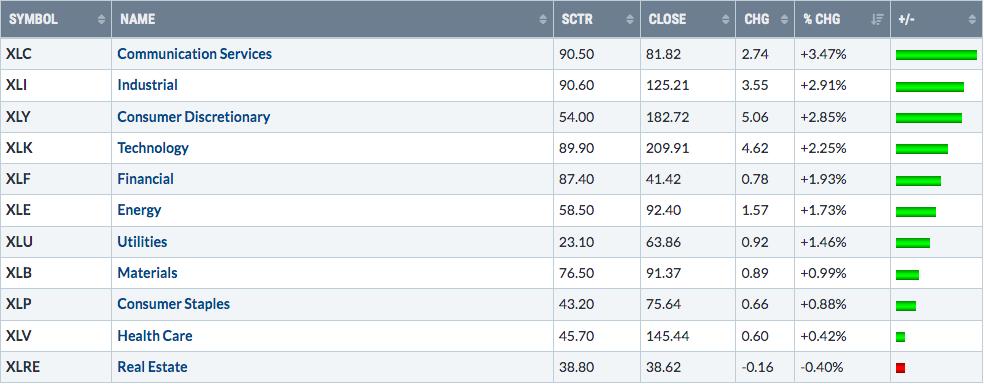
10 of 11 sectors advanced last week, so we saw wide participation in last week's advance. But let's zero in on the leadership. All 5 aggressive sectors occupied the top 5 spots. There isn't any interpretation necessary here. It was a "risk on" market environment that accompanied market strength, and I'm expecting to see more of this strength as we look ahead. Since late-October 2023, the S&P 500 has risen 17 out of 21 weeks. There's been barely a pause. Listen, this is happening for a reason. It's not random. Big Wall Street firms continue to buy, so we should have a similar mindset.
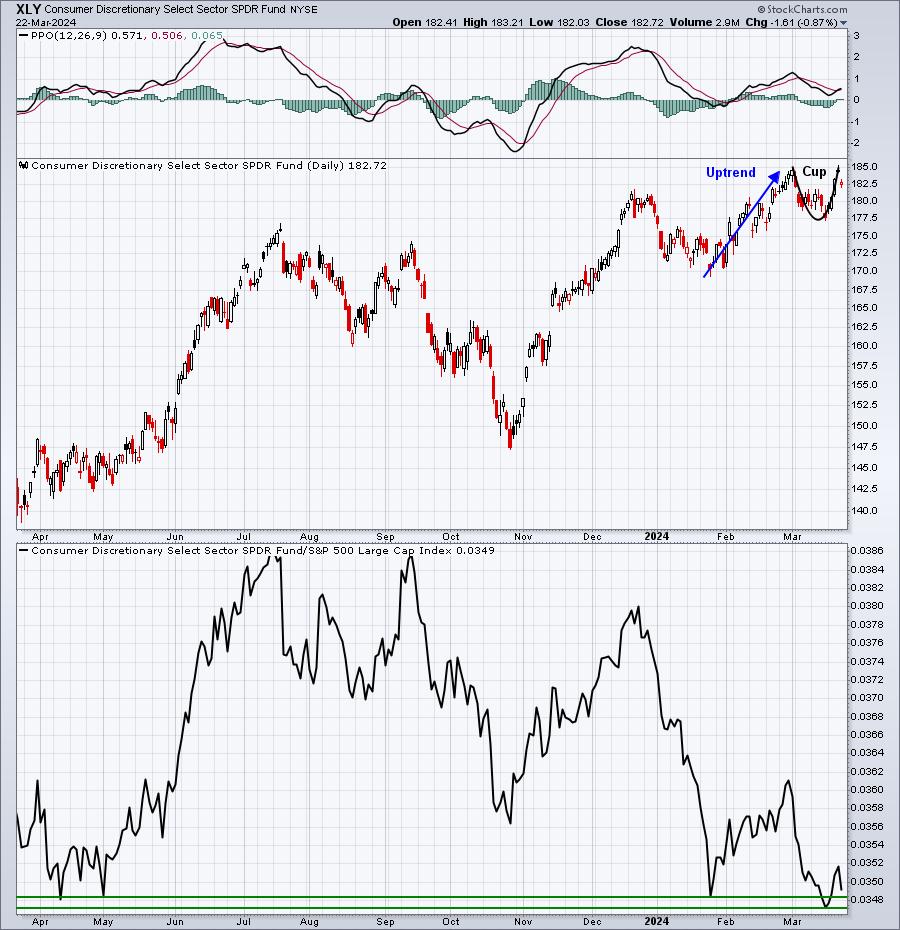
The XLY has underperformed in 2024 and is currently near a 1-year relative low, but its absolute price action is bullish, as you can see on its chart below:
Top 10 Industries Last Week
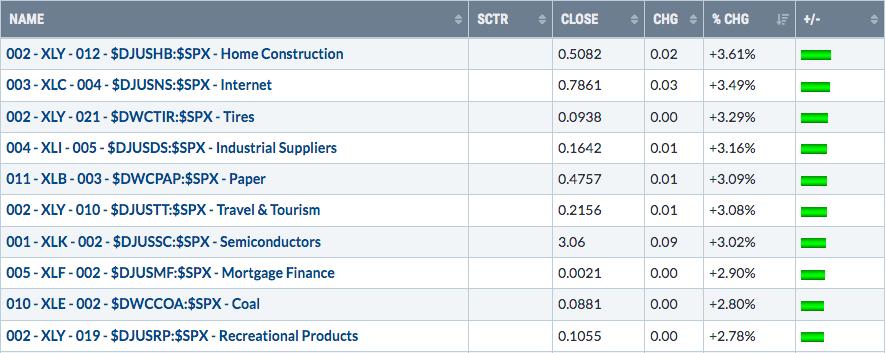
Remember last week? I discussed the recreational products group ($DJUSRP), which had potentially printed a "D" in an "A-B-C-D-E" ascending triangle pattern. It bounced beautifully and ended up essentially at, or just slightly above, the critical breakout level of the triangle. Check this out:
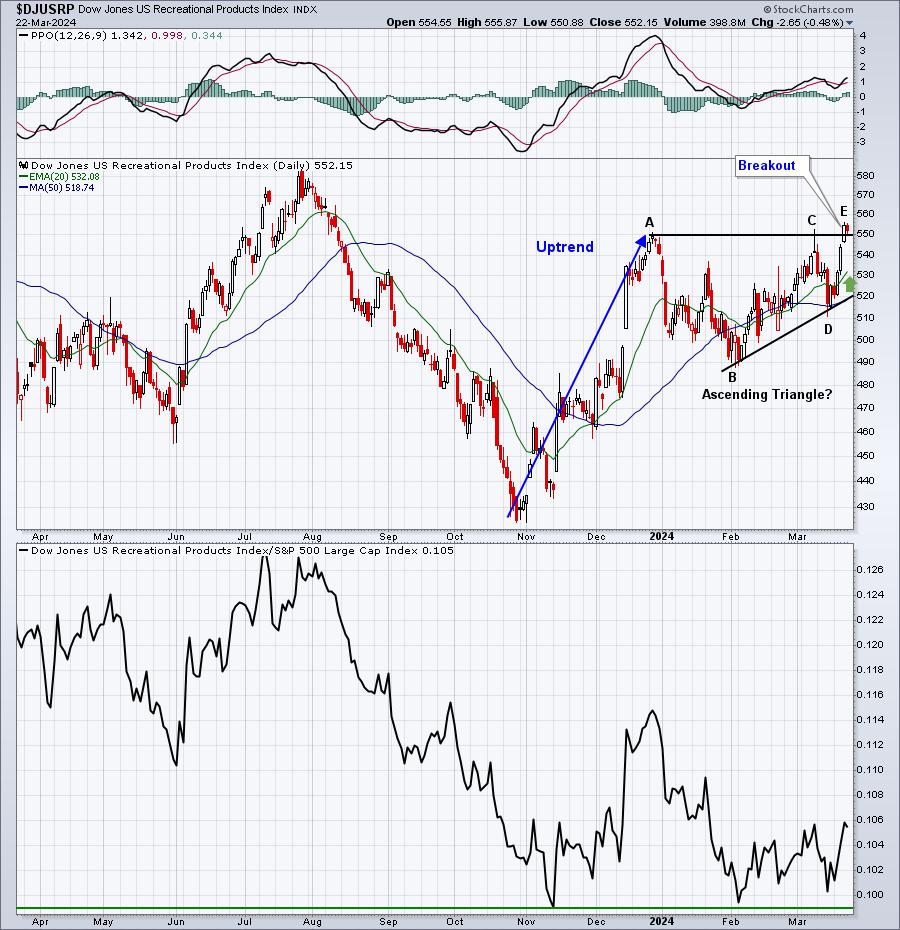
For this pattern to hold, I would NOT want to see a pullback that extends below 532.08, the current 20-day EMA.
Bottom 10 Industries Last Week
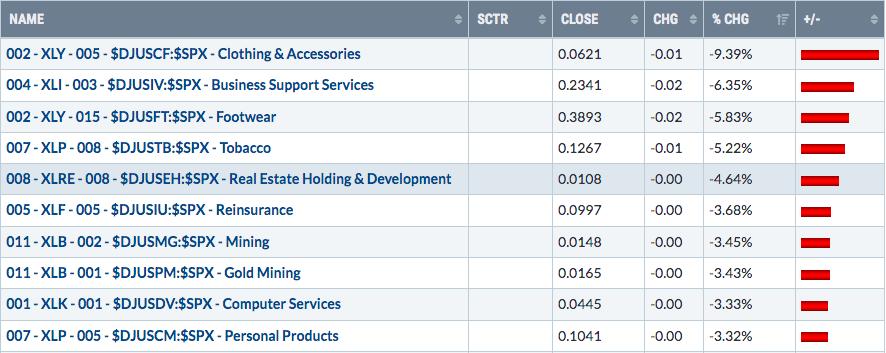
Business support services ($DJUSIV) will be an industry group to learn from this week. It had a rough week, obviously, and seemed to break down on its daily chart:
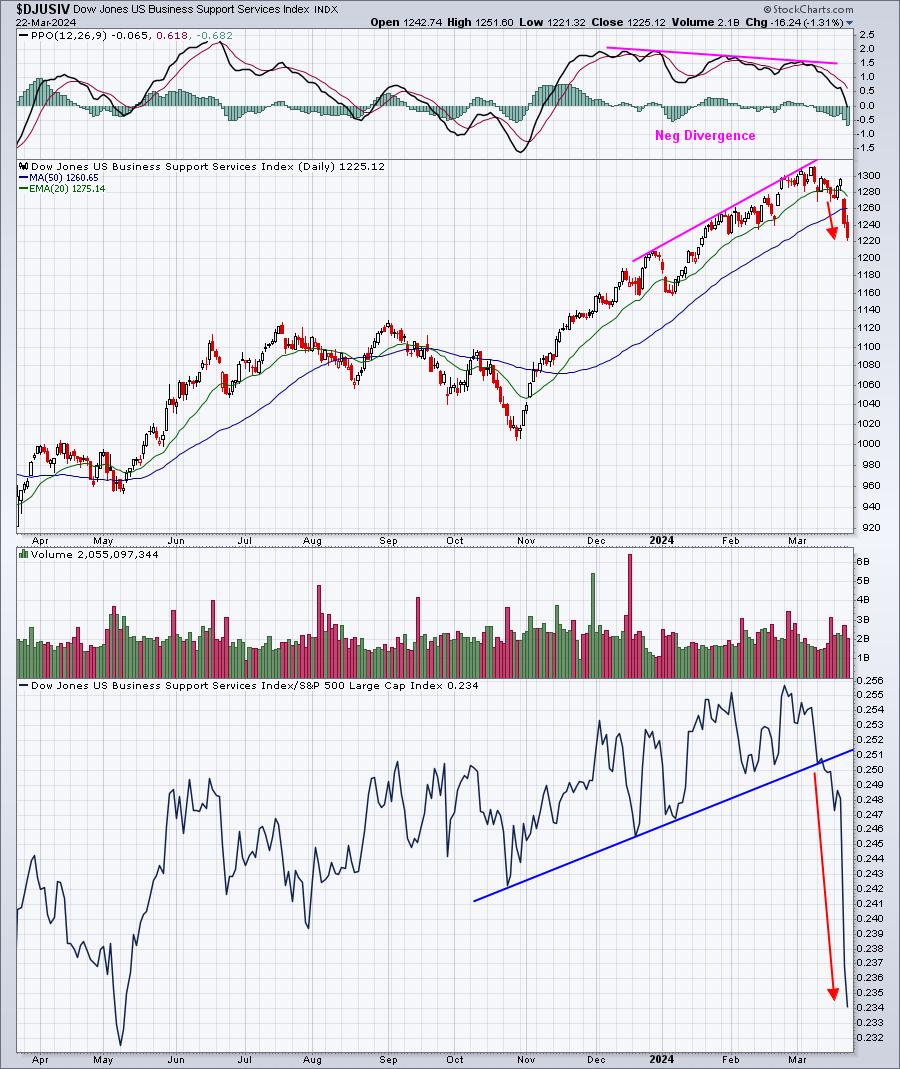
There was a negative divergence, followed by a swift breakdown beneath the rising 50-day SMA. Relative strength completely fell apart. So is there any hope?
Well, the weekly chart certainly would appear to be a bit more bullish:
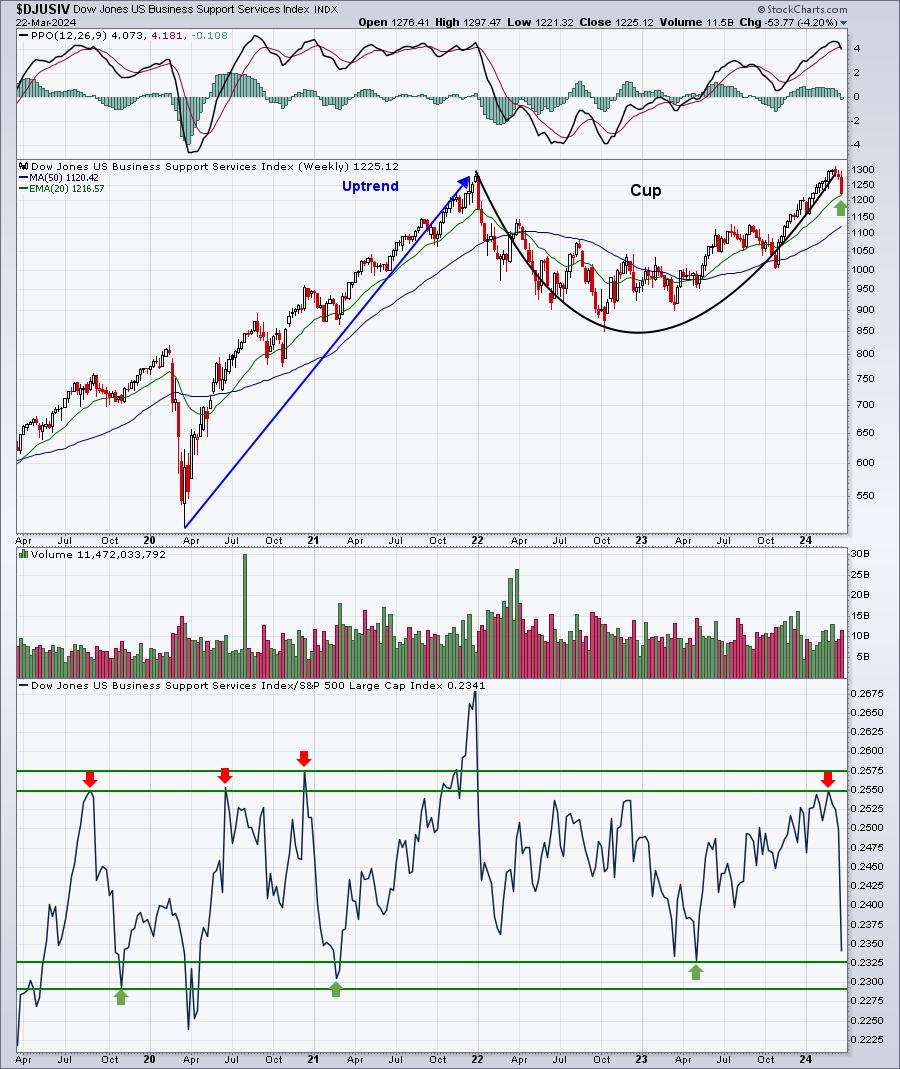
From a longer-term perspective, we've seen these types of drops before on the DJUSIV. It's now approaching an area of relative price support, where the DJUSIV has turned back higher in the past. Also, last week's absolute price weakness is nothing more than a handle forming back to the rising 20-week EMA - at least for now, that's all it is.
But this is a perfect illustration of how your perspective of a chart can change simply based on the time frame you use and review. When two different time frames produce two different conclusions, I generally stick with the longer-term chart as the one I follow most closely. Let's see how next week unfolds for this group.
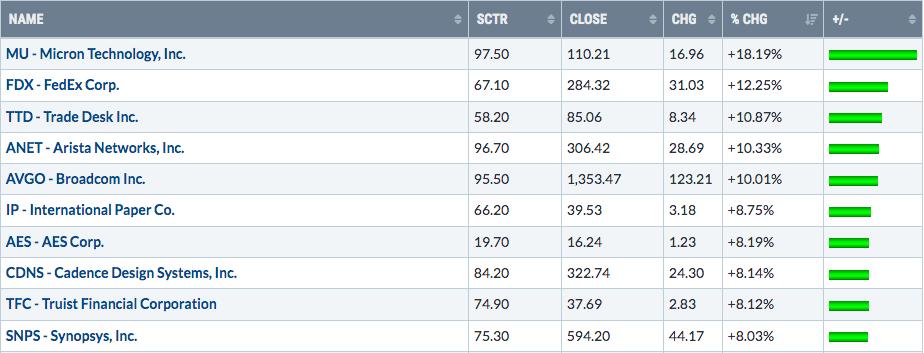
Top 10 Stocks - S&P 500/NASDAQ 100
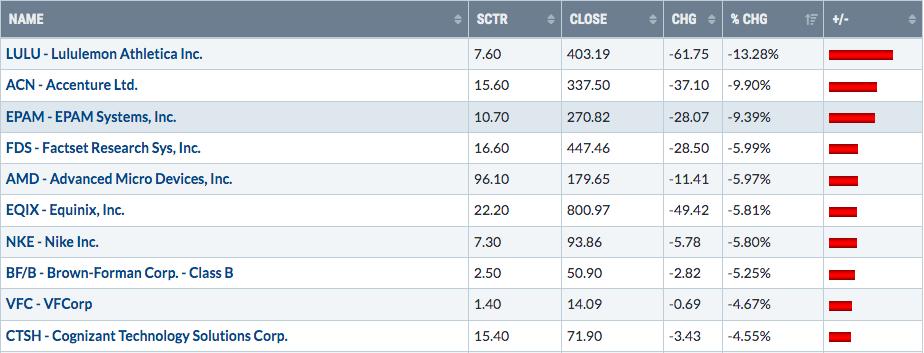
Bottom 10 Stocks - S&P 500/NASDAQ 100
Big Picture
The Fed meeting last week really has little to do with what happens over the next several years. It's nothing more than a blip on the radar. However, inflation can be a potential problem for long-term investors. The Fed essentially said last Wednesday that inflation is NOT a long-term problem. Fed Chief Powell really didn't seem to care about last week's higher-than-expected inflation numbers. Nothing much changed in the Fed's language from the prior month and they're still anticipating 3 rate cuts before year end. The 10-year treasury yield ($TNX) had challenged key overhead yield resistance at 4.35% on Monday, but then we saw a steady decline over the last four days of last week, closing the week at 4.22%.
As inflation becomes less and less of an issue for investors, let's check out the latest Big Picture of the S&P 500:
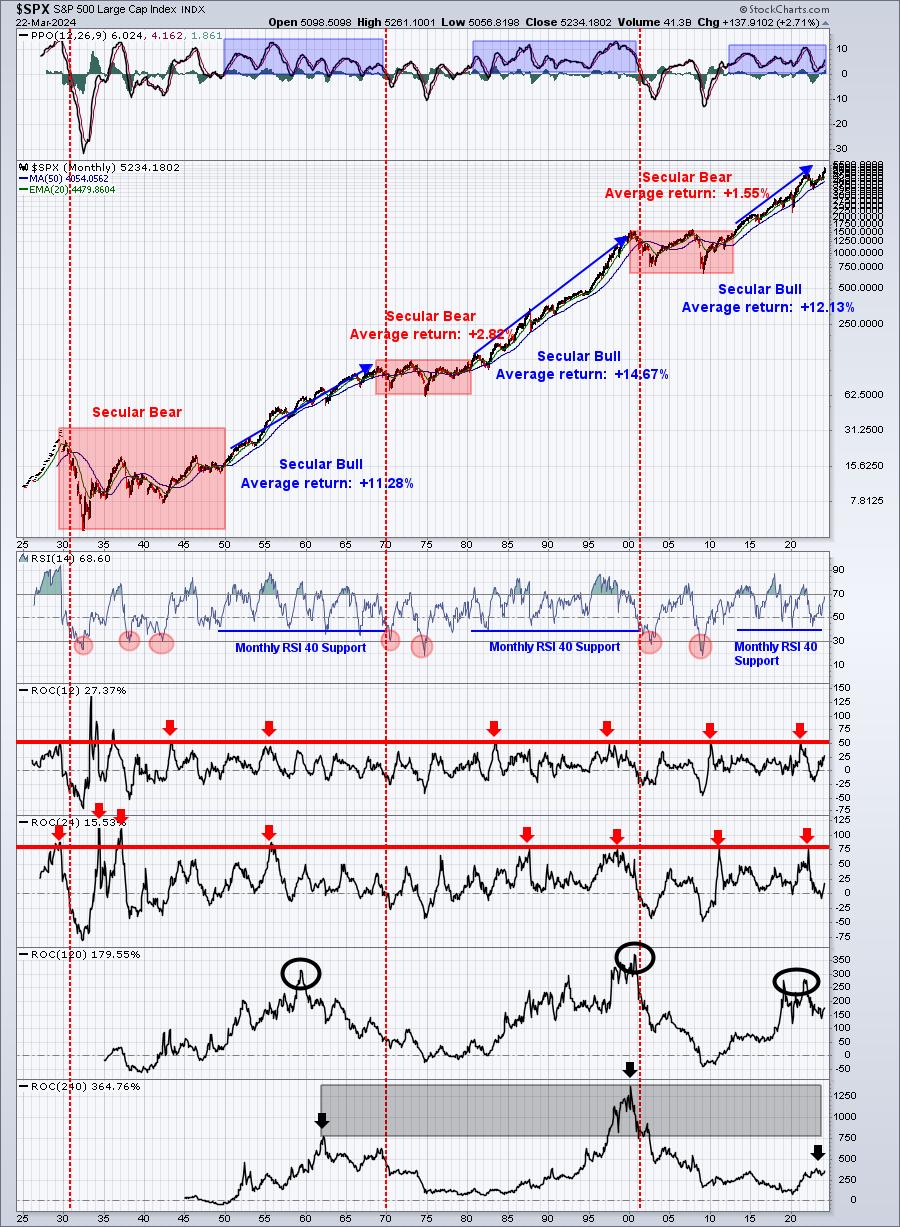
Long-term momentum (PPO) is strengthening as the S&P 500 is relentless in its move to the upside. While I do expect more uncertainty to build over the summer months as the election draws nearer, there's no doubt that the bulls remain completely in charge right now. A major milestone is approaching, but not on the S&P 500. Instead, the Dow Jones is within a whisker of closing above the psychological number of 40000 for the first time in its history. The Dow Jones dropped 0.77% on Friday, but its high on Thursday reached 39889.05, barely more than 100 points from finally reaching 40000.
Sentiment
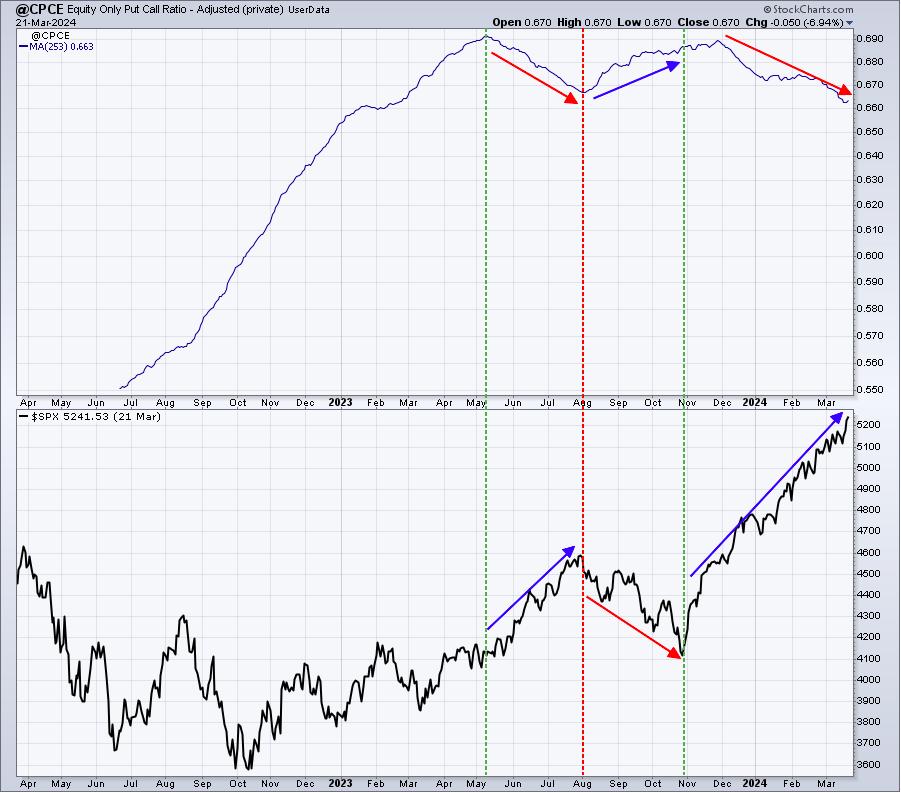
Like the Big Picture chart above, I believe it's a very good idea to be reminded about long-term sentiment periodically. Every week might be a bit often, but it's extremely important in the sense that there's still WAAAAY too much bearishness in the options world to believe this secular bull market is over or anywhere near approaching a major market top. I'll stick with the long side - of course, it's just my opinion based on my years of research and experience. Everyone must make their own call and make their own personal financial decisions.
Here's another reminder of this bullish 253-day moving average of the equity only put call ratio ($CPCE):
If we look at the shorter-term and the 5-day SMA of the CPCE, there's really nothing to discuss:
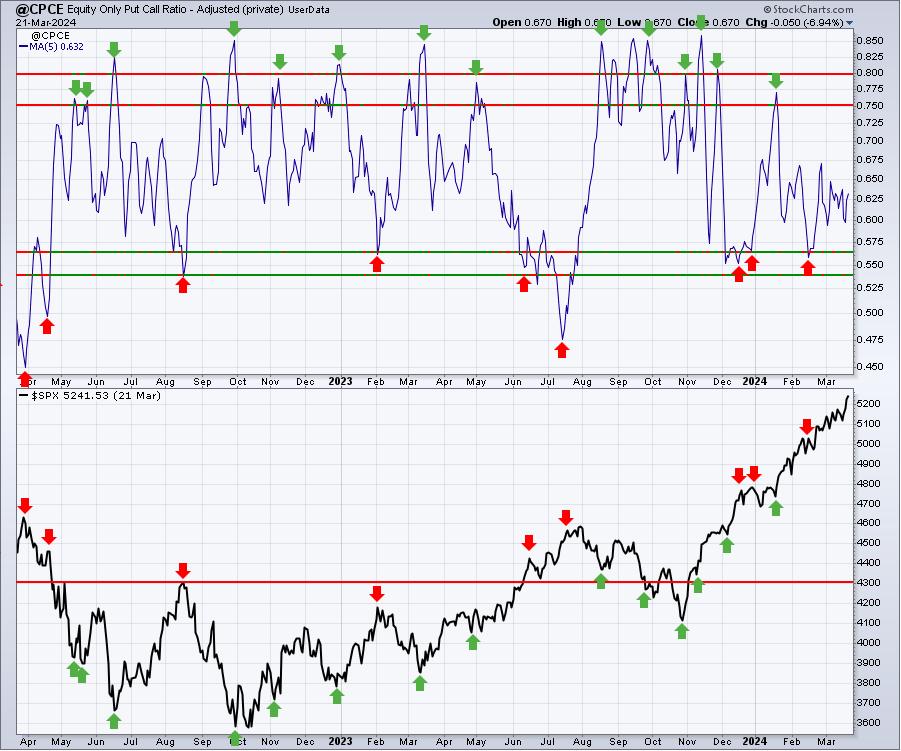
This 5-day SMA remains neutral and doesn't really provide us any clue about near-term market direction. Anything between .57 and .75 is what I'd consider neutral, so the .63 reading on Friday is right in the middle of neutral.
Rotation/Intermarket Analysis
Here's the latest look at our key intraday ratios as we follow where the money is traveling:
QQQ:SPY
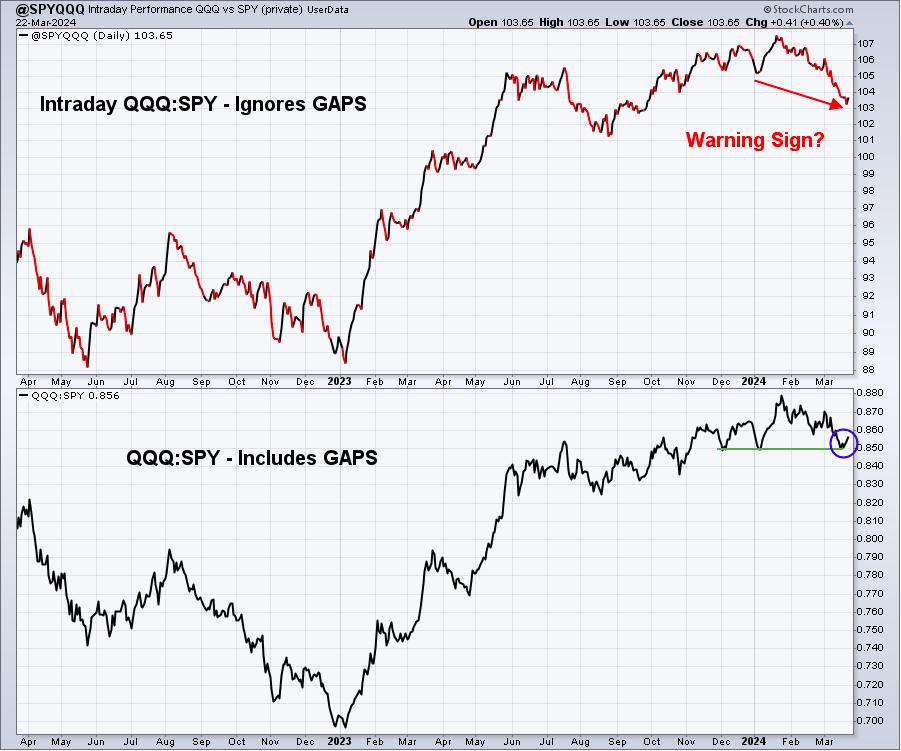
Last week, I indicated that even a short-term cautious signal should be ignored if we see aggressive rotation taking hold again. That's exactly what we saw after last Wednesday's Fed announcement. As money rotated more bullishly, we saw the S&P 500 clear 5200 to set new all-time highs. It's SO hard to bet against this type of bullish market environment.
Also, on the chart, both of these ratios turned higher last week. That's further evidence of a "risk on" market environment.
IWM:QQQ
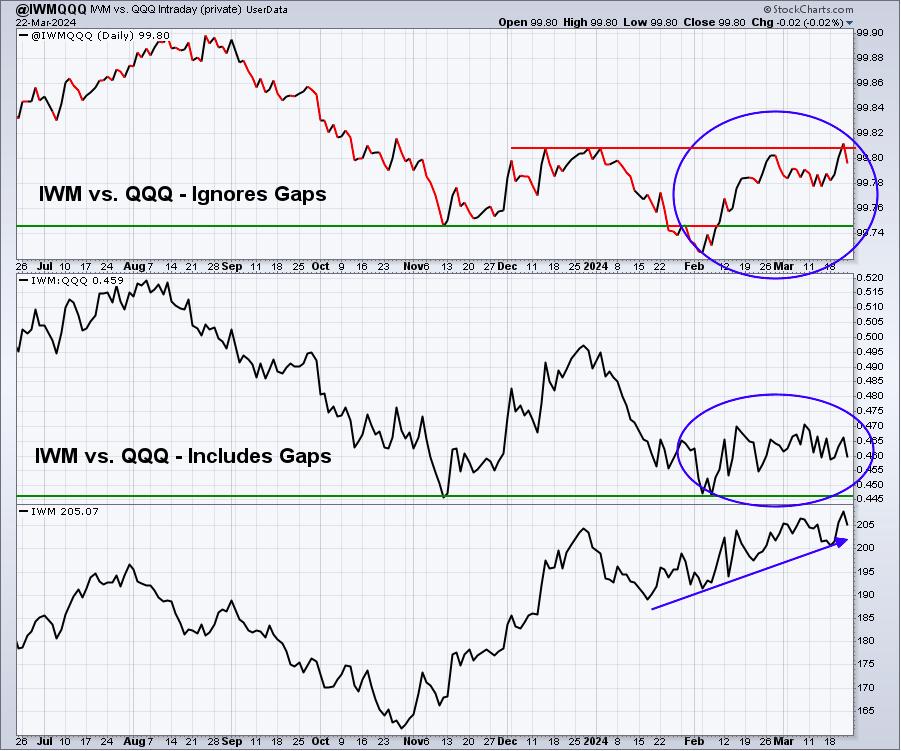
The intraday IWM:QQQ chart (top panel) actually set a new 4 1/2 month high, suggesting that rotation is taking place and small caps are beginning to benefit. Unfortunately, I haven't been tracking these ratios (excluding gaps) for a long time, so we're learning on the fly. Nonetheless, I firmly believe that what happens during the trading session is ultimately MUCH more important that what happens at the opening bell.
XLY:XLP
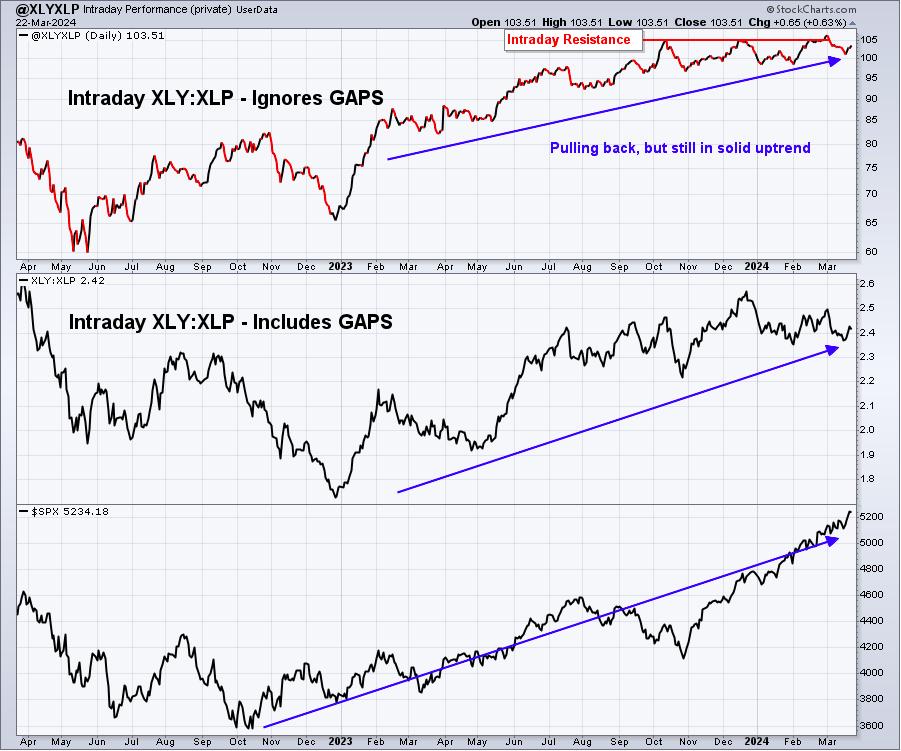
We've still got some work to do here, but it was encouraging to see money rotate more into discretionary than into staples last week. That's a recipe for higher prices across our major indices, so I always welcome it.
Key Sector/Industry Charts
We review these charts every day in our Daily Market Report, looking for key short-term breakouts, pullbacks to support, etc. This is different. We're looking here for sector and industry group charts that have done something longer-term to grab my attention. Here are a few such charts to be aware of:
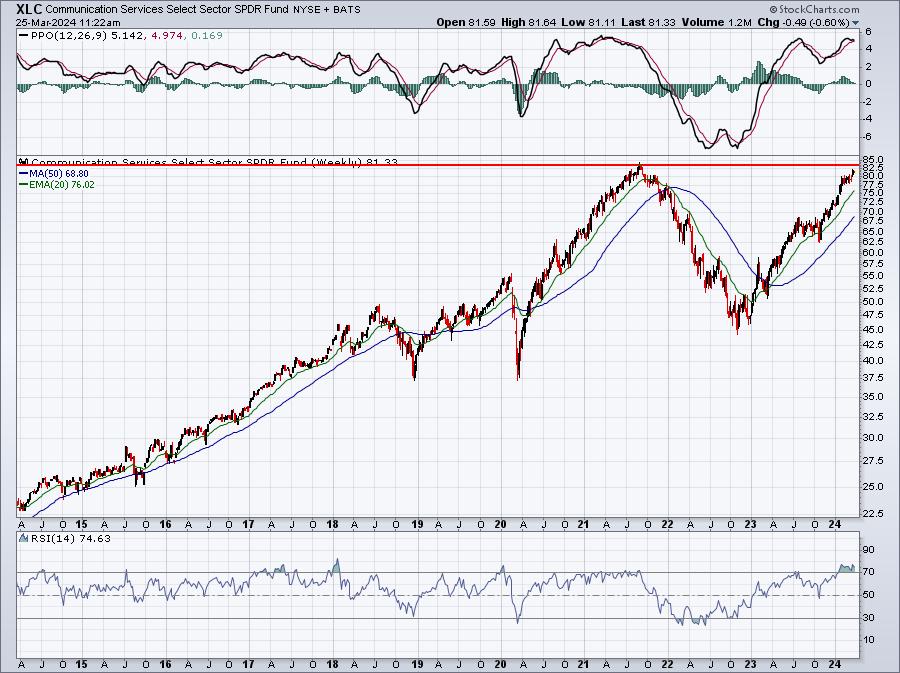
XLC:
The XLC is nearing a key double top. Perhaps we break right on through, which would be bullish. Until we see that breakout, however, we should respect this key long-term price resistance:
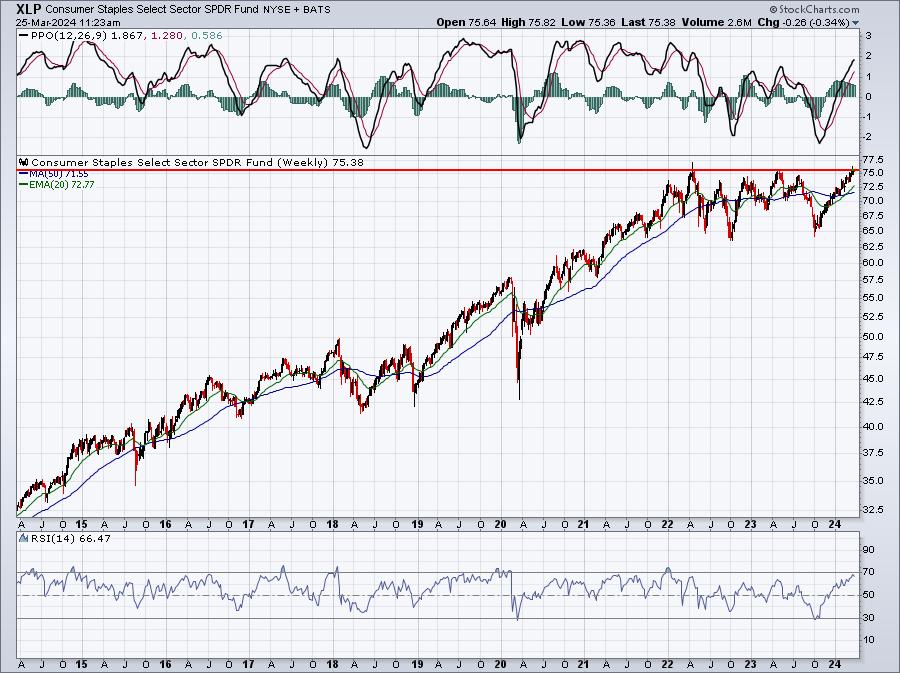
XLP:
The XLP has been back and forth for the better part of two years now. In the spirit of "wide participation", do we see an upcoming breakout in XLP? I say yes....
$DJUSCP - Containers & Packaging:
The multi-year downtrend seems to have reversed on this industry group. However, absolute price action and relative strength price action are two different animals. Check out this chart and you'll see what I'm referring to:
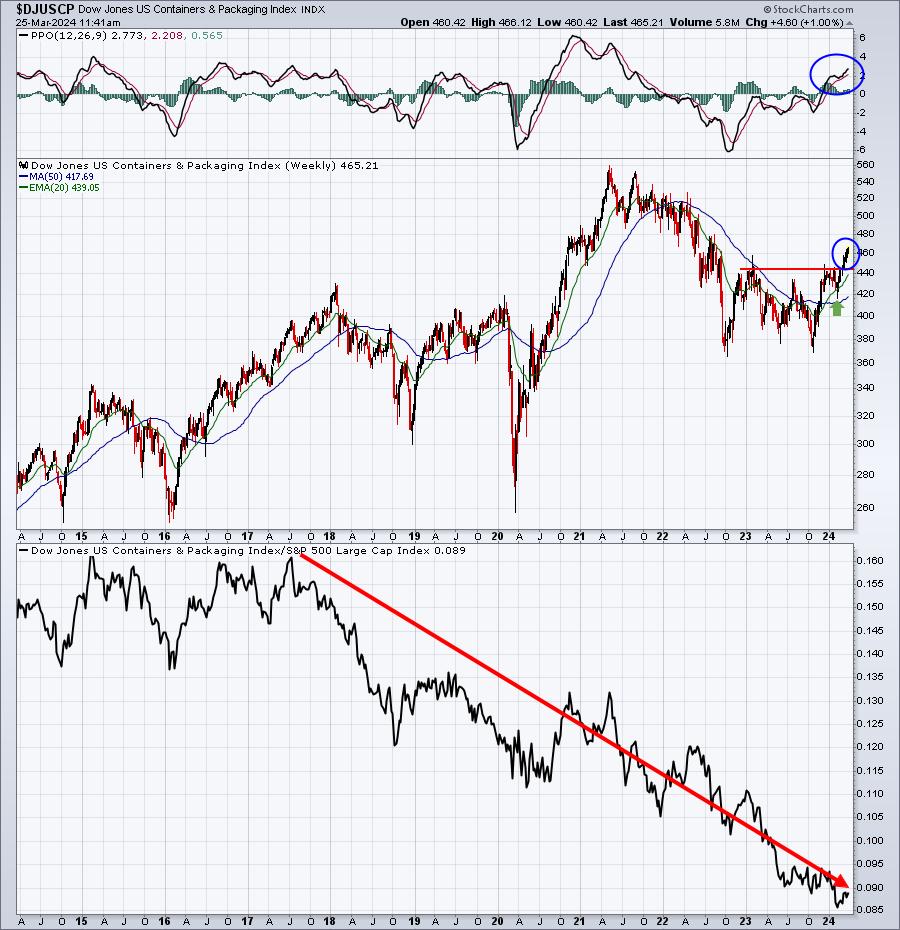
I think it's pretty clear that the DJUSCP is trading much better technically, based on absolute price action. But notice in the bottom panel that the relative downtrend continues. So, yes, containers & packaging is now participating in the bull market, but it continues to be a relative laggard. This reversal is good for the market (wider participation), but not so good for the DJUSCP (still declining relative strength).
I'll make this a fairly regular feature in the EB Weekly Market Report in order to cover lots of different areas of the market - all from a longer-term perspective.
Trade Setup
Since beginning this Weekly Market Report in early September, I've discussed the long-term trade candidates below that I really like. Generally, these stocks have excellent long-term track records and many pay nice dividends that mostly grow every year. Only in very specific cases (exceptions) would I consider a long-term entry into a stock that has a poor or limited long-term track record. I've added my latest thoughts on all stocks I've suggested for the long-term:
- JPM - up roughly 20% since adding in September 2023
- BA - bouncing off recent double bottom; been an underperformer, but I still love it long-term
- FFIV - currently in a bullish ascending triangle pattern, breakout would be close above 195
- MA - very steady uptrend; daily negative divergence suggests "possibility" of upcoming 50-day SMA test
- GS - expanding volume supported last week's breakout; strong performance since adding
- FDX - beautiful gap higher with earnings last week, but candle suspect; maybe a gap fill before moving higher
- AAPL - struggling in recent months, but AD line is strong; double bottom approaching near 165?
- CHRW - I'd guess a bottom is nearing as long-term uptrend line on monthly chart being tested now
- JBHT - down vs. its peers over past two months, but I'd expect 188 support to hold
- STX - chart here remains quite bullish
- HSY - was a bottom-fishing play and the jury is still out on that; love the long-term chart though
- DIS - big earnings gap higher in February now appears to be bullish difference maker
- MSCI - still hanging near earnings-related gap support
- SBUX - 88-90 is excellent price support on its chart; relative strength is lacking for now
- KRE - a bet on small and regional banks, holding steady for now
- ED - tends to perform well in any market; won't be a big winner, but will be a steady income provider
Keep in mind that our Weekly Market Reports favor those more interested in the long-term market picture. Therefore, the list of stocks above are stocks that we believe are safer to own with the long-term in mind. Nearly everything else we do at EarningsBeats.com favors short-term momentum trading, so I wanted to provide an explanation of what we're doing with this list. I continue to search for more companies to add to this long-term buy and hold list.
Looking Ahead
Upcoming Earnings:
Hard to believe, but Q1 earnings will begin in roughly 3 weeks. For now, however, earnings are limited. I've identified what I believe are key companies that will report this week, with their respective market caps in parenthesis. This is NOT a list of ALL companies reporting this week, so please be sure to check for earnings of any companies that you own or add. Any companies in BOLD represent stocks in one of our Portfolios:
- Monday: None
- Tuesday: MKC ($19 billion),
- Wednesday: CTAS ($65 billion), PAYX ($44 billion), CCL ($19 billion)
- Thursday: WBA ($18 billion)
- Friday: None
Key Economic Reports:
- Monday: February new home sales
- Tuesday: February durable goods orders, January Case-Shiller home price index, January FHFA house price index, March consumer confidence
- Wednesday: None
- Thursday: Initial jobless claims, Q4 GDP (final estimate), March Chicago PMI, March consumer sentiment, February pending home sales
- Friday: February personal income and spending (Market closed - Good Friday holiday)
Historical Data
I'm a true stock market historian. I am absolutely PASSIONATE about studying stock market history to provide us more clues about likely stock market direction and potential sectors/industries/stocks to trade. While I don't use history as a primary indicator, I'm always very aware of it as a secondary indicator. I love it when history lines up with my technical signals, providing me much more confidence to make particular trades.
Below you'll find the next two weeks of historical data and tendencies across the 3 key indices that I follow most closely:
S&P 500 (since 1950)
- March 25: +17.59%
- March 26: +85.36%
- March 27: -43.22%
- March 28: -4.68%
- March 29: +51.39%
- March 30: -39.66%
- March 31: -7.16%
- April 1: +69.91%
- April 2: +21.17%
- April 3: -0.96%
- April 4: -11.99%
- April 5: +64.00%
- April 6: +45.38%
- April 7: -48.59%
NASDAQ (since 1971)
- March 25: +15.85%
- March 26: +129.71%
- March 27: -110.82%
- March 28: -61.77%
- March 29: +53.31%
- March 30: -12.85%
- March 31: +39.81%
- April 1: +85.23%
- April 2: +26.11%
- April 3: -90.48%
- April 4: -62.77%
- April 5: +107.10%
- April 6: +26.71%
- April 7: -38.23%
Russell 2000 (since 1987)
- March 25: +109.10%
- March 26: +197.25%
- March 27: -99.59%
- March 28: -76.94%
- March 29: +64.48%
- March 30: +26.93%
- March 31: +78.83%
- April 1: +40.36%
- April 2: +40.59%
- April 3: -123.68%
- April 4: -67.59%
- April 5: +100.49%
- April 6: +51.29%
- April 7: -90.50%
The S&P 500 data dates back to 1950, while the NASDAQ and Russell 2000 information date back to 1971 and 1987, respectively.
The March 23rd to April 10th period does lean towards the bulls. Here are the annualized returns for each major index over this period, which just began:
- S&P 500 (since 1950): +22.20%
- NASDAQ (since 1971): +16.06%
- Russell 2000 (since 1987): +26.00%
Final Thoughts
Thank you Fed and Fed Chief Powell. For once, they didn't backtrack and reverse off of what they said the prior month. It removed a few anxious moments leading up to the Fed announcement last Wednesday, and removing uncertainties is ALWAYS a good thing for stocks.
Here are several things to consider in the week ahead:
- Small Caps. The IWM attempted a key breakout at 208.21, but failed. It's also been showing more relative strength vs. the QQQ on my intraday User-Defined Index. We need a breakout to increase the odds of small caps outperforming as we head into Q2.
- Interest rates. You'd think that with the Fed essentially ignoring the higher-than-expected CPI and PPI numbers last week, bond traders would buy and send yields lower. While that's been the case to some degree, the 10-year treasury yield ($TNX) is stubbornly hanging today at 4.25%, which remains above the 20-day EMA. And the 20-day EMA is above the 50-day SMA. We're still in an uptrending TNX environment. Maybe that's okay if it occurs with the threat of inflation declining - I'm still open to that possibility. But most bulls I'm sure would like to see the TNX falling.
- Rotation. After the Fed meeting, rotation absolutely favored more risk-on areas like industrials, financials, technology, etc. Growth saw a comeback vs. value. The start of Q1 earnings season is only a few weeks away, so it'll be important to follow rotation to see what the big Wall Street firms are expecting by sector, industry group, and even down to the individual stock level.
- Historical Strength. The latter part of March and early April tend to encourage higher stock prices. Right now, as our major indices move to new and, in some cases, all-time highs, historical tailwinds will only aid what we're already seeing - a secular bull market advance.
- Sentiment. This is ongoing, of course, but if we do see continuing market strength, does our speed boat sentiment indicator (5-day SMA of CPCE) move down to help identify a short-term market top? I'm not counting on this happening, but it's at least worth monitoring.
- Lack of Catalysts. During this holiday-shortened week, there'll be few economic or earnings reports. So traders will simply be following the technicals, which mostly look pretty darn good right now.
Feedback
If you'd like to share your thoughts on our Weekly Market Report, positive or negative, you can reach us at "[email protected]".
Happy trading!
Tom