
EB Weekly Market Report - Monday, April 1, 2024
Weekly Market Recap Video
Our latest EB Weekly Market Recap video is available on YouTube. You can CLICK HERE to watch my latest. This video is NOT the same as this EB Weekly Market Report. Some content is similar, but this report is much more about the LONG-TERM. The Weekly Market Recap video has more of a trader's feel to it, in my opinion. Having both of them together, however, will likely fill gaps in what you might be looking for.
Be sure to check it out, "Like" the video, subscribe to our channel, and leave us comments under the video to let us know what you think. If you want to send something to us more anonymously, feel free to write us at "[email protected]". Thanks for any and all feedback!
ChartLists Updated
Several ChartLists were updated on Friday and will be updated on our website by tomorrow morning:
- Strong Earnings (SECL)
- Strong Future Earnings (SFECL)
- Raised Guidance (RGCL)
- Short Squeeze (SSCL)
- Bullish Trifecta (BTCL)
Weekly Market Recap
Major Indices
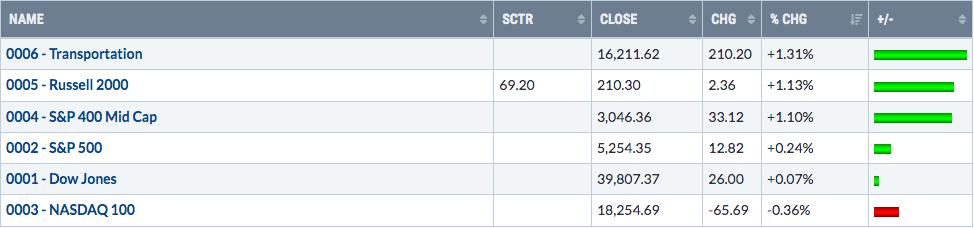
Transports ($TRAN) led the action last week, but much of that strength occurred on Thursday and Friday as the TRAN gained 1.12% and 1.14%, respectively. One HUGE difference in this bounce, however, is that occurred on a pullback that HELD our key moving average support:
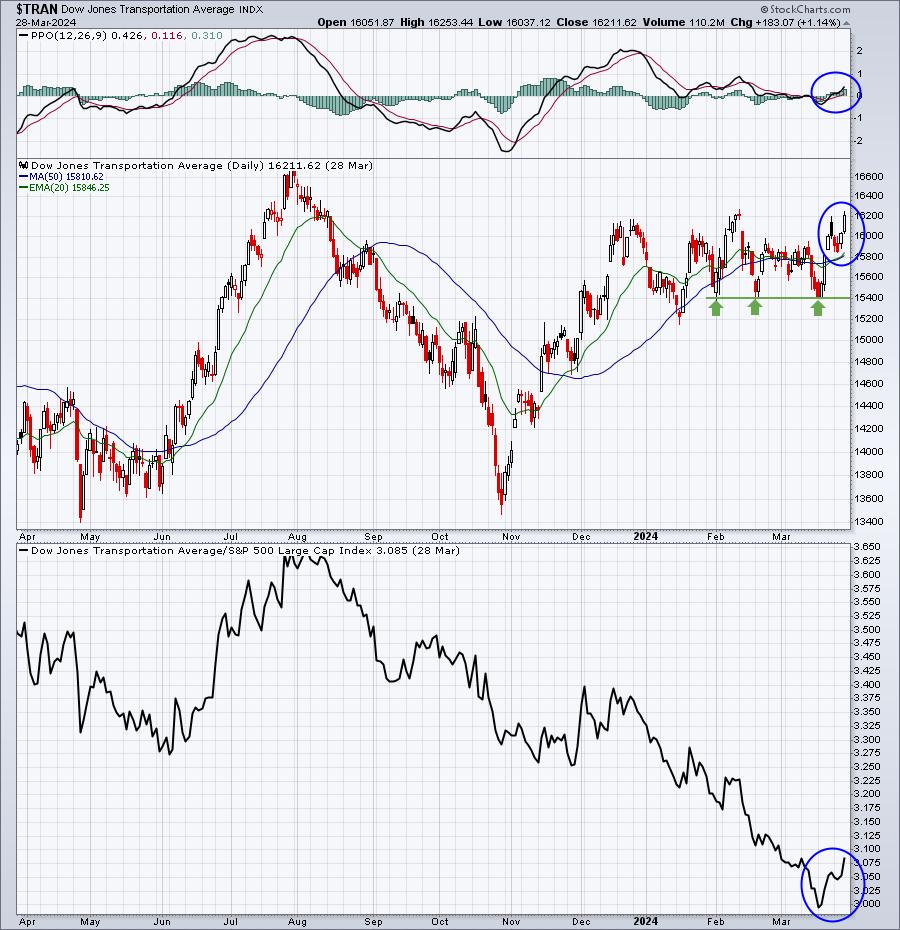
This just looks different. The PPO looks stronger, suggesting that momentum is bullish and accelerating. Second, the move up to 16200 price resistance wasn't followed by another trip back to 15400. Instead, the ensuing pullback never cleared support from the 20-day EMA and the 50-day SMA. It then rallied to a higher high. I won't be a bit surprised if TRAN have a big week ahead, finally clearing the 16200-16250 zone of price resistance.
It was also a week where we saw rotation into the small cap Russell 2000 (IWM) that led to a breakout there:
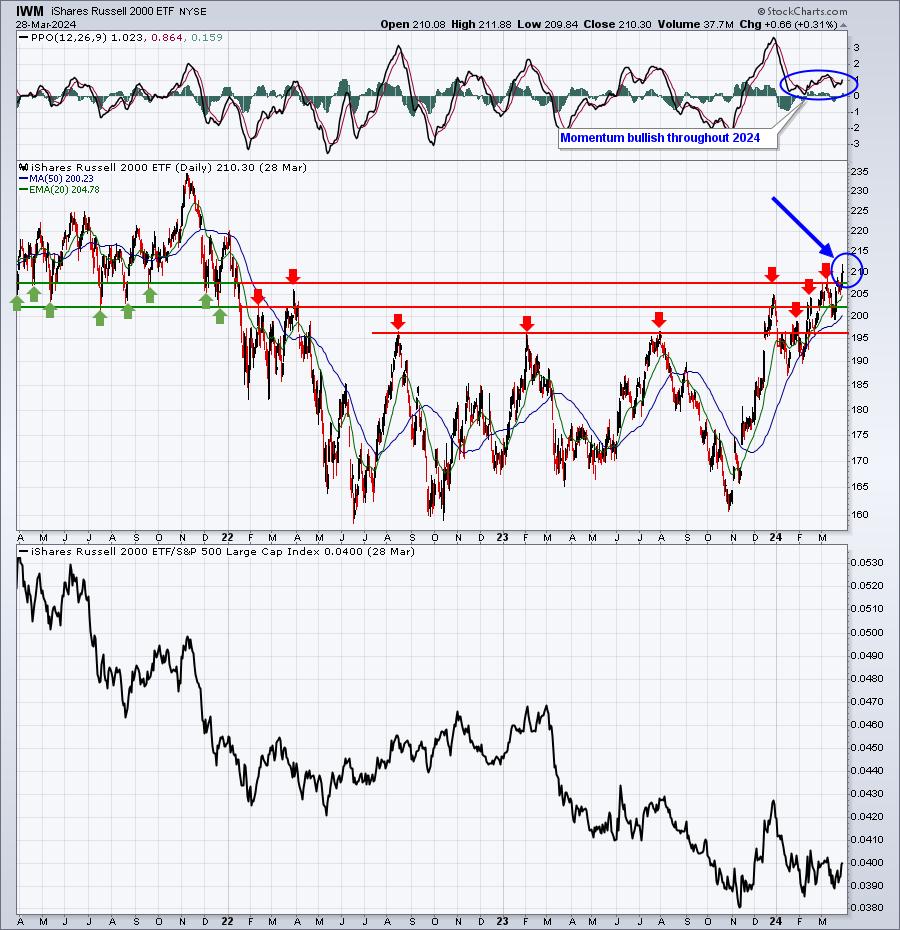
Like the TRAN, the IWM just seems to be trading differently, in much more bullish fashion right now. Absolute price action is trending higher with a daily PPO that's been above the centerline all of 2024. Over the past couple years, we saw rallies that simply fizzled. This one seems to have staying power. The clear prior 2021 support range from 202-208, upon breakdown, became clear 2022-2024 resistance range until last week. I'll be looking for further confirmation to open April in the form of higher IWM price action. We'll see.
Sectors
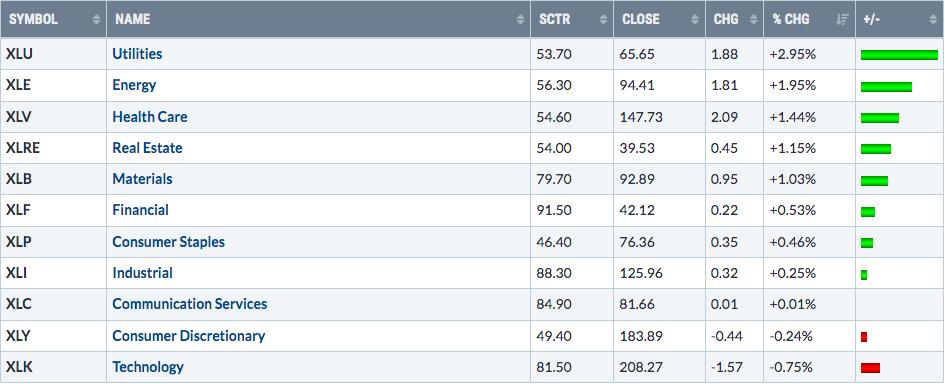
The most aggressive sectors failed to participate last week and money rotated from these groups into more defensive- and value-oriented areas of the market. This led to improvement in many breadth indicators, for those who like to follow such indicators. Personally, I'm not much of a fan and 2023 was a perfect illustration of why. My problem is that many analysts who use breadth indicators in their market analysis rely on the indicator as a primary indicator. They attempt to paint a bearish market picture, while a secular bull market advance matures. Bottoming and then uptrending from the depths of a cyclical or secular bear market is a process. Unfortunately, breadth indictors will many times signal us to be cautious when there's no reason for it. At least that's my opinion.
The good news for the bulls is that bull market participation is rising. Health care (XLV) and financials (XLF) are two sectors that didn't really participate in the rally off the 2022 low - until the latest rally that began in late-October 2023:
Health care (XLV):
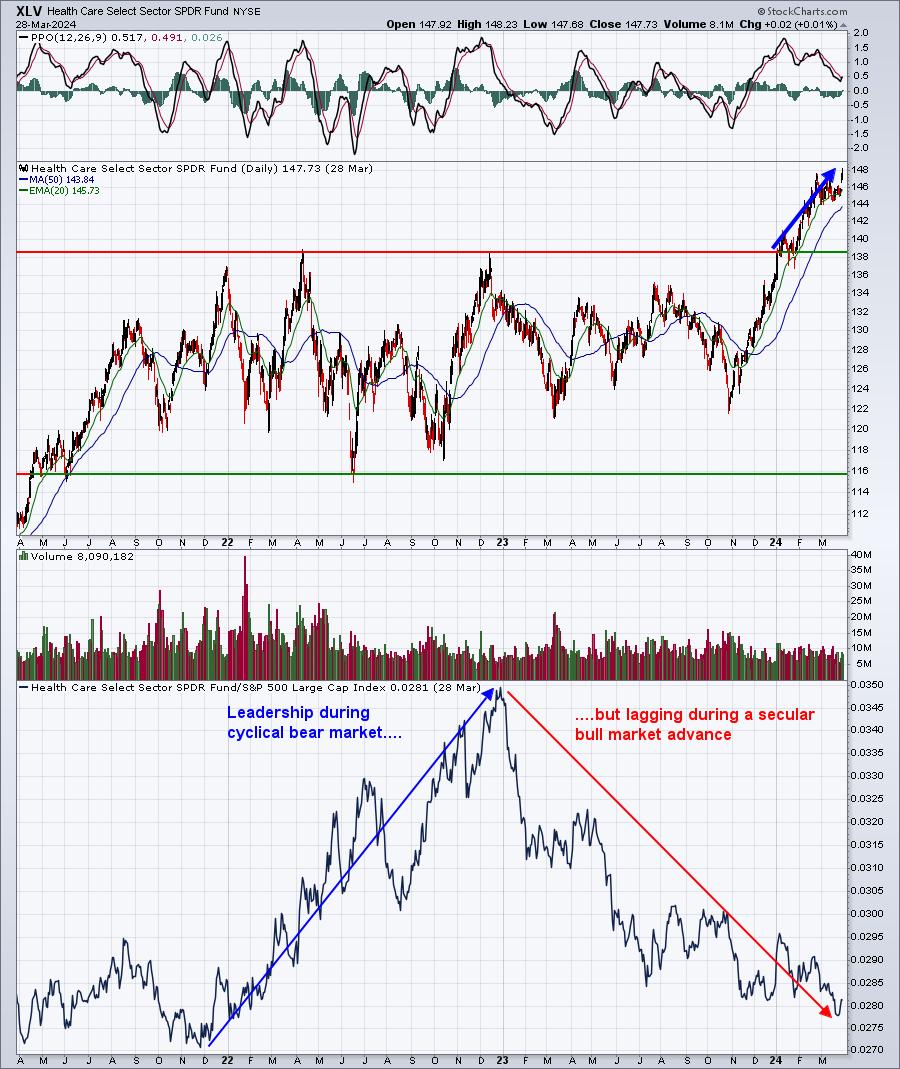
Note that "participating" in a secular bull market advance is NOT the same as "leading" in a secular bull market advance. The XLV tends to LEAD during bear markets and LAG during bull markets. That point is made rather clear on the chart above.
Financials (XLF):
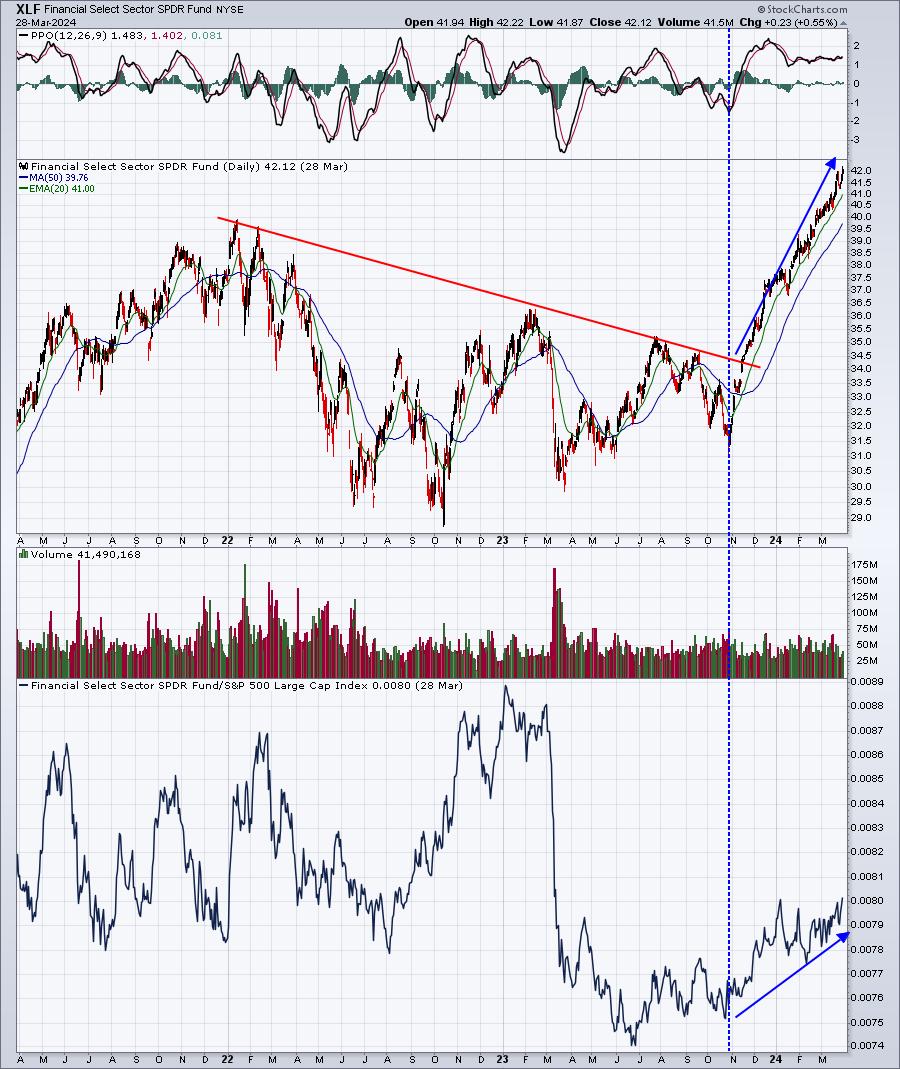
Over time, financials tend to go along for the ride with the S&P 500. We don't typically see a lot of relative strength or relative weakness. But the absolute price action since late-October 2023 is quite clear. The XLF is scorching higher and we're even seeing this group emerge as one of the leaders. The anticipation of lower short-term (fed funds) rates ahead are likely fueling this rally.
Top 10 Industries Last Week
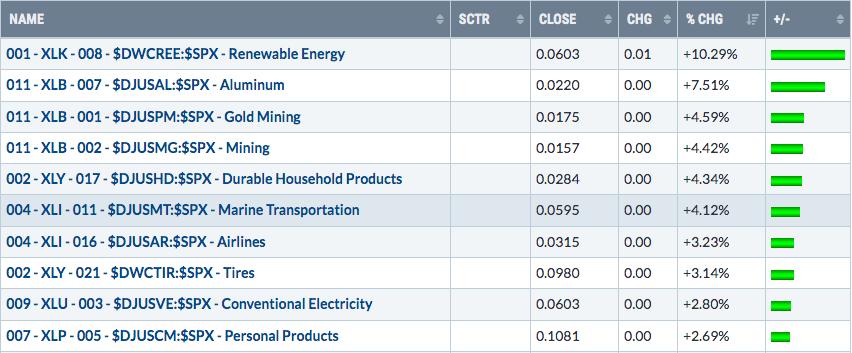
Airlines ($DJUSAR) broke out last week, which was one reason why transportation stocks were so strong. If this group sees follow through from its breakout, it's much more likely that we'll see the TRAN breakout too:
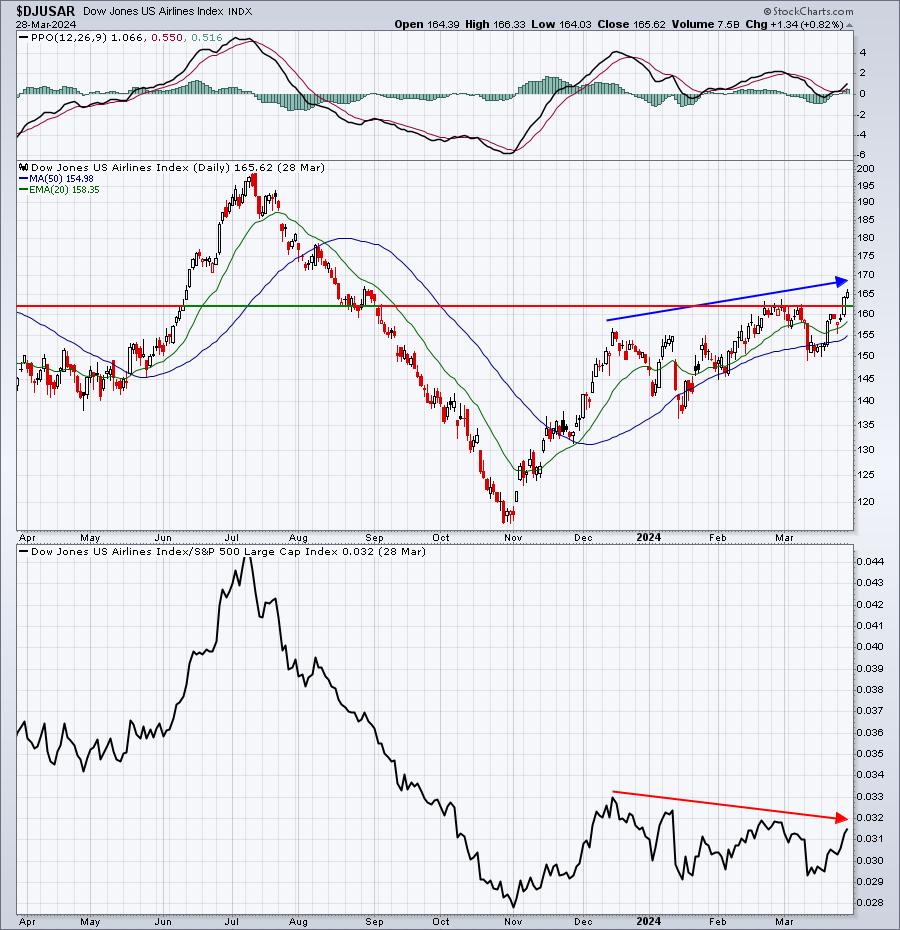
This is sometimes what a secular bull market looks like. Airlines are breaking out to their highest level since September 2023, but their relative strength is not. Just as I mentioned earlier, wide participation doesn't equal relative strength. Breakouts are BULLISH, but that doesn't mean you found new leadership. That bottom panel needs to break out as well.
Bottom 10 Industries Last Week
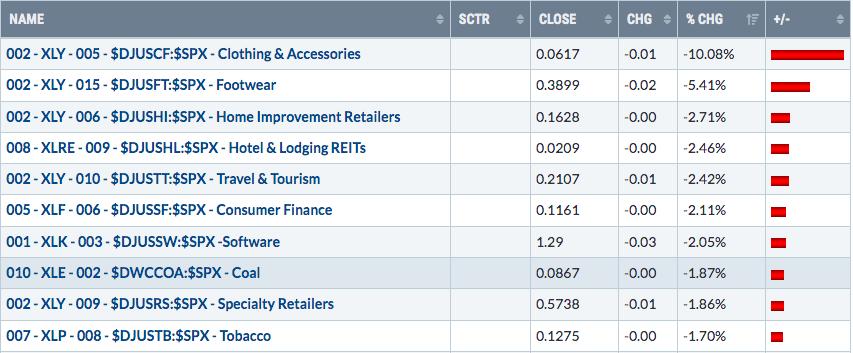
Similarly, strong leading groups can show weakness from time to time and still be bullish. Money leaving the group temporarily, while it consolidates, simply moves to areas of the market that have been lagging - like airlines. Eventually, we'll see that rotation make its way back to the leaders. This applies to software, which has been leading the market higher for the past 15 months.
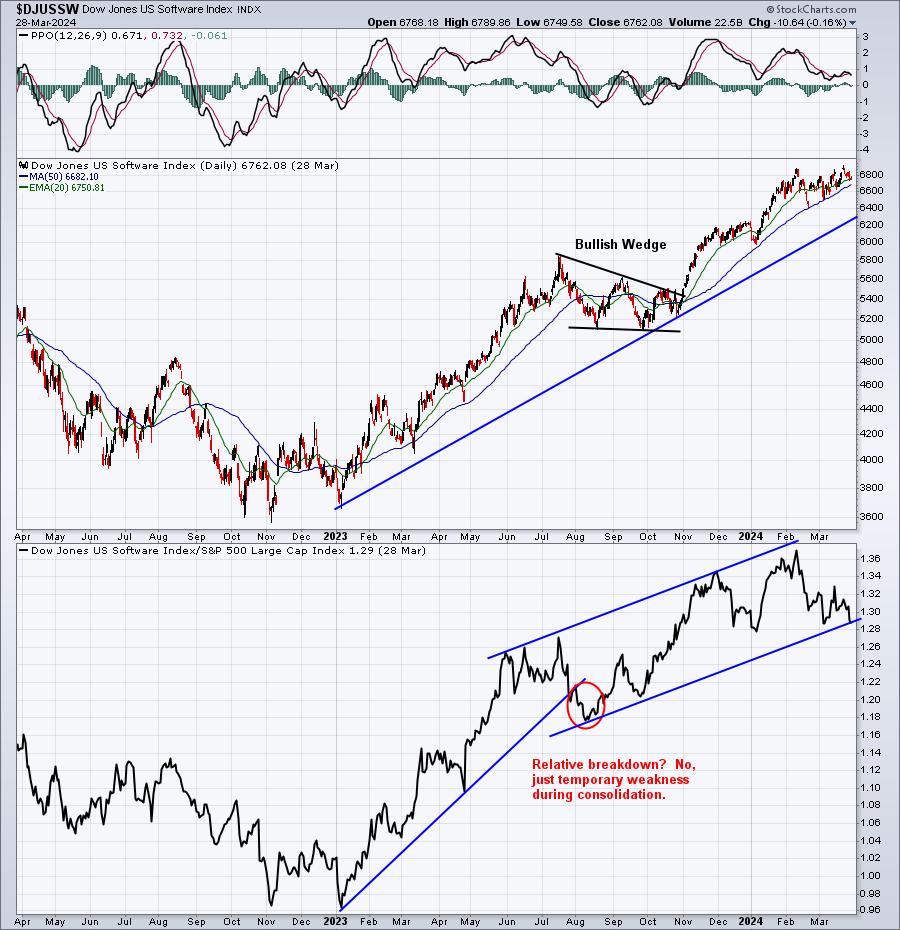
If seasonality is any guide, then we should expect to see strength again sooner rather than later. Check this out:
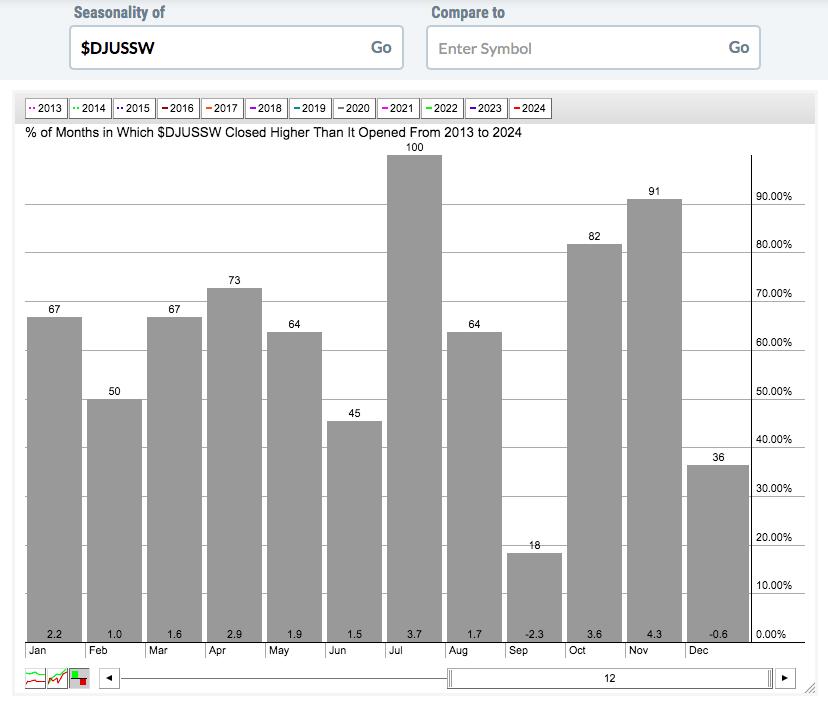
If we break this chart down by month of the calendar quarter, you can see when software typically makes its runs to the upside:
- Month 1 (Jan, Apr, Jul, Oct): +12.4%
- Month 2 (Feb, May, Aug, Nov): +8.9%
- Month 3 (Mar, Jun, Sep, Dec): +0.2%
This lines up beautifully with the quarterly analyses I've provided in the past. The first half of calendar quarters performs much better than second halves. It's a reason why I tend to pull back my bullish reins when we move into the 3rd month of each calendar quarter.
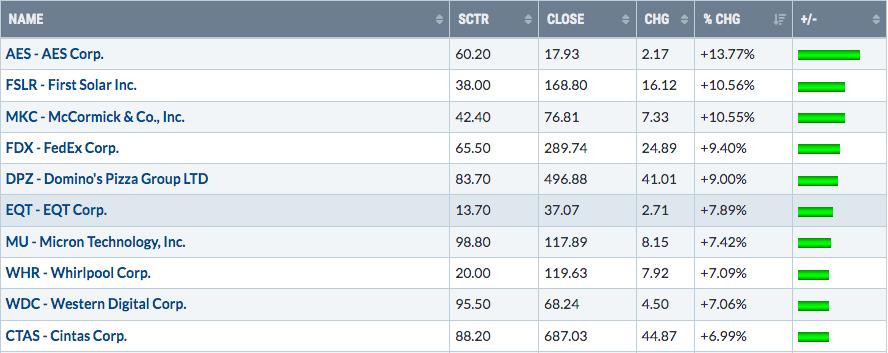
Top 10 Stocks - S&P 500/NASDAQ 100
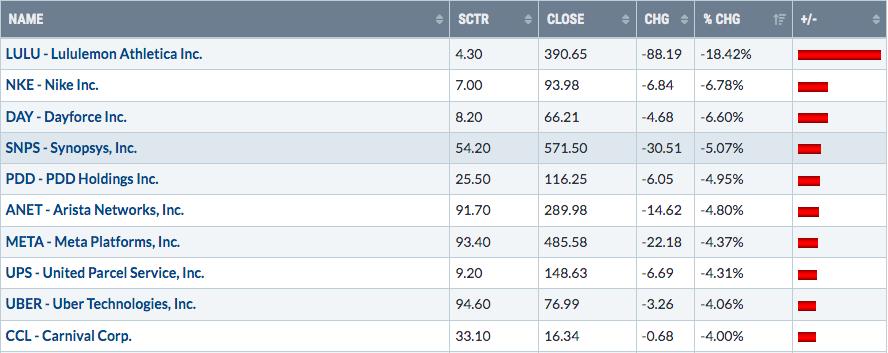
Bottom 10 Stocks - S&P 500/NASDAQ 100
Big Picture
The Fed is behind us and we're now beginning to set our sights on Q1 earnings season. Companies tend to under promise and over deliver, when it comes to earnings. That's why I generally will laugh at analysts when they talk about "this earnings season will be a rough one". It's BS. They KNOW the history of earnings. Historically, about 70% of companies beat consensus estimates for earnings. In recent quarters, that number has been closer to 80%. It's all part of the Wall Street manipulation that we need to learn to ignore. This media hype should be given ZERO consideration. Stick to the plan, which is to follow the charts and the story the charts are telling us.
Speaking of stories, this Big Picture 100-year chart of the S&P 500 tells us to be long OFTEN - until secondary indicators literally BEAT US OVER THE HEAD that significant risks are building. Here's how this weekly reminder looks right now:
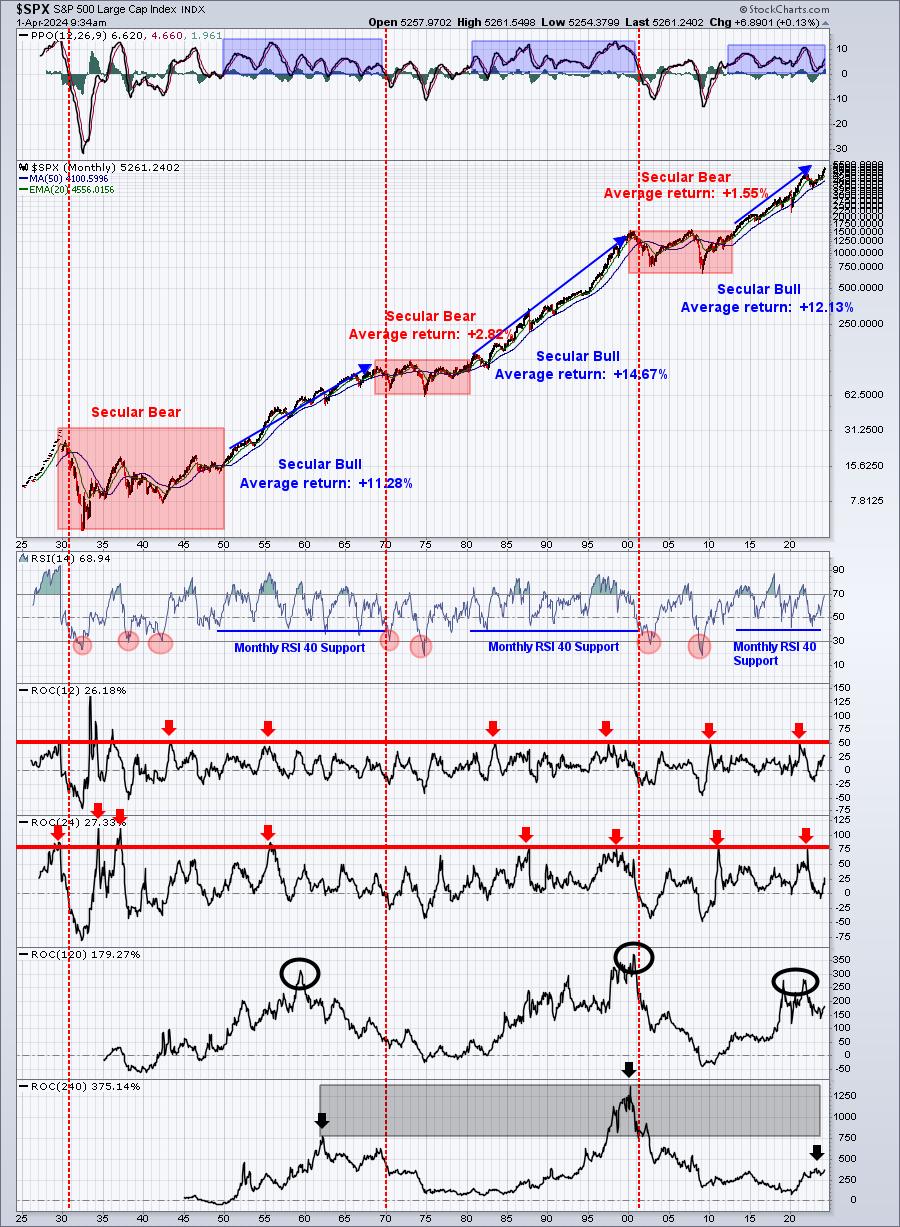
Monthly PPO is gaining more and more momentum to the upside. The monthly RSI is nearly 69, but you can see from the above chart that, during secular bull market advances, this oscillator can reach well into the 70s, even 80s, before we see any sort of meaningful top.
Stay the bullish course.
Sentiment
Just a quick update here today.
Nothing much has changed. The 5-day SMA of the equity only put call ratio ($CPCE) remains in neutral and the long-term 253-day SMA continues falling, supporting a further rise in U.S. equities.
Rotation/Intermarket Analysis
Here's the latest look at our key intraday ratios as we follow where the money is traveling:
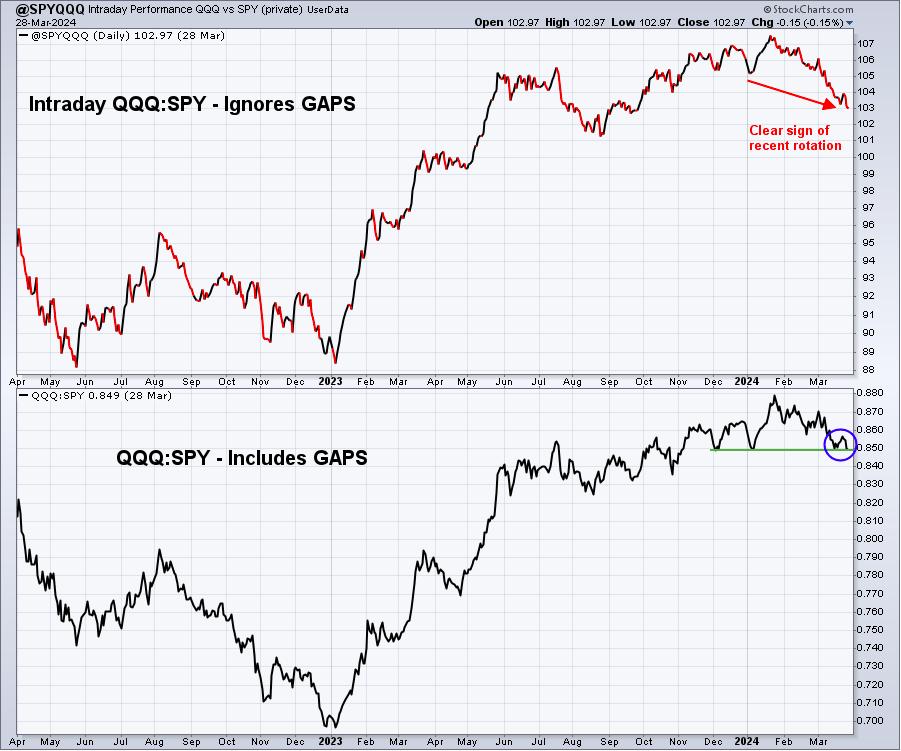
QQQ:SPY
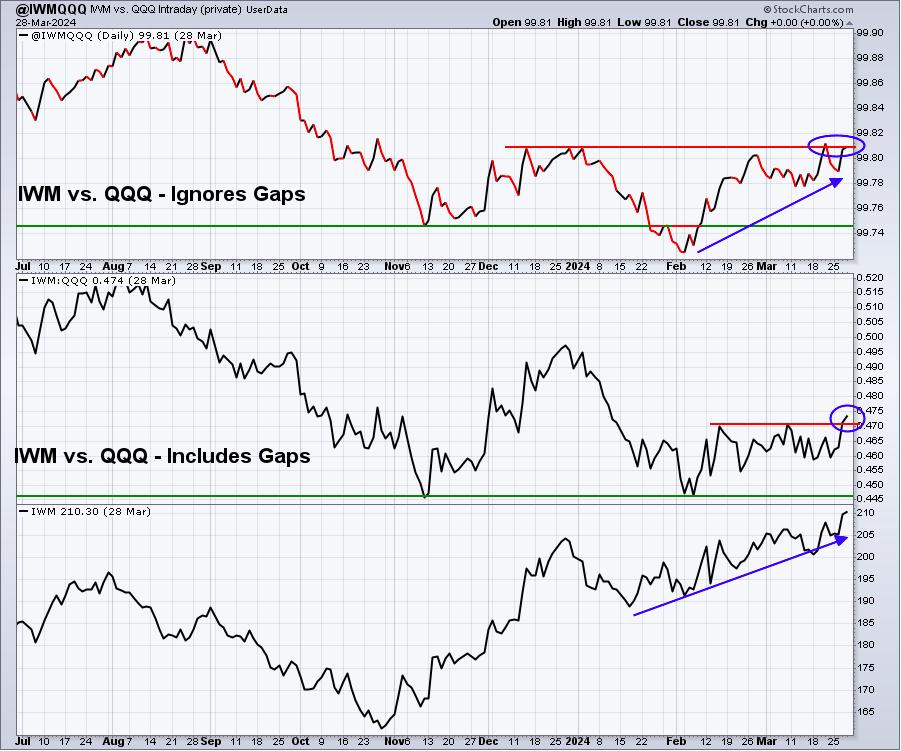
IWM:QQQ
XLY:XLP
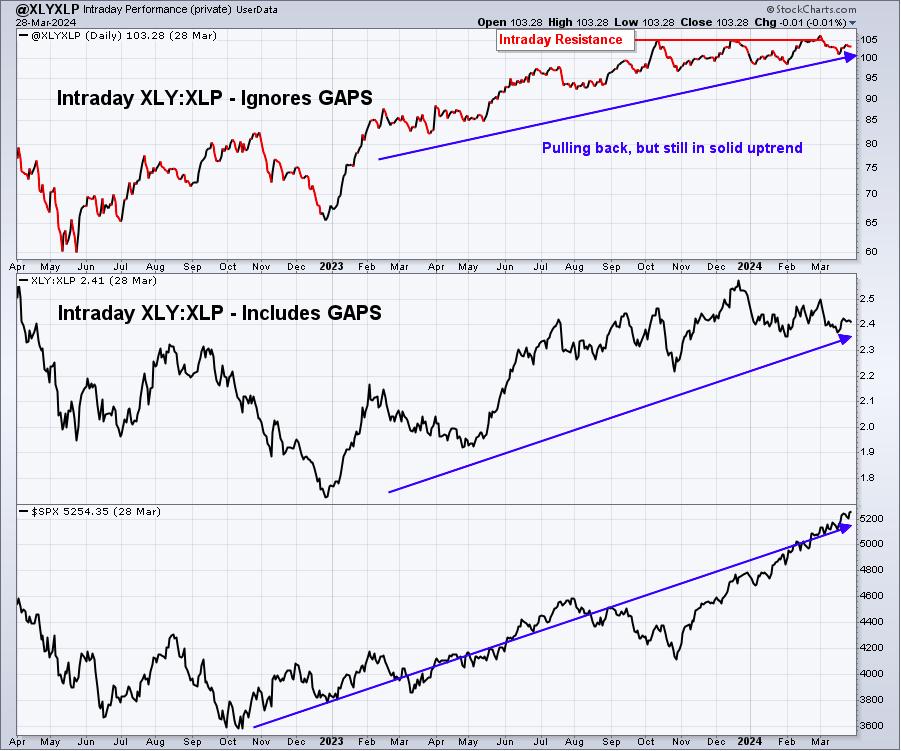
The XLY:XLP ratio tells me that the overall market environment remains bullish as it's important for this ratio to remain in an uptrend to support the bull market.
The other two ratios above, IWM:QQQ and QQQ:SPY, both represent the rotation that's been taking place in the market away from growth and into value the past few weeks. Early this morning, we're seeing rotation back towards growth, but of course, most of it happened at the opening bell, so we'll see how rotation plays out the balance of today and this week.
Key Sector/Industry Charts
We review these charts every day in our Daily Market Report, looking for key short-term breakouts, pullbacks to support, etc. This is different. We're looking here for sector and industry group charts that have done something longer-term to grab my attention. Here are two such charts to be aware of:
XLV:
The XLV had been strengthening until this morning, but the long-term weekly chart shows much more bullish action in 2024:
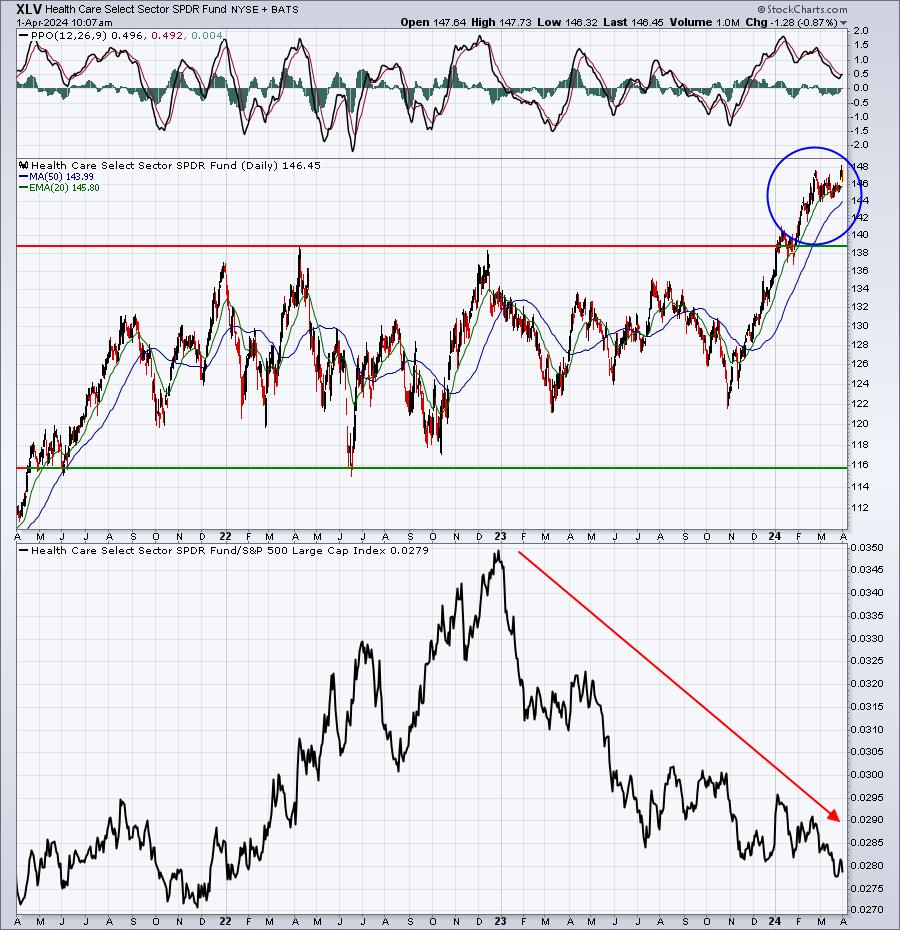
This is another great example of how wide participation in a bull market works. The XLV has hit a 2-year relative low, but made a significant absolute price breakout. These breakouts limit short sellers' options. What do you short when every area of the stock market is trending higher. Eventually, shorts have to end the pain and cover (buy), resulting in a market melt up.
Specialized Consumer Services ($DJUSCS):
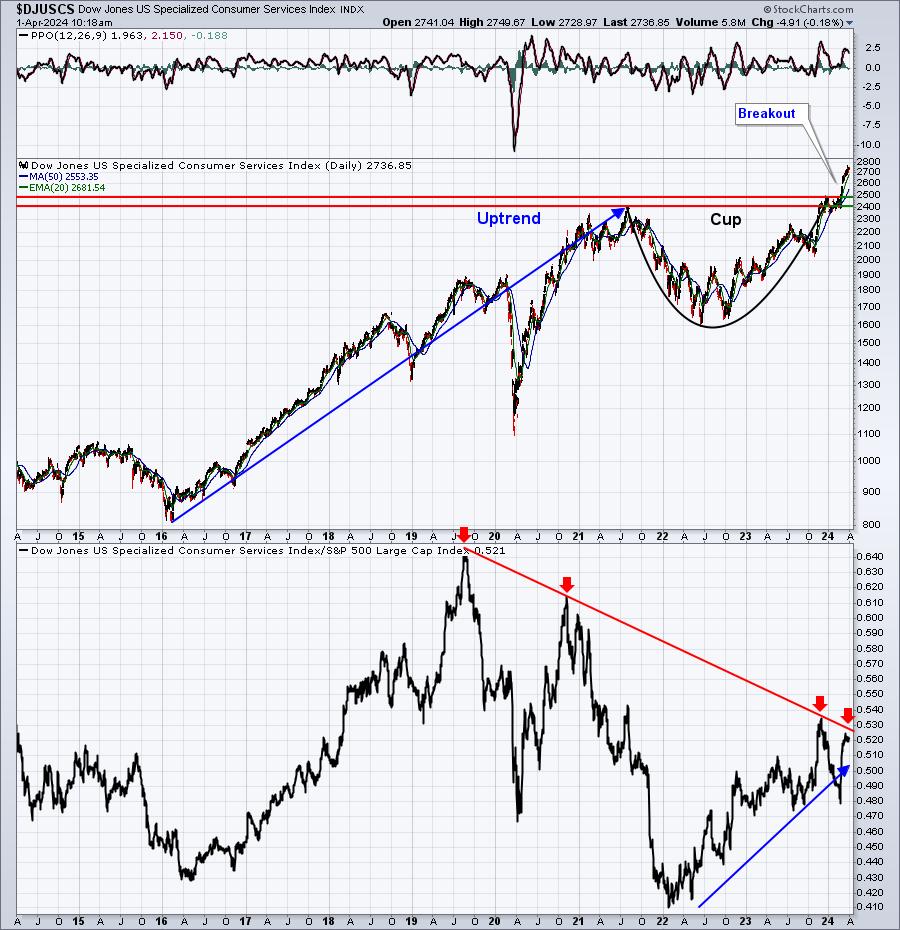
This is a very lengthy cup with handle (base), but many traders will recognize it. Therefore, I believe we could see the initial measurement reached over the next 1-2 years. That measurement would be roughly 3400, a 25% move from current price. Watch for an important bullish development - the breakout of the relative downtrend in the bottom panel.
Trade Setup
Since beginning this Weekly Market Report in early September, I've discussed the long-term trade candidates below that I really like. Generally, these stocks have excellent long-term track records and many pay nice dividends that mostly grow every year. Only in very specific cases (exceptions) would I consider a long-term entry into a stock that has a poor or limited long-term track record. I've added my latest thoughts on all stocks I've suggested for the long-term:
- JPM - up roughly 20% since adding in September 2023
- BA - bouncing off recent double bottom; been an underperformer, but I still love it long-term
- FFIV - currently in a bullish ascending triangle pattern, breakout would be close above 195
- MA - very steady uptrend; daily negative divergence suggests "possibility" of upcoming 50-day SMA test
- GS - expanding volume supported last week's breakout; strong performance since adding
- FDX - beautiful gap higher with earnings last week, but candle suspect; maybe a gap fill before moving higher
- AAPL - struggling in recent months, but AD line is strong; double bottom approaching near 165?
- CHRW - I'd guess a bottom is nearing as long-term uptrend line on monthly chart being tested now
- JBHT - down vs. its peers over past two months, but I'd expect 188 support to hold
- STX - chart here remains quite bullish
- HSY - was a bottom-fishing play and the jury is still out on that; love the long-term chart though
- DIS - big earnings gap higher in February now appears to be bullish difference maker
- MSCI - still hanging near earnings-related gap support
- SBUX - 88-90 is excellent price support on its chart; relative strength is lacking for now
- KRE - a bet on small and regional banks, holding steady for now
- ED - tends to perform well in any market; won't be a big winner, but will be a steady income provider
I'm going to add another stellar long-term performer to our long-term list of stock buys. Please keep in mind that this list is provided for EDUCATIONAL purposes and that neither I nor EarningsBeats.com are Registered Investment Advisors (RIAs), so please consult your personal financial advisor before buying or selling any securities.
Arthur Gallagher & Company (AJG):
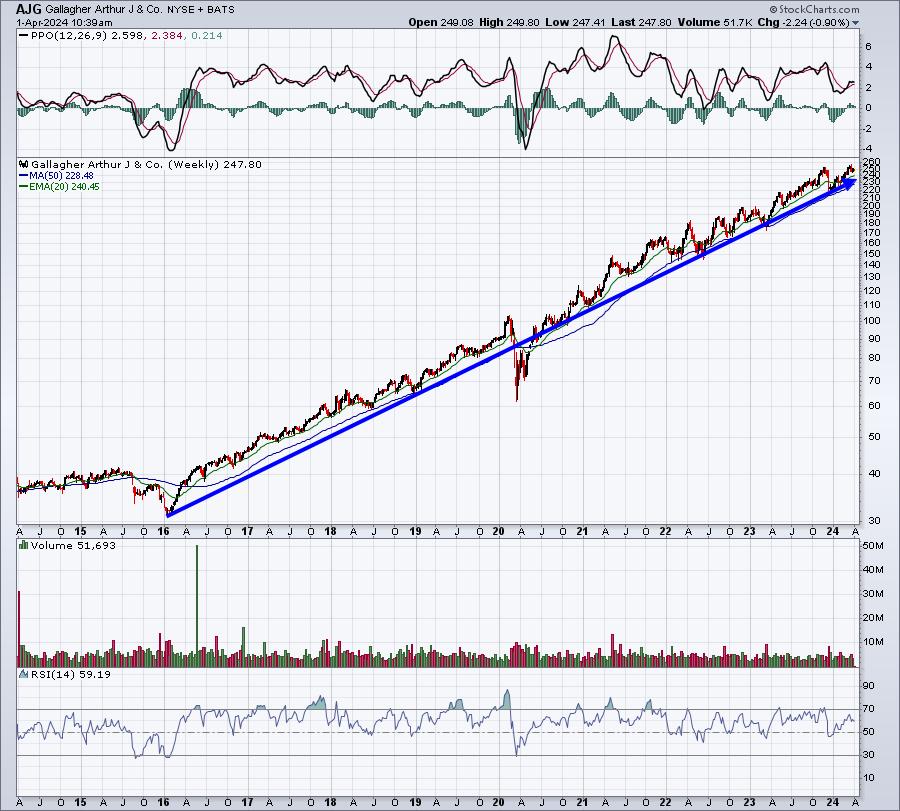
In addition to steady capital appreciation over the past 30 years, AJG has raised its dividend every year (except from 2008-2010 - it remained the same for 3 years) for as long as I researched back - which was to 1995. That means the dividend was raised through the dot.com bubble (2000-2022) and the pandemic (2020). During the financial crisis of 2008-2009, it held steady as it wasn't increased or decreased. The yield currently is just below 1.00%, but it seems like a bonus on top of the nice capital appreciation enjoyed over the years.
AJG is a $54 billion insurance broker that was founded in 1927 and is headquartered in Rolling Meadows, Illinois, just outside of Chicago.
Keep in mind that our Weekly Market Reports favor those more interested in the long-term market picture. Therefore, the list of stocks above are stocks that we believe are safer (but nothing is ever 100% safe) to own with the long-term in mind. Nearly everything else we do at EarningsBeats.com favors short-term momentum trading, so I wanted to provide an explanation of what we're doing with this list. I continue to search for more companies to add to this long-term buy and hold list.
Looking Ahead
Upcoming Earnings:
Q1 earnings will begin in just 2 weeks. This week, however, earnings are limited. I've identified what I believe are key companies that will report this week, with their respective market caps in parenthesis. This is NOT a list of ALL companies reporting this week, so please be sure to check for earnings of any companies that you own or add. Any companies in BOLD represent stocks in one of our Portfolios:
- Monday: None
- Tuesday: PAYX ($44 billion)
- Wednesday: None
- Thursday: None
- Friday: None
Key Economic Reports:
- Monday: March PMI manufacturing, March ISM manufacturing, February construction spending
- Tuesday: February factory orders, February JOLTS
- Wednesday: March ADP employment report, March ISM services
- Thursday: Initial jobless claims
- Friday: March nonfarm payrolls
Historical Data
I'm a true stock market historian. I am absolutely PASSIONATE about studying stock market history to provide us more clues about likely stock market direction and potential sectors/industries/stocks to trade. While I don't use history as a primary indicator, I'm always very aware of it as a secondary indicator. I love it when history lines up with my technical signals, providing me much more confidence to make particular trades.
Below you'll find the next two weeks of historical data and tendencies across the 3 key indices that I follow most closely:
S&P 500 (since 1950)
- April 1: +69.91%
- April 2: +21.17%
- April 3: -0.96%
- April 4: -11.99%
- April 5: +64.00%
- April 6: +45.38%
- April 7: -48.59%
- April 8: +64.12%
- April 9: +60.84%
- April 10: +53.11%
- April 11: -33.50%
- April 12: +72.70%
- April 13: -21.35%
- April 14: -1.74%
NASDAQ (since 1971)
- April 1: +85.23%
- April 2: +26.11%
- April 3: -90.48%
- April 4: -62.77%
- April 5: +107.10%
- April 6: +26.71%
- April 7: -38.23%
- April 8: +45.65%
- April 9: +59.99%
- April 10: +55.36%
- April 11: -63.62%
- April 12: +44.73%
- April 13: -0.08%
- April 14: -63.47%
Russell 2000 (since 1987)
- April 1: +40.36%
- April 2: +40.59%
- April 3: -123.68%
- April 4: -67.59%
- April 5: +100.49%
- April 6: +51.29%
- April 7: -90.50%
- April 8: +57.00%
- April 9: +139.64%
- April 10: +34.40%
- April 11: -90.58%
- April 12: +64.76%
- April 13: -37.09%
- April 14: -79.71%
The S&P 500 data dates back to 1950, while the NASDAQ and Russell 2000 information date back to 1971 and 1987, respectively.
From our April Seasonality Report, here's how April historically breaks down on the benchmark S&P 500 (annualized returns):
- April 1-18: +31.39%
- April 19-24: -8.77%
- April 25-30: +10.55%
Final Thoughts
Overall, last week was a good week and it was nice to see leadership from key areas like transports ($TRAN) and small caps (IWM). But this is a new week and, as we are all well aware by now, anything can and usually will happen.
Here are several things to consider in the week ahead:
- Small Caps. The IWM had a major breakout, closing above 208.21. That level, along with the rising 20-day EMA, currently at 205.16 are the two short-term support levels to watch. From a longer-term perspective, the rising 20-week EMA will be more critical and that is currently at 197.77.
- Transport. When transports and small caps begin performing well, especially together, it's a bullish signal about our economy. Should these two continue rising, expect to see good news coming on the economic front. These two could also benefit from more solid inflation (lack thereof) news as it would encourage the Fed to lower fed funds sooner rather than later. I still expect the first cut to be at the June meeting.
- Interest Rates. The 10-year treasury yield ($TNX) is jumping today, up 12 basis points and back up to 4.32%. 4.35% is an area of short-term yield resistance. Small caps have tended to move opposite the short-term direction of the TNX, which is occurring today. Personally, I don't believe a rising TNX is a problem any longer, so long as we don't clear that 5% level. In fact, a rising TNX, along with short-term rate cuts in the fed funds rate should help regional banks' profits and profit growth considerably. Still, many market participants can only see what's happened in the short-term, with the inability to look further down the road. Until the TNX-IWM short-term inverse correlation continues, then we should be on guard for a possible 20-day EMA test on the IWM.
- Nonfarm payrolls. A super-hot jobs number on Friday could trigger a TNX breakout above 4.35% and a brief period of market selling. That's not what I consider to be likely, but it certainly is possible. On the other hand, should the report come out positive, but no stronger than expected, it plays right into the fed funds rate cuts later this year and I'd expect the market to applaud that type of report. Accordingly, I believe this upcoming economic report to be the absolute most important of the week.
- Sentiment. There's no change here, but I'll be watching it daily.
- Rotation. What's going to lead this week? We're now into April, which begins to favor some areas of growth historically. Do we see the QQQ rebound on a relative basis or will last week's leadership from transports and small caps continue? It'll certainly be interesting.
Feedback
If you'd like to share your thoughts on our Weekly Market Report, positive or negative, you can reach us at "[email protected]".
Happy trading!
Tom