
EB Weekly Market Report - Monday, April 8, 2024
Weekly Market Recap and Fab 5 Videos
I recorded two videos on YouTube.com on Sunday:
The Fab 5 is a test. I'd like to see reactions/comments before considering this as a fairly regular feature. Please consider leaving me a comment and be sure to "Like" the video and "Subscribe" to our YouTube channel, if you haven't already. Thanks!
ChartLists Updated
Several ChartLists were updated on Friday and will be updated on our website by tomorrow morning:
- Strong Earnings (SECL)
- Strong Future Earnings (SFECL)
- Raised Guidance (RGCL)
- Strong AD (SADCL)
- Bullish Trifecta (BTCL)
- Seasonality - April 2024
We also began keeping Upcoming Earnings ChartLists for Q1 earnings reports. Those daily Upcoming Earnings ChartLists, along with the Upcoming Earnings - Relative Strength ChartList can be found on our website.
Weekly Market Recap
Major Indices
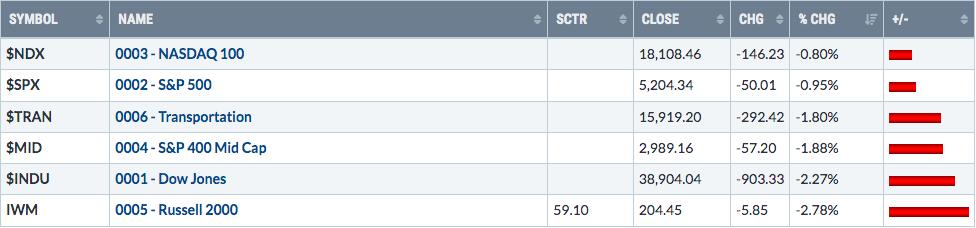
It was a down week across the board. It didn't start off that way and our major indices were enjoying gains until the Fed once again demonstrated that they are not capable of being transparent. Two weeks ago, the Fed announced that the fed funds rate was not changing, which was expected. It also indicated that we were still on track for 3 rate cuts in 2024. But on Thursday afternoon at 2pm ET, Minneapolis Fed President Neel Kashkari made a comment that there might not be any rate cuts in 2024 and THIS happened on the S&P 500:
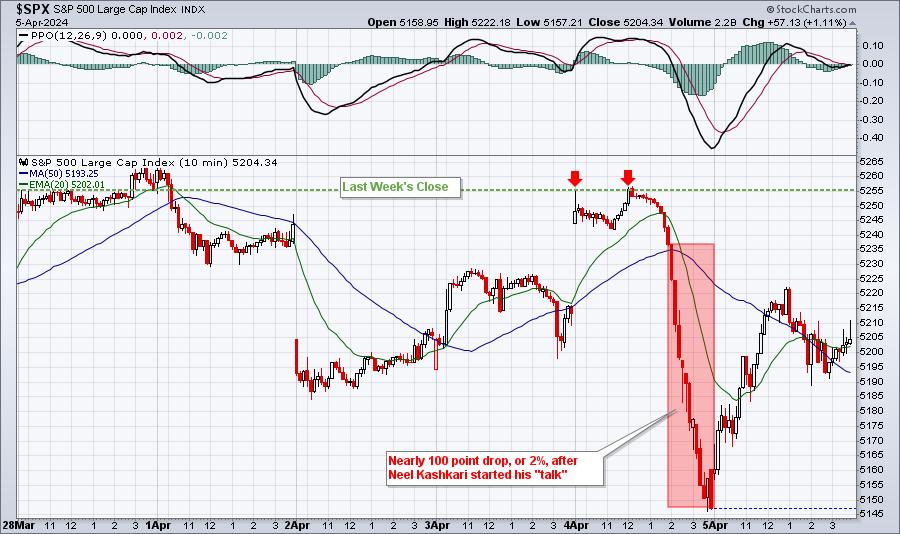
Thanks Neel! Is this the Fed transparency that Bernanke referred to during his term as Fed Chief? I don't know from month to month what the Fed is considering and I believe this LACK of transparency is leading to a lot of unnecessary uncertainty. Transparency should help to alleviate uncertainty, not increase it.
Sectors
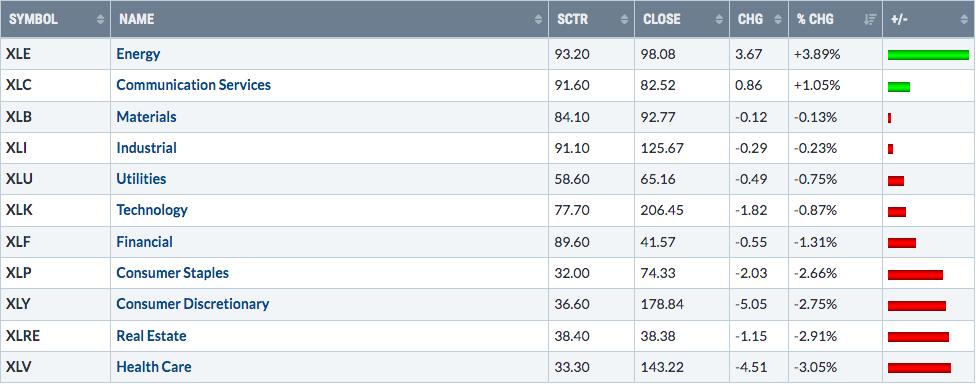
Energy remained very strong into April and it is the best-performing sector in April, according to the seasonality tool at StockCharts.com. When it's up, it tends to be up strong this time of year. Last week was no exception.
Top 10 Industries Last Week
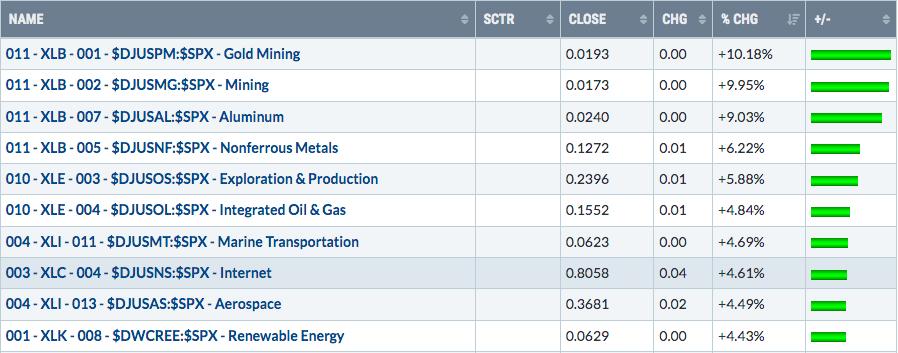
We're seeing nice follow through and a breakout today on renewable energy ($DWCREE):
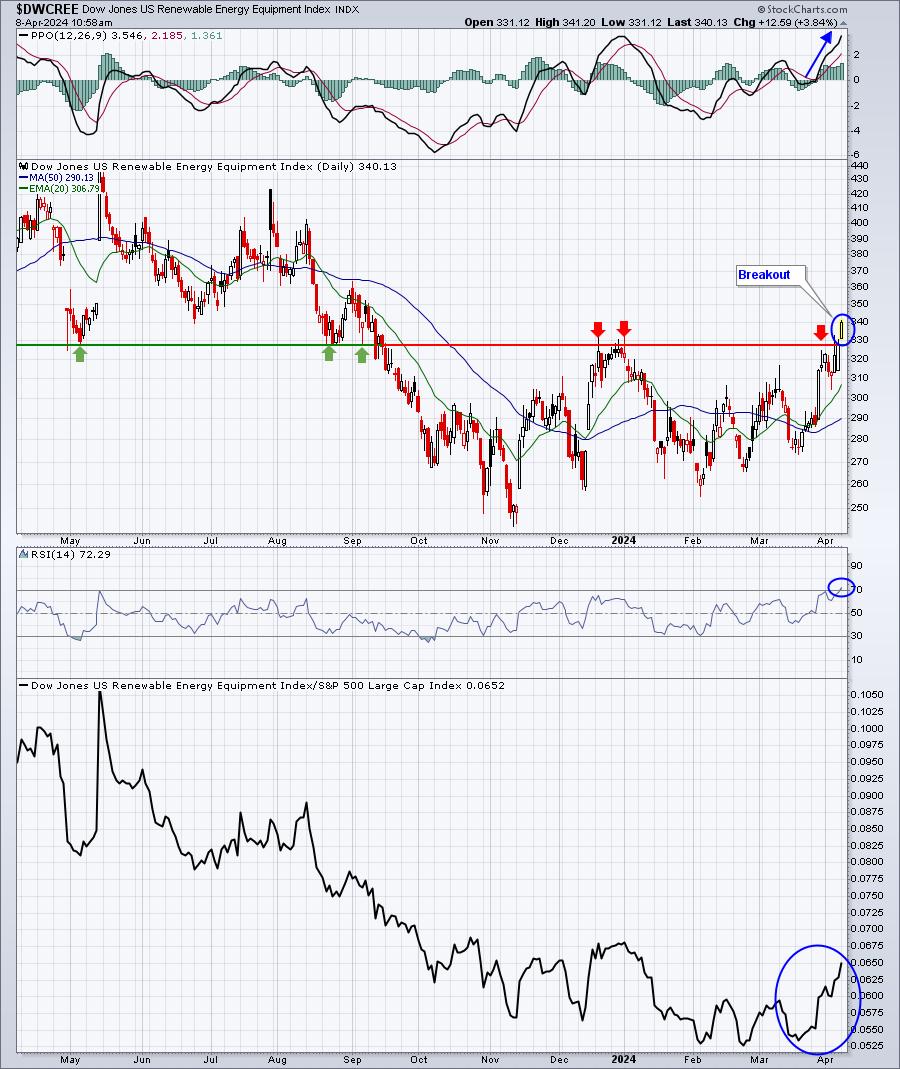
One important thing to keep in mind here. First Solar (FSLR) is a big part of this index and it is breaking out. Many other renewable energy stocks continue to lag. So be careful in terms of which individual stock you choose. Make sure it's participating in this latest rally in the DWCREE.
Bottom 10 Industries Last Week
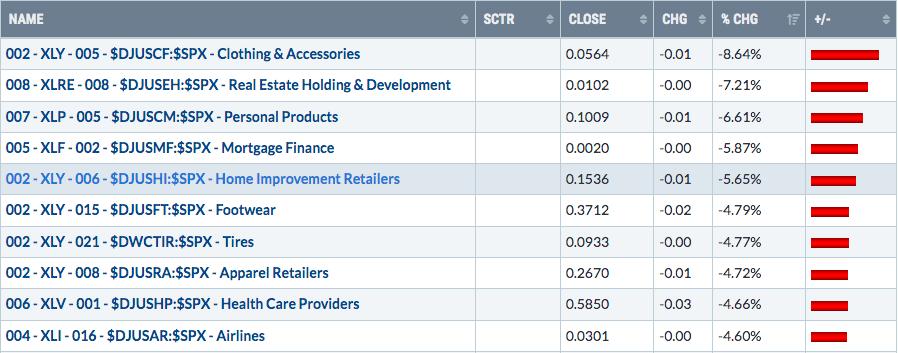
Among these "worst" industries of last week, I like the long setup most in the home improvement area ($DJUSHI):
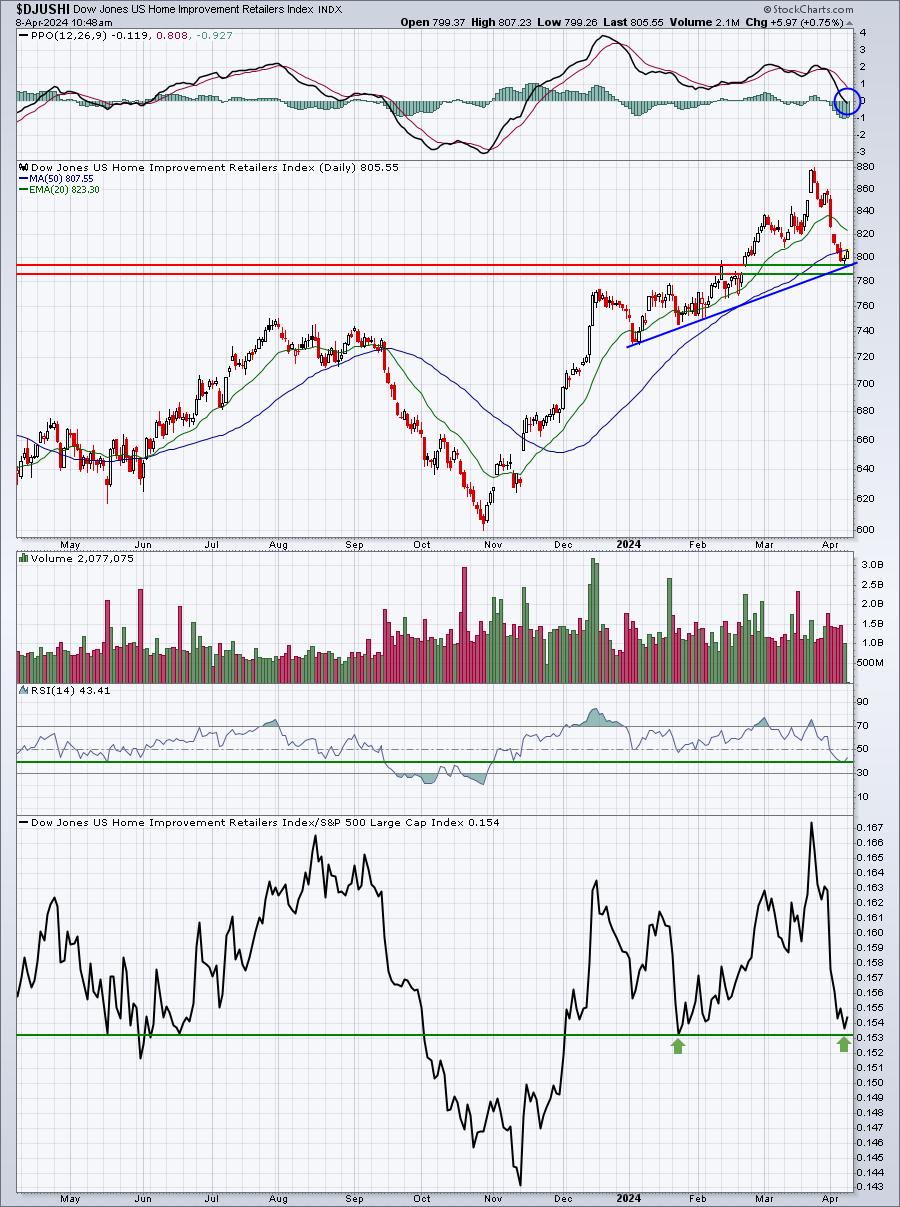
The timing of entry into this group couldn't be much better from a reward-to-risk perspective. The PPO is at centerline support. Price is turning up off of gap and trendline support. Relative support (bottom panel) is near as well. RSI just touched 40, which is key support during uptrends. If the DJUSHI were to close beneath 785, then I'd suggest caution. Otherwise, I'm looking for a rebound here. This brings stocks like Home Depot (HD) and Lowes Companies (LOW) into play. For what it's worth, LOW has been outperforming HD steadily over the past 8-10 weeks.
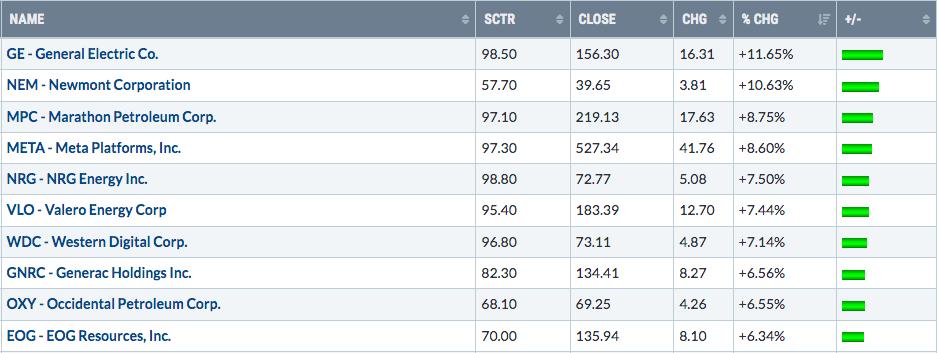
Top 10 Stocks - S&P 500/NASDAQ 100
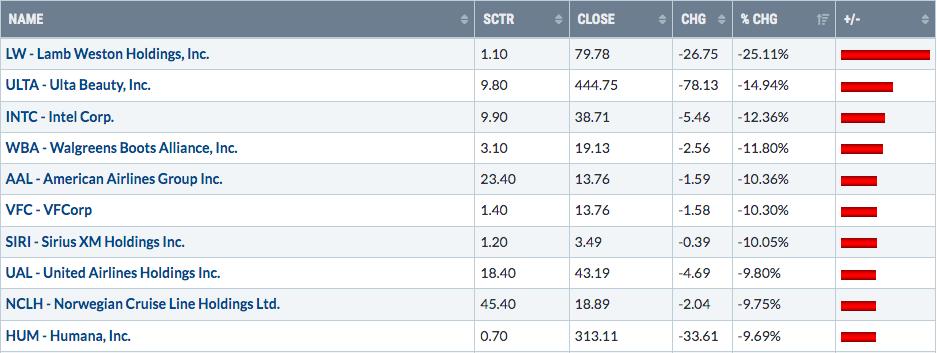
Bottom 10 Stocks - S&P 500/NASDAQ 100
Big Picture
To every bear in the universe, you really need to check out this 100-year Big Picture chart of the S&P 500 and then reconsider your bearish position:
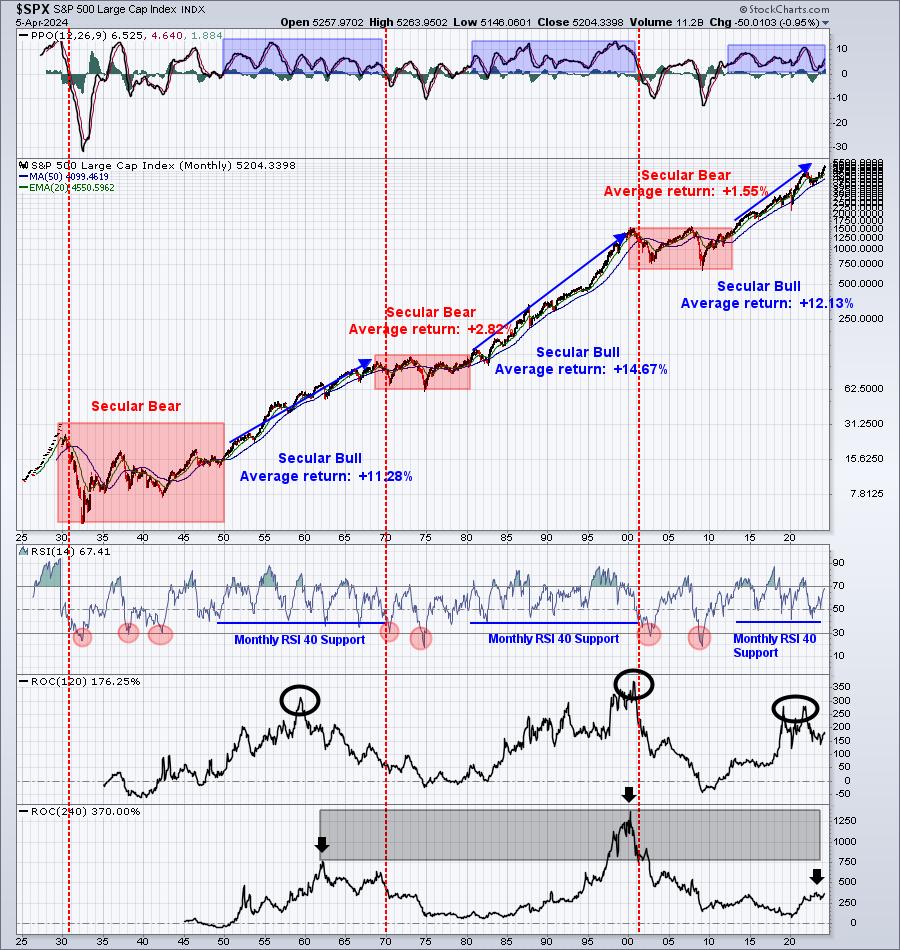
Opportunities to profit from short positions are much, much less often than the opportunities to profit from long positions. If you can't see that from this chart, I don't know that EarningsBeats.com is going to be able to help.
Sentiment
Once again, nothing much has changed with sentiment that we need to be aware of. The 5-day SMA of the equity only put call ratio ($CPCE) is squarely in neutral and the long-term 253-day SMA continues falling, supporting a further rise in U.S. equities in the weeks, months, and, perhaps, years ahead.
Rotation/Intermarket Analysis
Here's the latest look at our key intraday ratios as we follow where the money is traveling:
QQQ:SPY
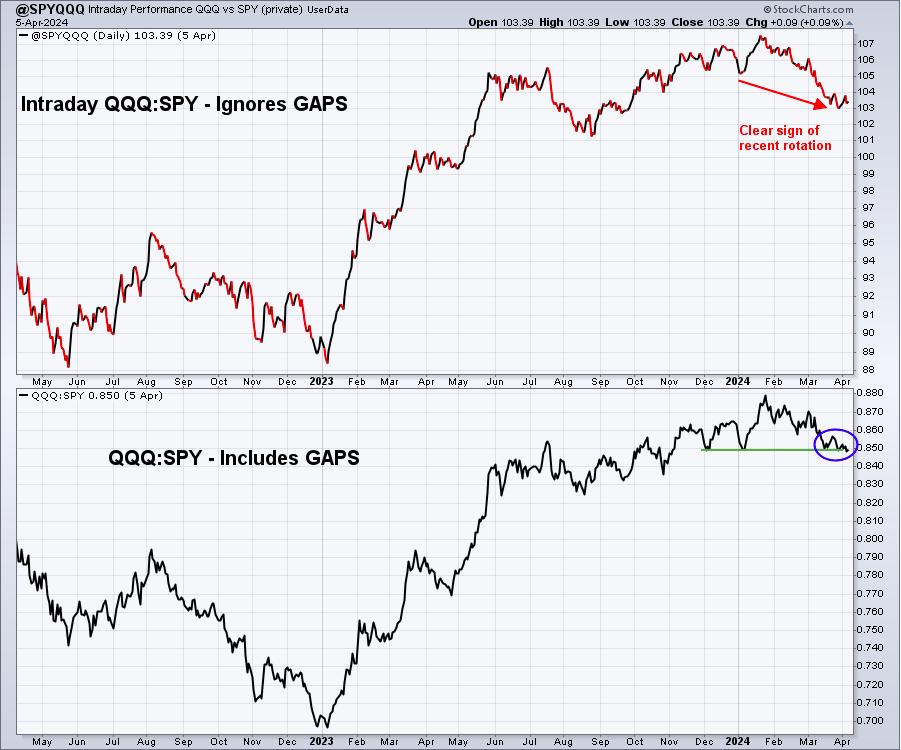
Intraday rotation may just be starting to turn higher, favoring the QQQ, but we're not there yet. I'd like to see this intraday ratio push past 104 for a couple days before making that call.
IWM:QQQ
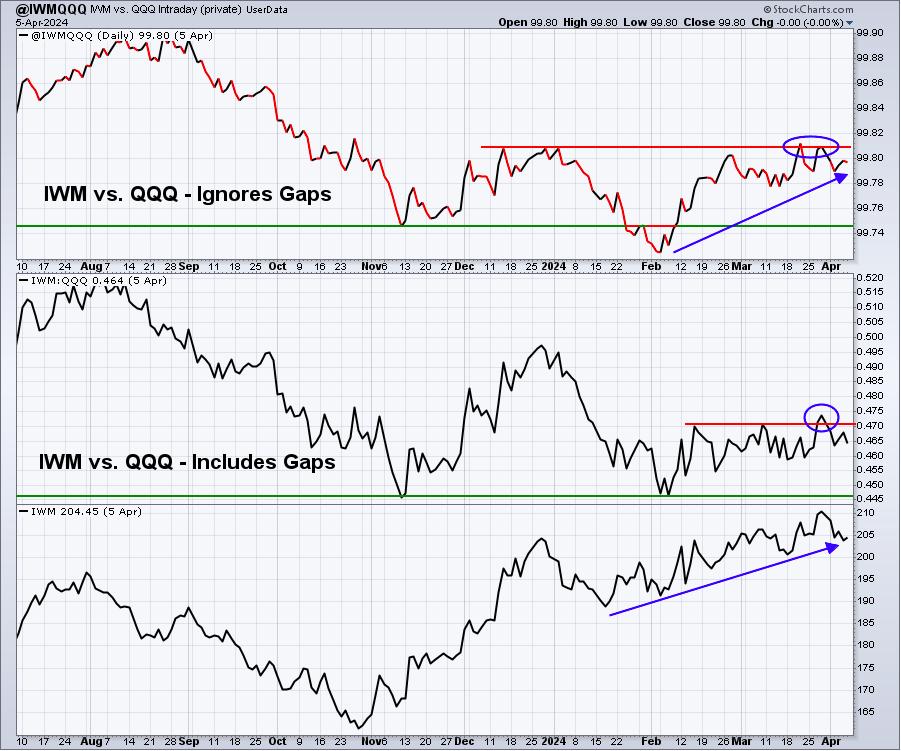
Intraday rotation from the large cap QQQ to the small cap IWM seems to still be gaining a bit of momentum. Clearly, however, a key top resides at 99.81. Let's see that breakout.
XLY:XLP
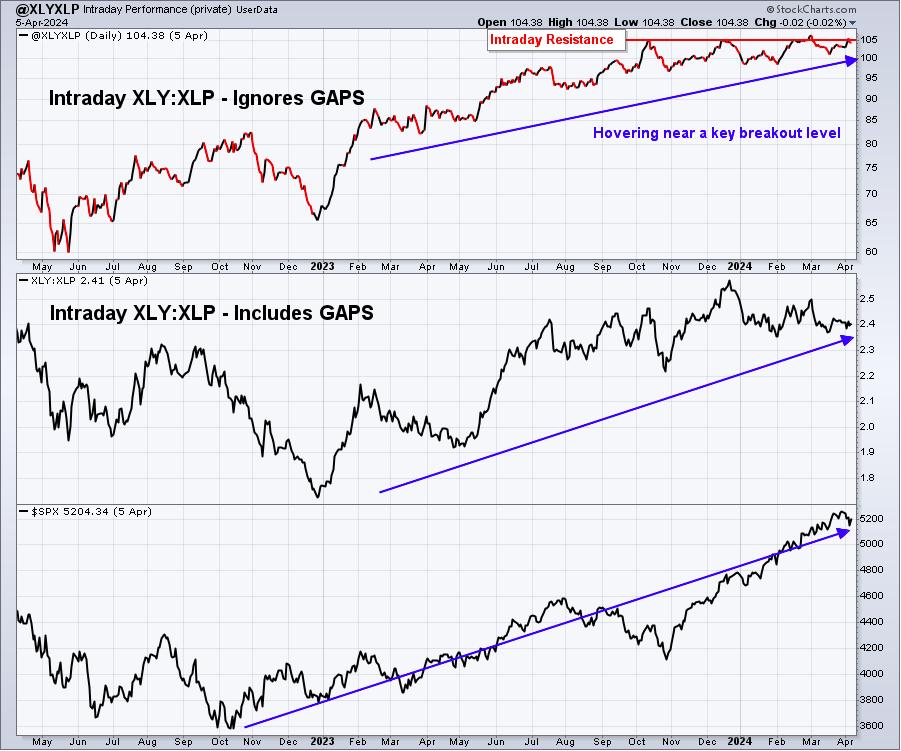
The ratios between discretionary (XLY) and staples (XLP) stocks seem to be diverging. Opening gaps are favoring the XLP, but intraday action remains on the side of XLY. If there's a side that the XLY wants to be on, it's the intraday side. Intraday action here, while consolidating for a few months now, still supports the bullish S&P 500 trend.
Key Sector/Industry Charts
We review these charts every day in our Daily Market Report, looking for key short-term breakouts, pullbacks to support, etc. This is different. We're looking here for sector and industry group charts that have done something longer-term to grab my attention. One industry group worth watching right now is the broadcasting & entertainment group ($DJUSBC). It recently broke to a 1-year high and has pulled back to approach its 20-week EMA for the first time. If it can hold and then the DJUSBC breaks out above the March high, a longer-term uptrend could be in play. Check this out:
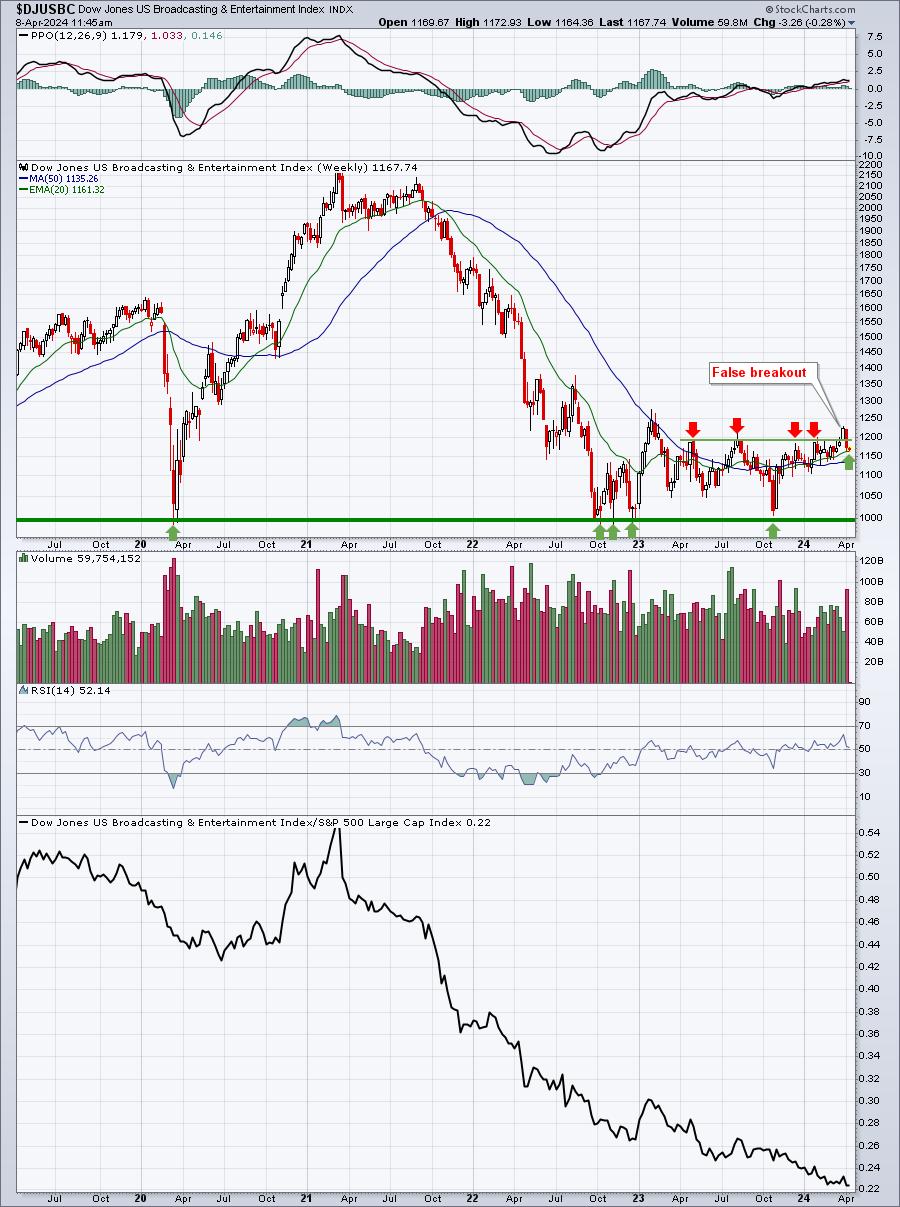
The bottom panel has yet to show any significant relative strength in the past 3 years. That could change if the DJUSBC can hang onto 20-week EMA support at 1161 and then clear 1225-1230 price resistance.
Industrial Metals
I believe there's a HUGE misinterpretation of industrial metals ($GYX) moving higher. Many market participants believe that higher prices result in higher inflation, which is simply not true. In fact, it's the movement LOWER in industrial metals that typically coincides with bearish action on the S&P 500. The prices of industrial metals demonstrate, to a large degree, the demand vs. supply picture. Heavier demand and rising industrial metals prices suggest a strengthening global economy. Check out this chart of the GYX and its POSITIVE correlation with the benchmark S&P 500:
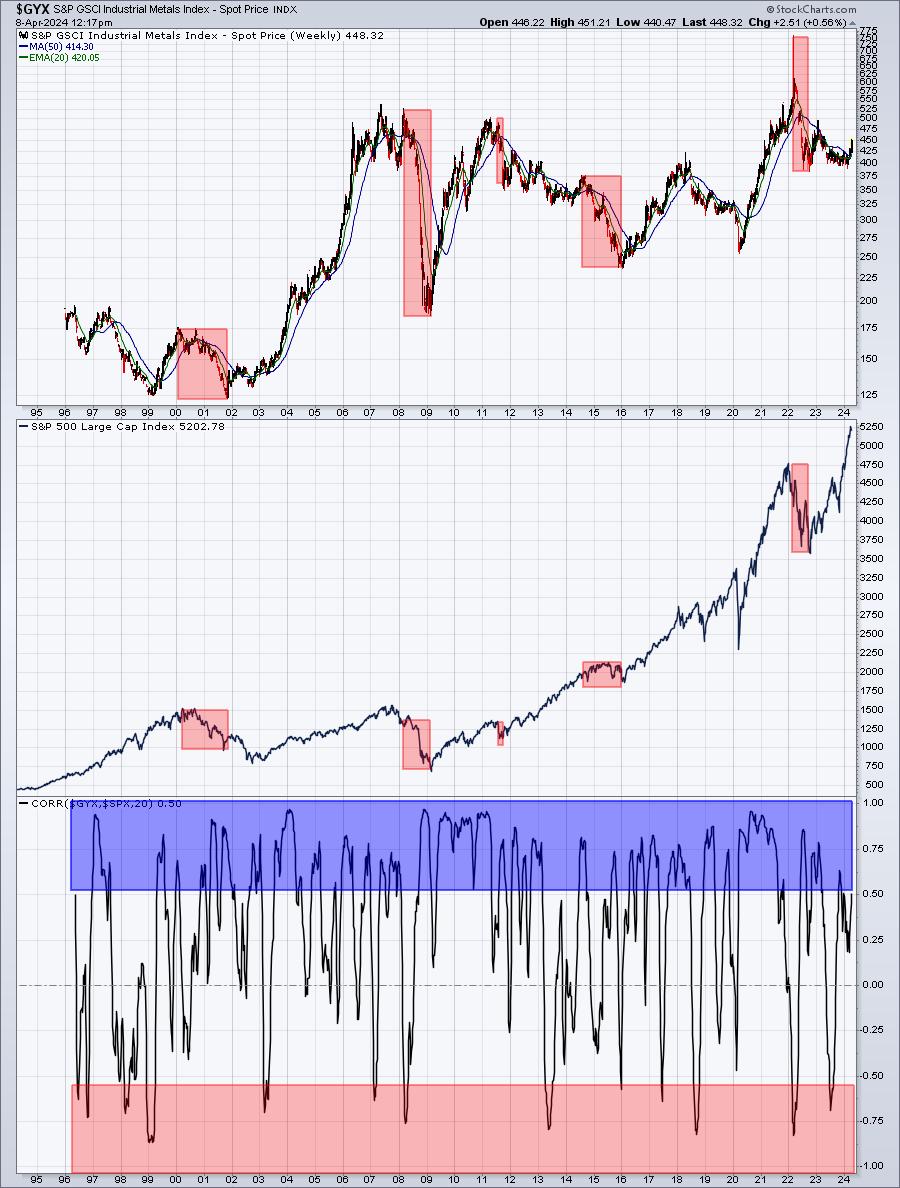
In the top two panels, I've highlighted several of the SWIFT declines in industrial metals prices and you can see they generally line up with weakness in the S&P 500. Lower prices reflect weakened demand, which impacts S&P 500 companies negatively. Higher prices suggest increasing demand, a common sense predictor of global economic strength. In the bottom panel, you can see that there is a TON more positive correlation between S&P 500 performance and industrial metals prices. Don't let the CNBC talking heads use recent increases in aluminum, steel, copper, etc. as reasons why inflation will be problematic long-term. We've seen PLENTY of examples before us where industrial metals prices rose, while inflation remained at or near the Fed's 2% target level.
Trade Setup
Since beginning this Weekly Market Report in early September, I've discussed the long-term trade candidates below that I really like. Generally, these stocks have excellent long-term track records and many pay nice dividends that mostly grow every year. Only in very specific cases (exceptions) would I consider a long-term entry into a stock that has a poor or limited long-term track record. I added my latest thoughts on all stocks I've suggested for the long-term, as of a week ago:
- JPM - up roughly 20% since adding in September 2023
- BA - bouncing off recent double bottom; been an underperformer, but I still love it long-term
- FFIV - currently in a bullish ascending triangle pattern, breakout would be close above 195
- MA - very steady uptrend; daily negative divergence suggests "possibility" of upcoming 50-day SMA test
- GS - expanding volume supported last week's breakout; strong performance since adding
- FDX - beautiful gap higher with earnings last week, but candle suspect; maybe a gap fill before moving higher
- AAPL - struggling in recent months, but AD line is strong; double bottom approaching near 165?
- CHRW - I'd guess a bottom is nearing as long-term uptrend line on monthly chart being tested now
- JBHT - down vs. its peers over past two months, but I'd expect 188 support to hold
- STX - chart here remains quite bullish
- HSY - was a bottom-fishing play and the jury is still out on that; love the long-term chart though
- DIS - big earnings gap higher in February now appears to be bullish difference maker
- MSCI - still hanging near earnings-related gap support
- SBUX - 88-90 is excellent price support on its chart; relative strength is lacking for now
- KRE - a bet on small and regional banks, holding steady for now
- ED - tends to perform well in any market; won't be a big winner, but will be a steady income provider
- AJG - after adding AJG, it promptly dropped to successfully test its rising 20-week EMA
Keep in mind that our Weekly Market Reports favor those more interested in the long-term market picture. Therefore, the list of stocks above are stocks that we believe are safer (but nothing is ever 100% safe) to own with the long-term in mind. Nearly everything else we do at EarningsBeats.com favors short-term momentum trading, so I wanted to provide an explanation of what we're doing with this list. I continue to search for more companies to add to this long-term buy and hold list, but don't have any for this week.
Looking Ahead
Upcoming Earnings:
Q1 earnings will begin in just 2 weeks. This week, however, earnings are limited. I've identified what I believe are key companies that will report this week, with their respective market caps in parenthesis. This is NOT a list of ALL companies reporting this week, so please be sure to check for earnings of any companies that you own or add. Any companies in BOLD represent stocks in one of our Portfolios:
- Monday: None
- Tuesday: None
- Wednesday: DAL ($30 billion)
- Thursday: STZ ($49 billion), FAST ($44 billion)
- Friday: JPM ($571 billion), WFC ($202 billion), PGR ($123 billion), C ($118 billion)
Key Economic Reports:
- Monday: None
- Tuesday: None
- Wednesday: March CPI, February wholesale inventories, FOMC minutes
- Thursday: Initial jobless claims, March PPI
- Friday: April consumer sentiment
Historical Data
I'm a true stock market historian. I am absolutely PASSIONATE about studying stock market history to provide us more clues about likely stock market direction and potential sectors/industries/stocks to trade. While I don't use history as a primary indicator, I'm always very aware of it as a secondary indicator. I love it when history lines up with my technical signals, providing me much more confidence to make particular trades.
Below you'll find the next two weeks of historical data and tendencies across the 3 key indices that I follow most closely:
S&P 500 (since 1950)
- April 8: +64.12%
- April 9: +60.84%
- April 10: +53.11%
- April 11: -33.50%
- April 12: +72.70%
- April 13: -21.35%
- April 14: -1.74%
- April 15: +43.26%
- April 16: +63.12%
- April 17: +90.31%
- April 18: +40.61%
- April 19: -23.31%
- April 20: -31.69%
- April 21: +37.15%
NASDAQ (since 1971)
- April 8: +45.65%
- April 9: +59.99%
- April 10: +55.36%
- April 11: -63.62%
- April 12: +44.73%
- April 13: -0.08%
- April 14: -63.47%
- April 15: +21.17%
- April 16: +96.29%
- April 17: +98.90%
- April 18: +121.03%
- April 19: -24.84%
- April 20: -48.16%
- April 21: +60.62%
Russell 2000 (since 1987)
- April 8: +57.00%
- April 9: +139.64%
- April 10: +34.40%
- April 11: -90.58%
- April 12: +64.76%
- April 13: -37.09%
- April 14: -79.71%
- April 15: -36.41%
- April 16: +124.79%
- April 17: +98.28%
- April 18: +102.72%
- April 19: +1.25%
- April 20: -104.74%
- April 21: +102.52%
The S&P 500 data dates back to 1950, while the NASDAQ and Russell 2000 information date back to 1971 and 1987, respectively.
From our April Seasonality Report, here's how April historically breaks down on the benchmark S&P 500 (annualized returns):
- April 1-18: +31.39%
- April 19-24: -8.77%
- April 25-30: +10.55%
Final Thoughts
The Fed injected a bit of fear into the stock market last week as the Volatility Index ($VIX) nearly touched 17 after ending the prior week at 13. It is down today to roughly 15.50, but will likely have a big move this week, given key inflation data that will be out.
Here are several things to consider in the week ahead:
- Earnings. Banks will kick it off on Friday as JPM, WFC and C all report before the opening bell.
- Inflation. The March CPI and PPI reports will be out on Wednesday and Thursday, respectively. Expect volatility. Core CPI and Core PPI are projected to come in at +0.3% and +0.2%, respectively. I believe these reports will be well received at those levels or below. If we see a hotter-than-expected number released, especially the Core CPI, last week's selling could escalate with the VIX elevated.
- Technology (XLK). Seasonally, the XLK tends to perform close to the benchmark S&P 500. However, software ($DJUSSW) normally shows relative strength while semiconductors ($DJUSSC) lag.
- Interest Rates. The inflation data will impact the bond market just as much, if not more, than it impacts the stock market. The selling of bonds, sending the 10-year treasury yield ($TNX) higher is what most stock market participants would rather not see.
- Tesla (TSLA). Was Friday's low a double bottom? TSLA is gaining ground today and reports its quarterly results two weeks from tomorrow (April 23rd). TSLA's worst 3 months historically is from February 15th to May 15th and that's exactly where we are now. The good news for TSLA fans is that once we move past May 15th, TSLA has a history of excellent relative strength, posting an annualized return of 152.94% from May 15th through June 30th.
Feedback
If you'd like to share your thoughts on our Weekly Market Report, positive or negative, you can reach us at "[email protected]".
Happy trading!
Tom