
EB Weekly Market Report - Monday, April 15, 2024
ChartLists Updated
Several ChartLists were updated on Friday and will be updated on our website by tomorrow morning:
- Strong Earnings (SECL)
- Strong Future Earnings (SFECL)
- Raised Guidance (RGCL)
- Short Squeeze (SSCL)
- Bullish Trifecta (BTCL)
We've also updated the Upcoming Earnings ChartLists for companies reporting Q1 earnings this week. Those daily Upcoming Earnings ChartLists, along with the Upcoming Earnings - Relative Strength ChartList can be found on our website.
Weekly Market Recap
Major Indices
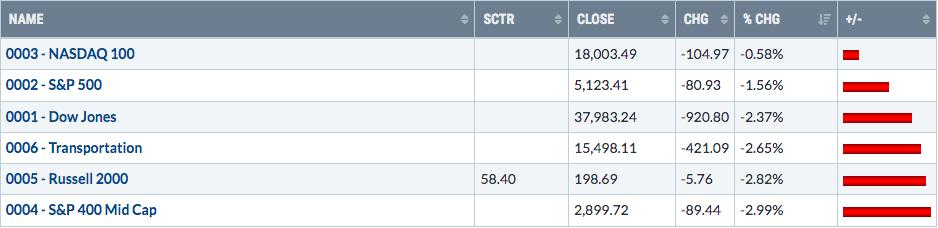
It was a difficult week for U.S. equities, but the silver lining was the relative strength of the NASDAQ 100. While many were viewing the hot CPI report on Wednesday as a signal that inflation could be accelerating, the primary growth index - the NASDAQ 100 ($NDX) - showed leadership. When inflation is a problem or about to get worse, growth stocks get CRUSHED. They don't lead. The fact that Wall Street gravitated towards those growth names is a signal to me that remaining on the bullish side is the preferred approach. Let's take a quick look back at recent history to see what happened to the NDX the last time the annual rate of Core CPI was accelerating higher:
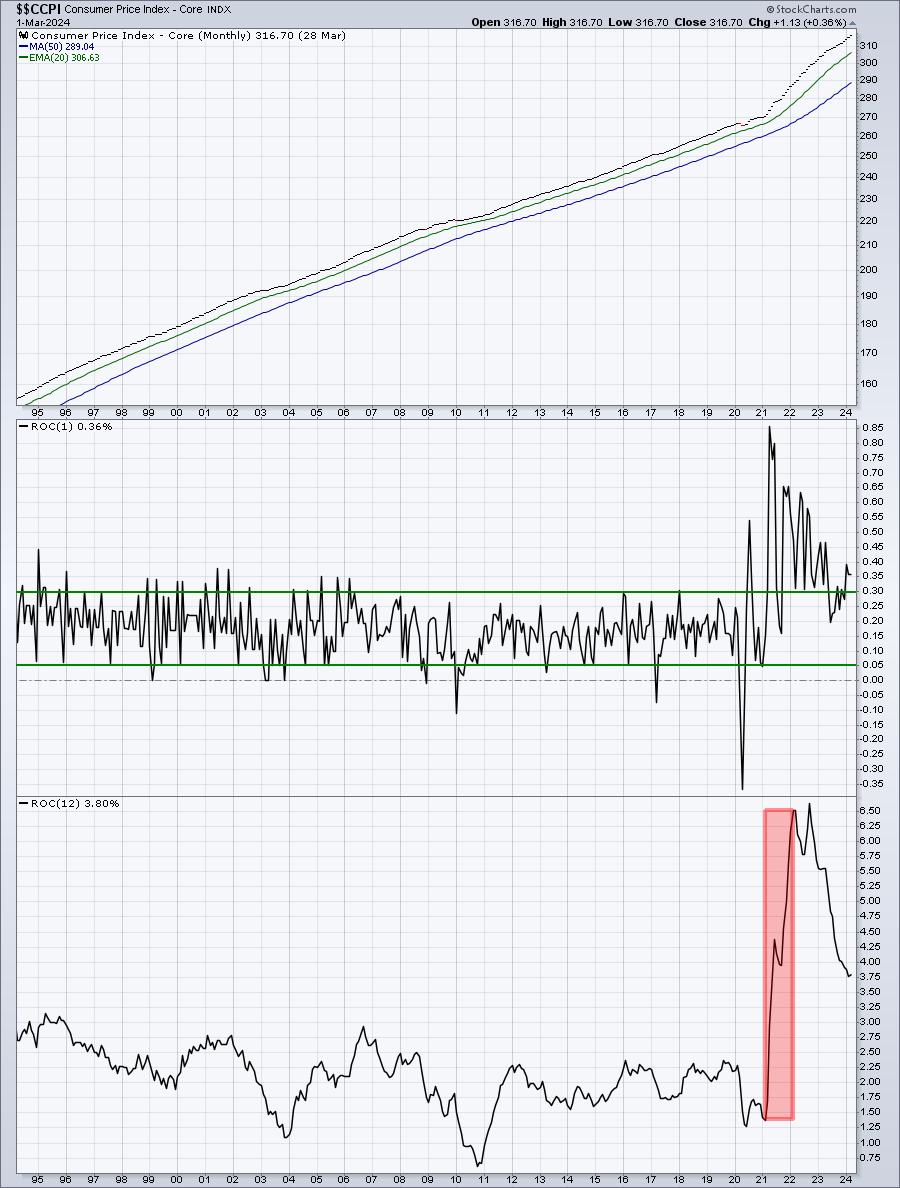
What happened to the NDX during that initial burst in Core CPI from February to April 2021?
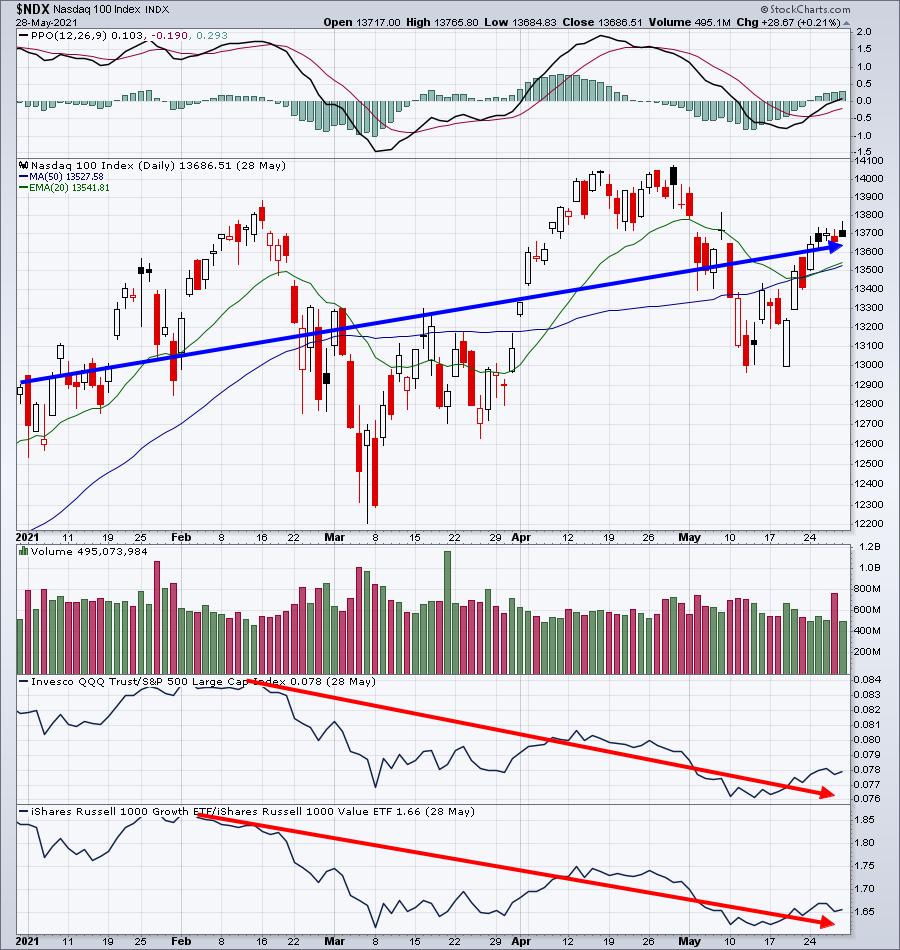
The NASDAQ went higher, but growth trailed value (QQQ:SPY and IWF:IWD) badly. Last week, we get the hot CPI data and here's how growth did relative to value:
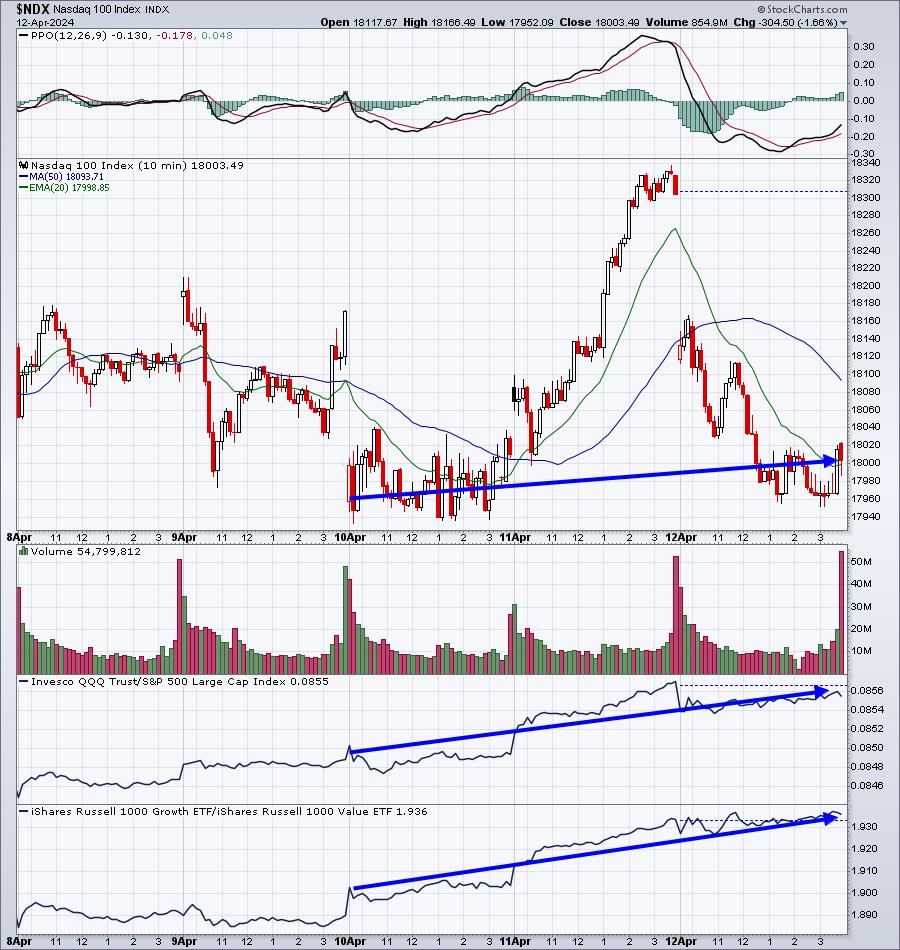
Is the market acting like inflation is going to be a problem? After the initial gap lower with that Core CPI reading, the NDX and both growth vs. value ratios trended higher for 3 days. Let the media have fun with all their negativity. The market action since that hot CPI report does not spell trouble ahead. A pullback? Certainly a possibility. A correction or bear market? Highly doubtful.
Sectors
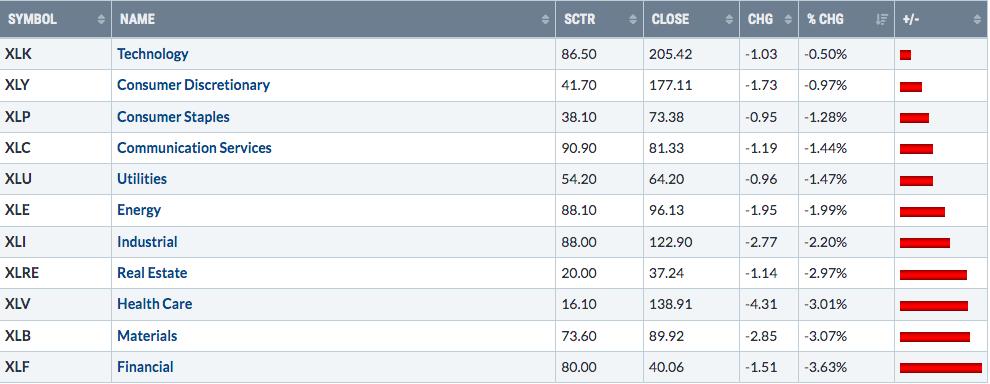
Technology, consumer discretionary, and communication services are in the top 4 sectors for the week and I'm supposed to believe that a slightly-higher-than-expected CPI report is going to send the stock market tumbling? I don't think so.
Top 10 Industries Last Week
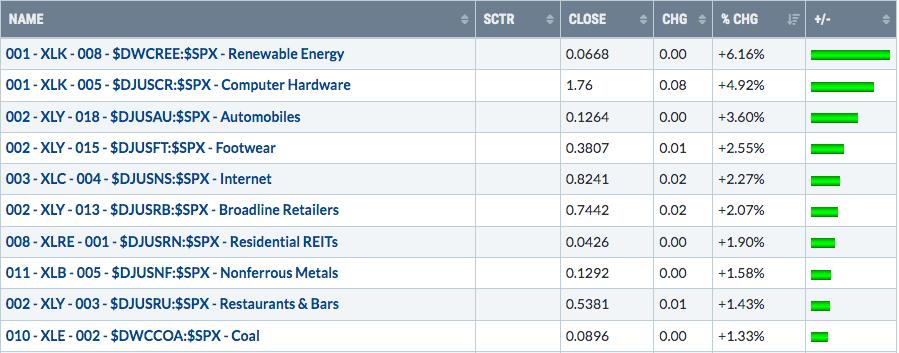
Just take a minute and review the 6 best industry groups last week. Those 6 groups should have been KILLED in an inflation-fearing environment. What you saw on CNBC and what you see in the price action is completely different. I'm sure CNBC had all of its bearish analysts on last week, telling everyone the inflation story, the higher interest rate story, the upcoming bear market story, blah, blah, blah. But this one chart above tells me everything I need to know. Those are 6 growth industries that saw money rotating IN, not OUT. And this is the REAL story.
Seriously, were any CNBC guests talking about where the money was flowing AFTER the hot CPI report? Did any of them care to explain why growth stocks saw the biggest gains last week?
Bottom 10 Industries Last Week
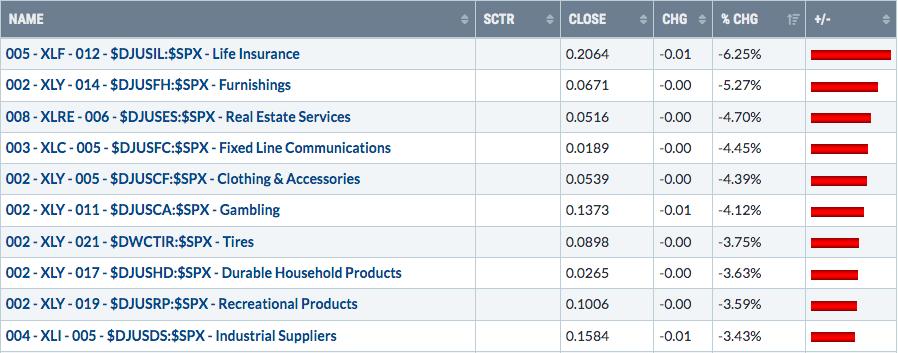
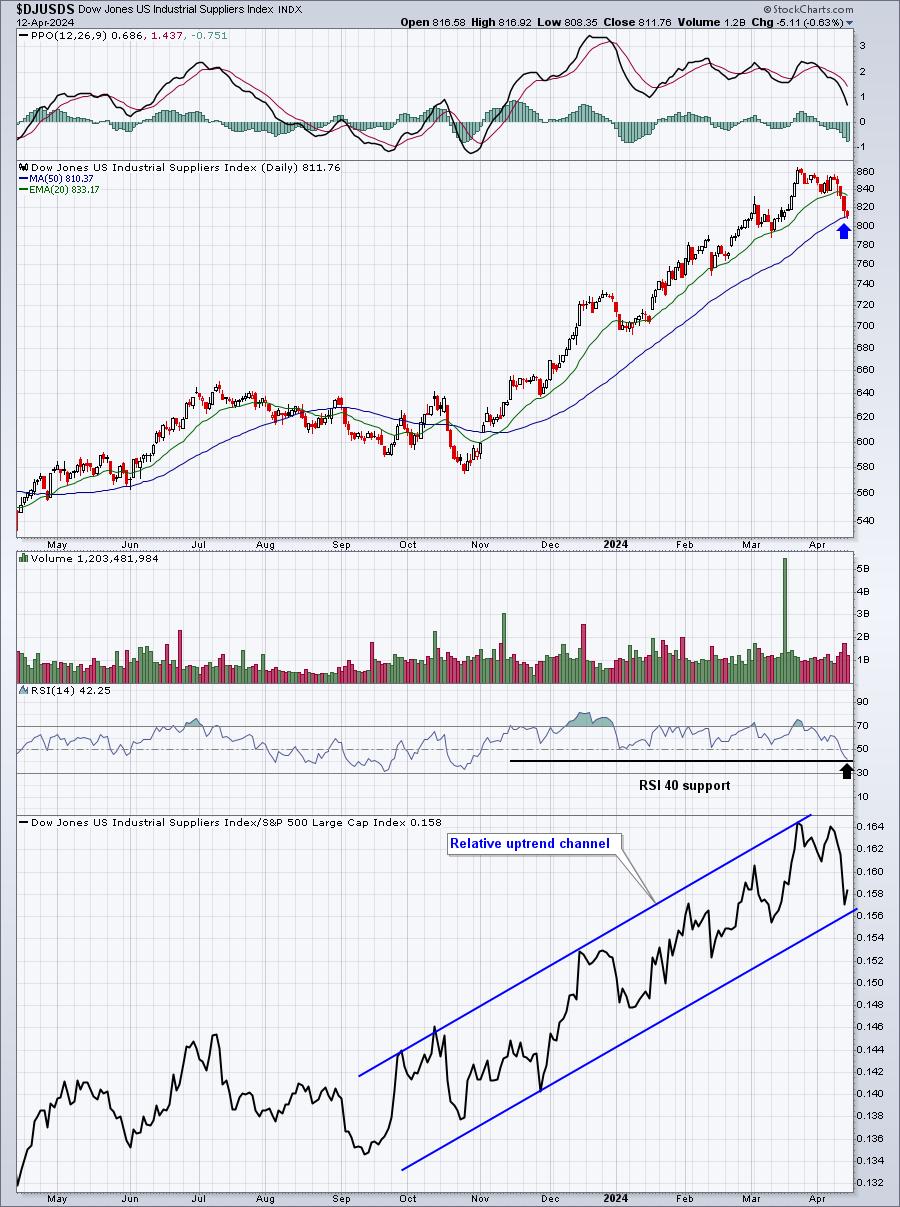
I normally provide a chart of a weak industry group that's actually testing a key support level or moving average. This week was difficult, because it appeared these groups were all breaking down. The last one, however, tested its 50-day SMA for the first time since breaking above it last November. Check out industrial suppliers:
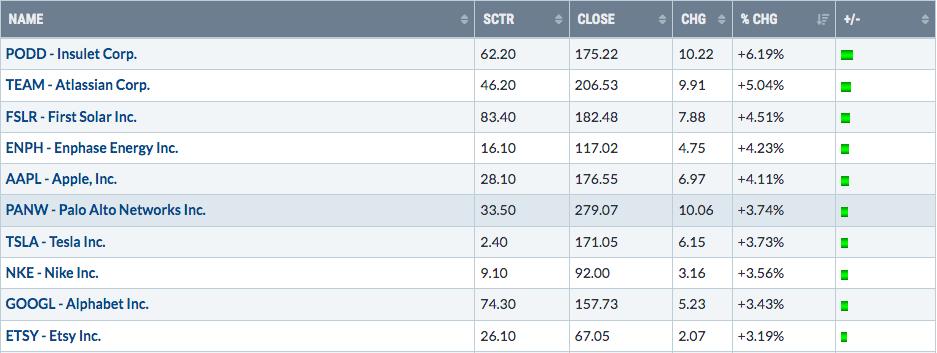
Top 10 Stocks - S&P 500/NASDAQ 100
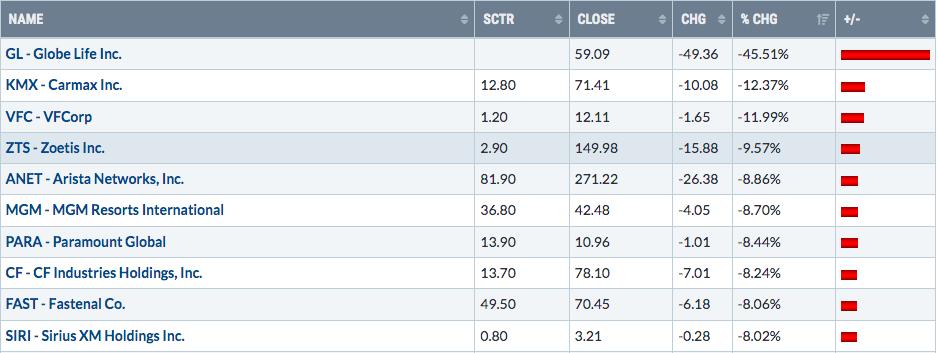
Bottom 10 Stocks - S&P 500/NASDAQ 100
Big Picture
We saw some selling last week and we could see some more in the week ahead. But, if you're a longer-term investor, just understand that my signals say to remain long. I would not try to get cute and time weakness. Long-term investors need to remember why they're long-term investors. : )
It gets dicey from time to time, but have another look at this Big Picture chart below:
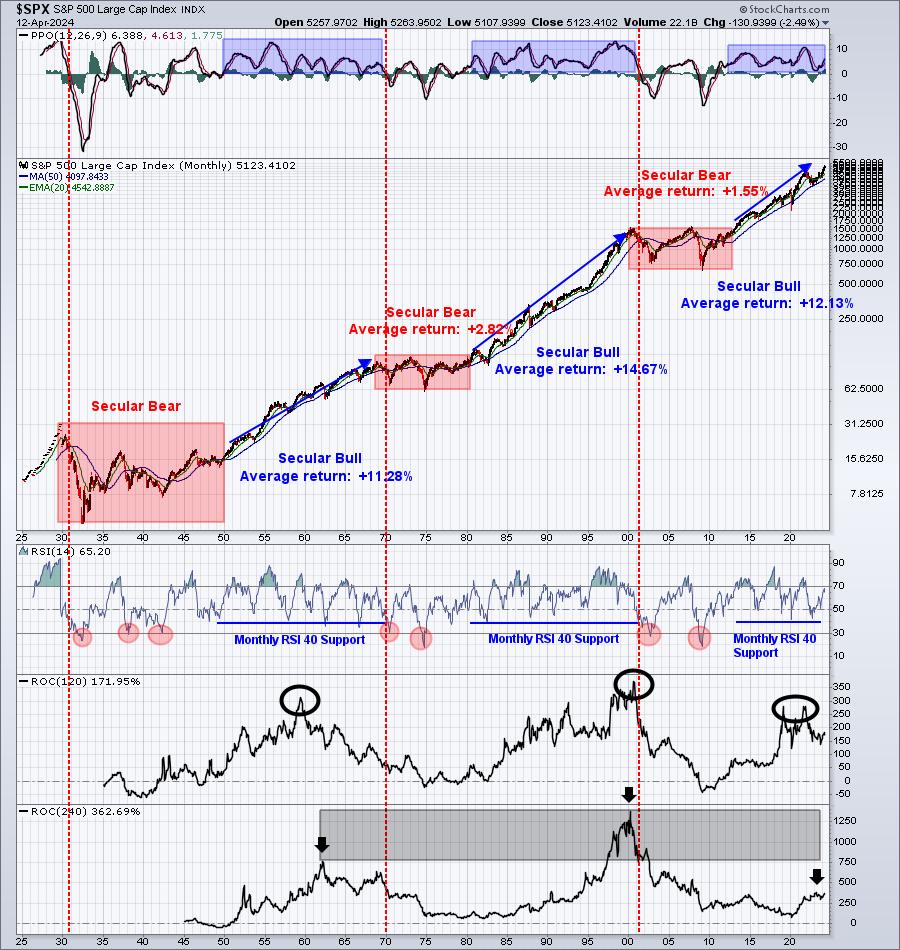
Historically, when the monthly PPO is accelerating higher and price action is at or near all-time highs, it's unusual to see a big decline in the S&P 500. I know that much of the media and many technicians turn bearish at any move to the downside, but history tells us that's not the prudent approach.
Sentiment
Well, here's a quick look at my "speed boat" sentiment indicator, the 5-day SMA of the equity only put call ratio ($CPCE):
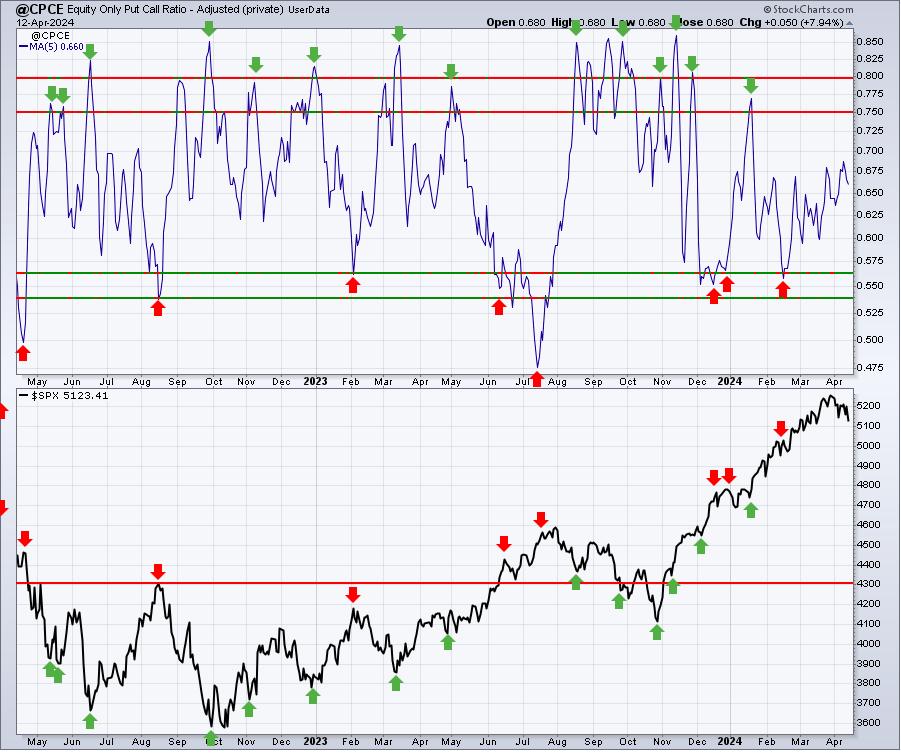
While we've seen what could be an important short-term top, the CPCE is not showing the usual extreme complacency readings that help us to identify short-term tops. It's okay, because not every top is accompanied by such an extreme complacency reading. If anything, this confirms that market participants remain overly bearish, despite the beautiful advance we've seen since the October 2023 low. This should be viewed as potential additional fuel for our next rally.
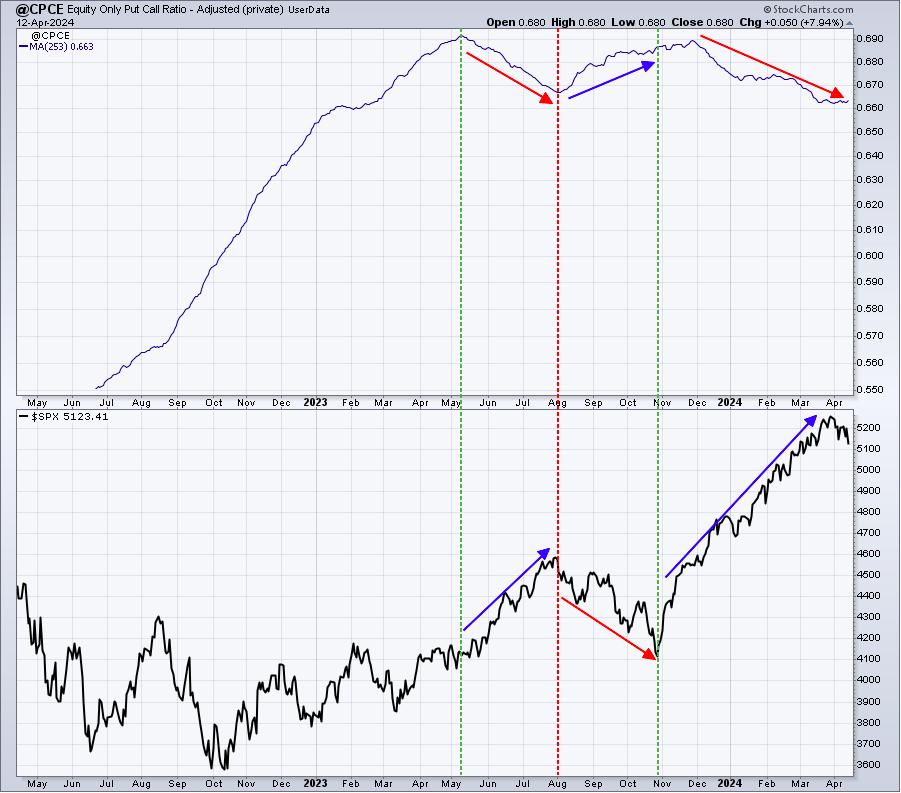
And the long-term 253-day SMA of the CPCE couldn't be much more favorable for stocks. The rollover from a significant top has occurred and this reading is in steady decline mode, which historically accompanies HUGE secular bull market advances. Check out the latest look:
Rotation/Intermarket Analysis
Here's the latest look at our key intraday ratios as we follow where the money is traveling:
QQQ:SPY
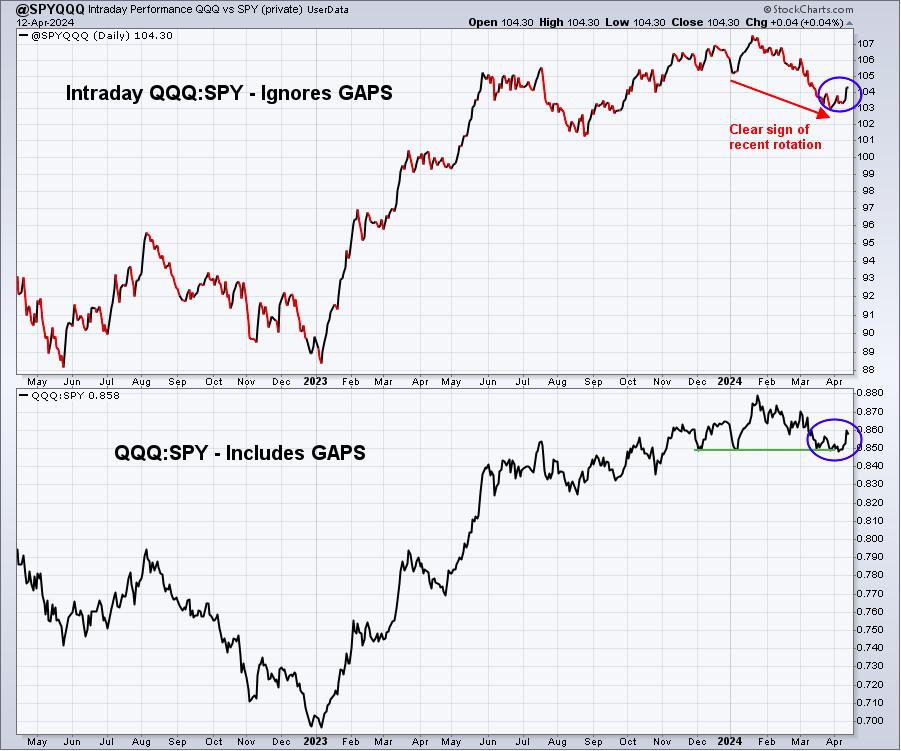
Last week's comment: "Intraday rotation may just be starting to turn higher, favoring the QQQ, but we're not there yet. I'd like to see this intraday ratio push past 104 for a couple days before making that call."
Well, we moved through 104 and this rotation back to the QQQ vs. the SPY appears to be underway. The large institutions are favoring technology names now, despite the media's rant about higher inflation.
IWM:QQQ
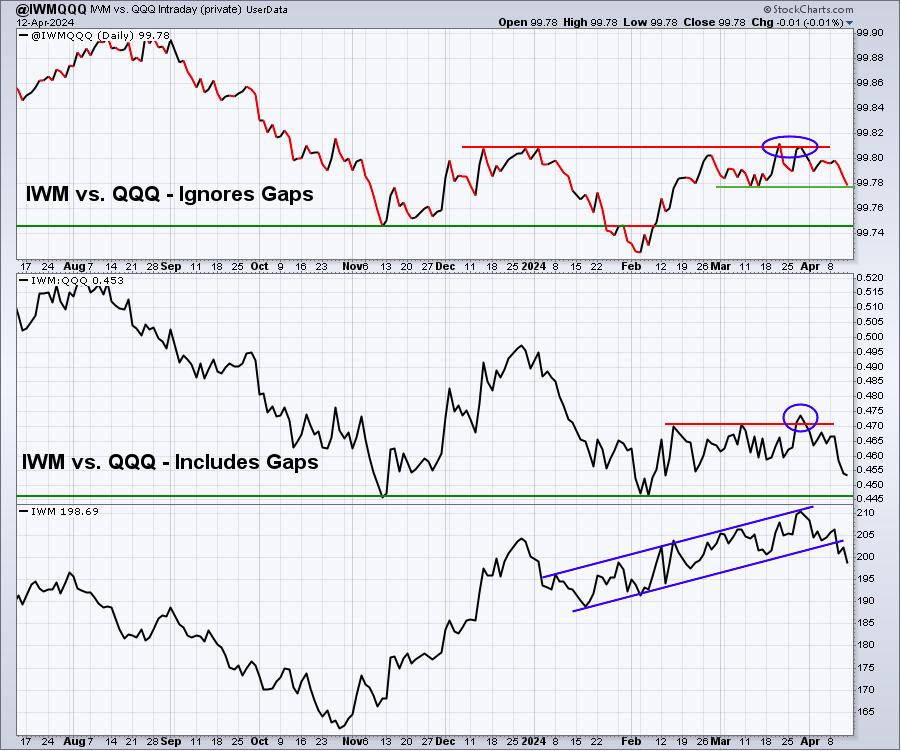
Small caps fell OUT of favor last week. Part of my belief that the IWM will outperform the QQQ in 2024 stems from my view that interest rates will be cut this year, aiding not only small banks, but small stocks in general. These stocks are much more dependent on availability of capital. Many small companies cannot file for secondary offerings to raise more capital as their own depressed prices would require massive dilution. A much better option for them is to benefit from lower rates to potentially borrow to grow their businesses, then raise money from a secondary offering later, after their share prices have recovered.
I still believe in these stocks to outperform, but I feel this asset class needs to see rate cuts by the Fed. The general market feeling is that these rate cuts will get pushed further down the road, with some even saying the next Fed move will be to hike rates - something I completely disagree with.
XLY:XLP
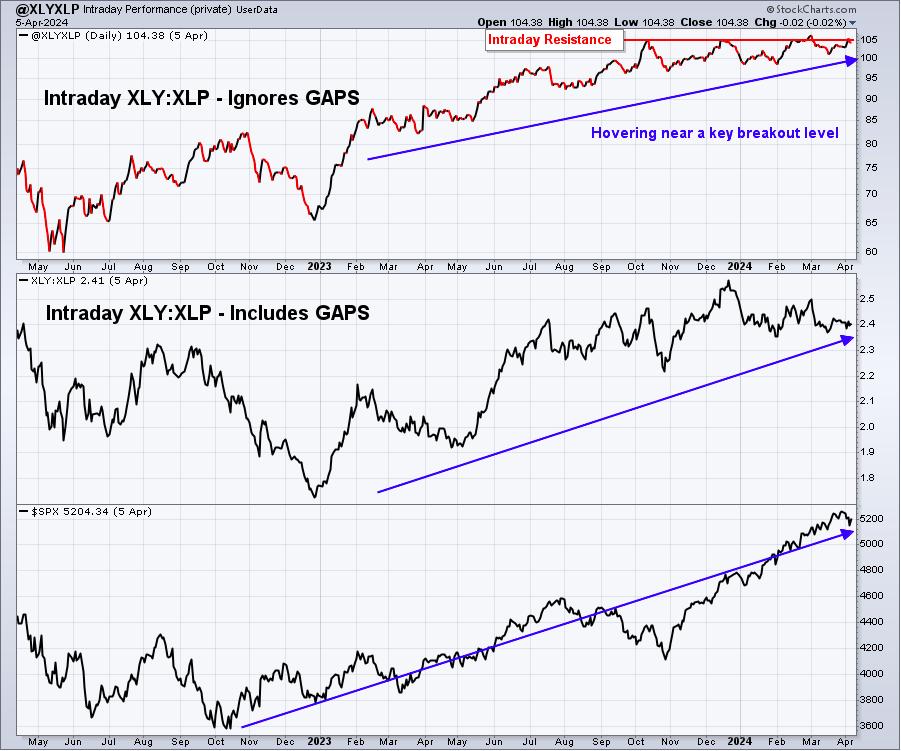
The INTRADAY XLY:XLP ratio keeps pounding its head against the ceiling, trying to break through to new highs. A true inflationary environment would have Wall Street running for the XLY exit. We would see the XLY:XLP ratio dropping like a rock. When inflation began to surge in early 2021, check out how this ratio performed:
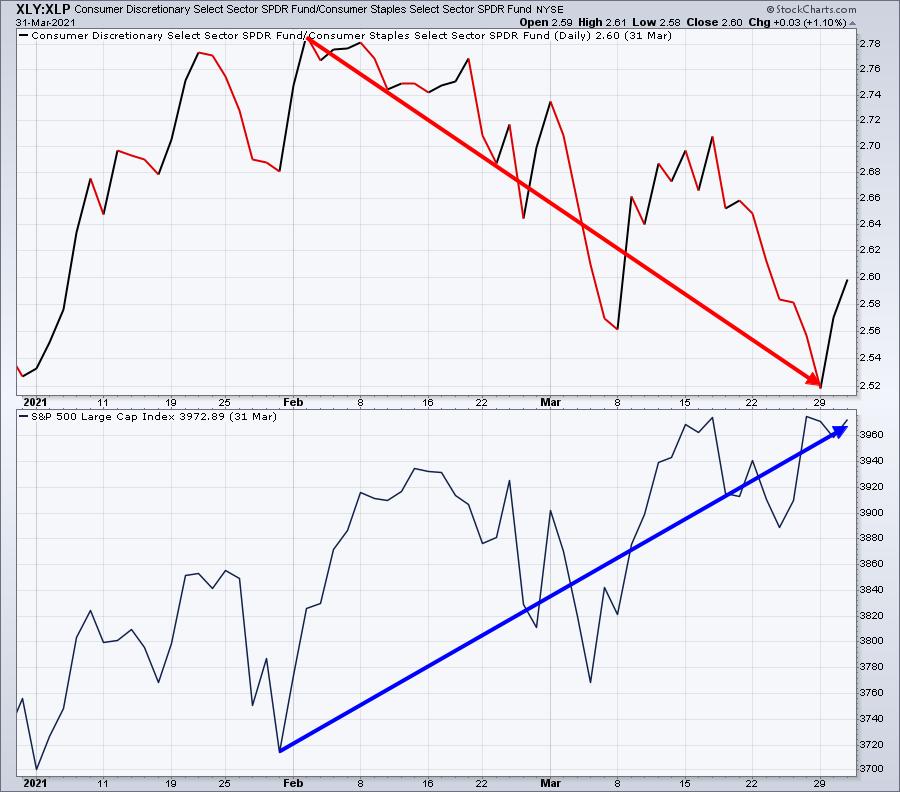
The S&P 500 actually rose due to rotation into value areas of the market, while the XLY:XLP ratio tumbled. That is NOT what's happening now. I remember that period VERY well, because we had drafted 3 portfolios (Model, Aggressive, and Income that had lots of growth stocks in it and we were crushed). Growth stocks DO NOT perform well when inflation is a big concern.
The XLY:XLP ratio is trying to break out right now. Does it appear to you that Wall Street is prepping for an inflation-induced market armageddon? Don't fall for the media hype.
Listen, maybe things do take a turn for the worse. I'm not perma-bull, despite what many think. But I'm not going to scream "FIRE!!!!" in a crowded theatre when someone turns on a flashlight.
Key Sector/Industry Charts
Energy (XLE) has been on fire in 2024. Here's the sector performance year-to-date:
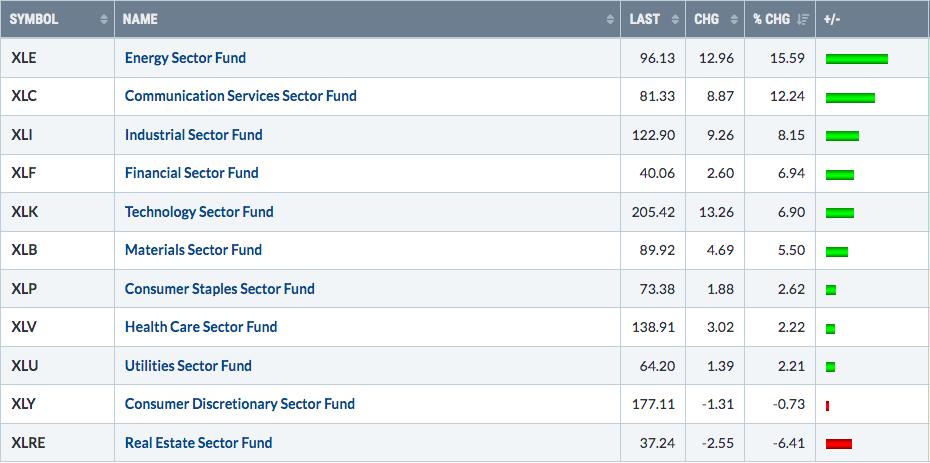
But in this section of the Weekly Market Report, I like to dissect sectors from a long-term perspective. Right now, energy is doing what it normally does in April:
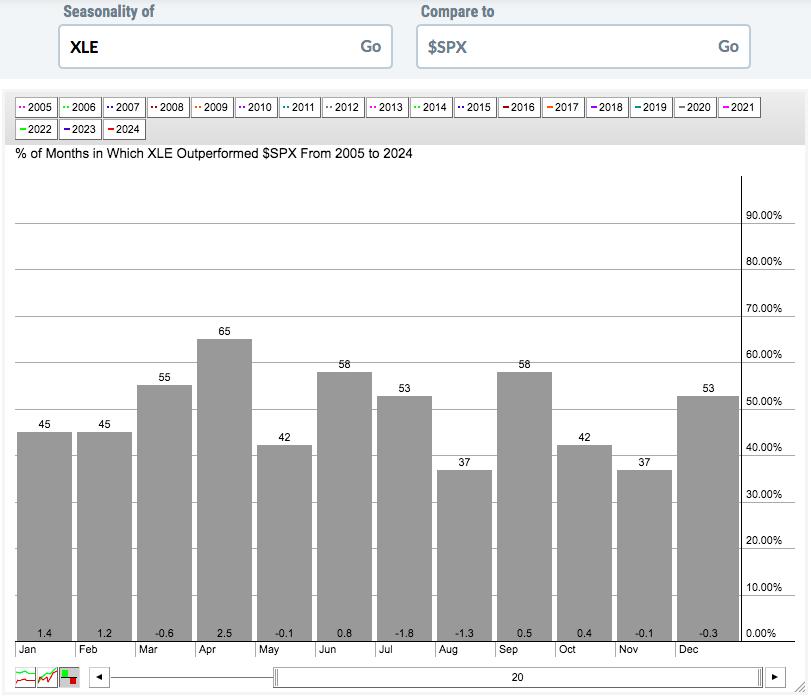
The XLE outperforms the S&P 500 most often during April. That's what that gray bar tells us. Also, at the bottom of each bar is that calendar's month average outperformance vs. the benchmark. Note that for the XLE, April's average outperformance over the past 20 years is 2.5 percentage points, more than 1 percentage point higher than any other month.
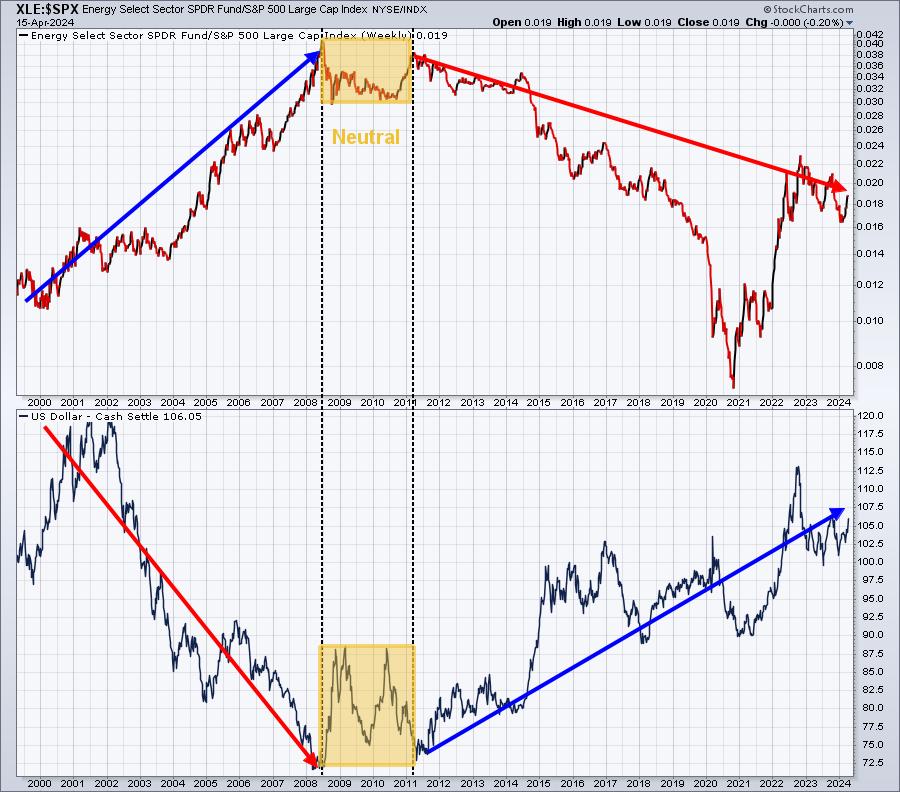
What I'm saying is do not get caught up in the XLE hype right now, because here's the long-term track record. Energy has a history of underperforming the S&P 500 in the long-term when the dollar ($USD) is rising. There's nothing wrong with trading the XLE in the short-term when it rises, just don't lose focus of this longer-term chart:
Trade Setup
Since beginning this Weekly Market Report in early September, I've discussed the long-term trade candidates below that I really like. Generally, these stocks have excellent long-term track records and many pay nice dividends that mostly grow every year. Only in very specific cases (exceptions) would I consider a long-term entry into a stock that has a poor or limited long-term track record:
- JPM
- BA
- FFIV
- MA
- GS
- FDX
- AAPL
- CHRW
- JBHT
- STX
- HSY
- DIS
- MSCI
- SBUX
- KRE
- ED
- AJG
Keep in mind that our Weekly Market Reports favor those more interested in the long-term market picture. Therefore, the list of stocks above are stocks that we believe are safer (but nothing is ever 100% safe) to own with the long-term in mind. Nearly everything else we do at EarningsBeats.com favors short-term momentum trading, so I wanted to provide an explanation of what we're doing with this list. I continue to search for more companies to add to this long-term buy and hold list, but don't have any for this week.
Looking Ahead
Upcoming Earnings:
Q1 earnings will begin in just 2 weeks. This week, however, earnings are limited. I've identified what I believe are key companies that will report this week, with their respective market caps in parenthesis. This is NOT a list of ALL companies reporting this week, so please be sure to check for earnings of any companies that you own or add. Any companies in BOLD represent stocks in one of our Portfolios:
- Monday: GS ($129 billion), SCHW ($125 billion), MTB ($23 billion)
- Tuesday: UNH ($407 billion), JNJ ($359 billion), BAC ($287 billion)
- Wednesday: ASML ($392 billion), CSX ($69 billion), TRV ($50 billion)
- Thursday: TSM ($763 billion), NFLX ($272 billion), ISRG ($139 billion)
- Friday: PG ($367 billion), AXP ($158 billion), SLB ($77 billion)
Key Economic Reports:
- Monday: March retail sales, April empire state manufacturing index
- Tuesday: March housing starts & building permits, March industrial production & capacity utilization
- Wednesday: None
- Thursday: Initial jobless claims, April Philadelphia Fed manufacturing index, March existing home sales, March leading indicators
- Friday: None
Historical Data
I'm a true stock market historian. I am absolutely PASSIONATE about studying stock market history to provide us more clues about likely stock market direction and potential sectors/industries/stocks to trade. While I don't use history as a primary indicator, I'm always very aware of it as a secondary indicator. I love it when history lines up with my technical signals, providing me much more confidence to make particular trades.
Below you'll find the next two weeks of historical data and tendencies across the 3 key indices that I follow most closely:
S&P 500 (since 1950)
- April 15: +43.26%
- April 16: +63.12%
- April 17: +90.31%
- April 18: +40.61%
- April 19: -23.31%
- April 20: -31.69%
- April 21: +37.15%
- April 22: -3.59%
- April 23: -12.38%
- April 24: -19.70%
- April 25: +23.36%
- April 26: +10.87%
- April 27: -0.94%
- April 28: +2.53%
NASDAQ (since 1971)
- April 15: +21.17%
- April 16: +96.29%
- April 17: +98.90%
- April 18: +121.03%
- April 19: -24.84%
- April 20: -48.16%
- April 21: +60.62%
- April 22: +57.27%
- April 23: -19.86%
- April 24: -33.54%
- April 25: +47.15%
- April 26: -14.24%
- April 27: +15.06%
- April 28: +11.63%
Russell 2000 (since 1987)
- April 15: -36.41%
- April 16: +124.79%
- April 17: +98.28%
- April 18: +102.72%
- April 19: +1.25%
- April 20: -104.74%
- April 21: +102.52%
- April 22: +10.64%
- April 23: +29.93%
- April 24: +25.63%
- April 25: +72.55%
- April 26: -6.37%
- April 27: +10.14%
- April 28: +45.63%
The S&P 500 data dates back to 1950, while the NASDAQ and Russell 2000 information date back to 1971 and 1987, respectively.
From our April Seasonality Report, here's how April historically breaks down on the benchmark S&P 500 (annualized returns):
- April 1-18: +31.39%
- April 19-24: -8.77%
- April 25-30: +10.55%
Final Thoughts
The inflation hype rose significantly last week. Yes, we still have inflation above the Fed's target level and, yes, we've seen a couple of recent Core CPI readings that have been slightly above expectations. But the annual Core CPI rate has moved lower nearly every month for the past couple years. It's heading in the right direction. A few years ago, I said that when inflation tops and rolls over, the stock market, and particularly growth stocks, would explode higher. And they have.
Here are several things to consider in the week ahead:
- Inflation. The March CPI came in hotter than expected and scared many market participants. Fear does that. Emotional trading is a real thing and it makes the goal of making money very difficult. Personally, I say stick with this secular bull market and don't be tempted to exit, because of the bearish media.
- Earnings. We will see things start to pick up this week. One earnings report I'll be paying close attention to is Netflix (NFLX) on Thursday.
- Interest Rates. The 10-year treasury yield ($TNX) broke out of a cup with handle recently and the yield measurement is to 4.66%. Look for a possible reversal near this level. If it does reverse and begins heading lower, a big beneficiary could be the small cap area (IWM). If yields continue higher, the sledding will be much more difficult for small caps.
- Financials. It was a rough week for financials (XLF) last week and it was undeserved based on the strong quarterly earnings reports from this sector on Friday. It may have been a "buy on rumor, sell on news" scenario, however. Will they bounce back this week?
- Commodities. Energy (XLE), gold ($GOLD), and silver ($SILVER) all printed what I believe will be topping candles. The dollar strengthened last week and if it breaks out again, the 2024 run in commodities might end abruptly.
- Apple, Inc. (AAPL): I wrote about the crazy manipulation in AAPL recently, which I believe will ultimately result in AAPL resuming its long-term uptrend. It did print a positive divergence on its last bit of selling, then quickly popped to test its 50-day SMA and to nearly return its PPO to its zero line, a "reset" in my book. Here's the question for the week: Can AAPL break out above its 50-day SMA on strong volume? If so, I'd look for a run higher into its upcoming earnings. To the downside, can it hold its now-rising 20-day EMA? If not, the risk of a further decline short-term would increase.
Feedback
If you'd like to share your thoughts on our Weekly Market Report, positive or negative, you can reach us at "[email protected]".
Happy trading!
Tom