
EB Weekly Market Report - Monday, April 22, 2024
Abbreviated Weekly Market Report and Upcoming Schedule
I recorded our Weekly Market Recap video at YouTube.com yesterday and it can be accessed HERE. I had family in town this weekend, so I've mostly kept up all our reports and services. The EB Weekly Portfolio Report was not done and this report will be somewhat abbreviated, but otherwise I've tried to keep to our regular schedule.
This week, I will be completely out of pocket and on vacation from Wednesday noon through Sunday afternoon. Here are schedule changes that I anticipate (though I will have my computer with me and may do some work updating earnings and such):
- There will be no TP Live show on Thursday
- I will not produce Daily Market Reports (DMRs) Wednesday through Friday, but John Hopkins will send out brief market updates each day. I will be following the market from afar and will communicate anything I see of interest to John, who will pass it along
- The EB Weekly Portfolio Report and the EB Weekly Market Report may or may not be done. I will try, but it will likely be determined by the time I arrive home on Sunday
- The EB Digest articles should be done, though Friday's EBD article is the one that might not be published
Like I said, I'll have my computer with me, so if I stop by a Starbucks, I might be able to finish some of the above, but I just don't want to make any promises.
ChartLists Updated
Several ChartLists were updated on Friday and our website has been updated:
- Strong Earnings (SECL) - link was not working originally, but that has been corrected
- Strong Future Earnings (SFECL)
- Raised Guidance (RGCL)
- Strong ETF (SETFCL)
- Bullish Trifecta (BTCL)
We've also updated the Upcoming Earnings ChartLists for companies reporting Q1 earnings this week. Those daily Upcoming Earnings ChartLists, along with the Upcoming Earnings - Relative Strength ChartList can be found on our website as well.
Weekly Market Recap
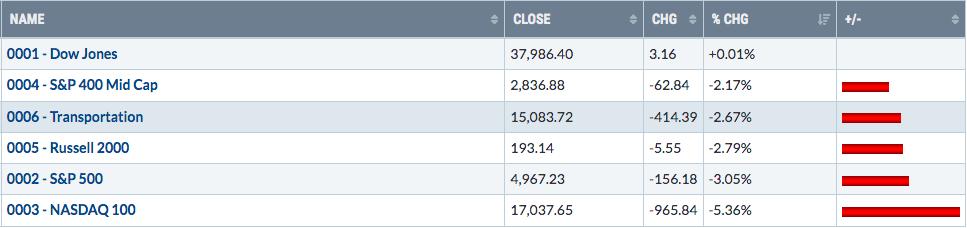
Major Indices
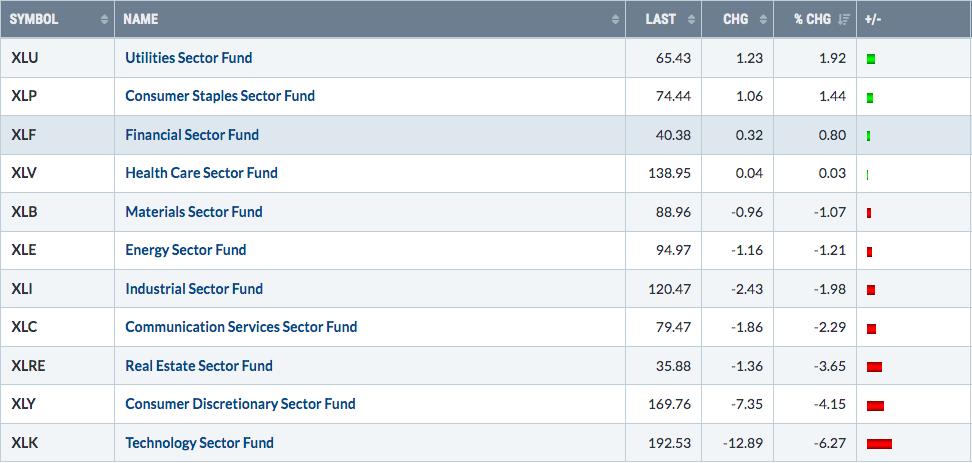
Sectors
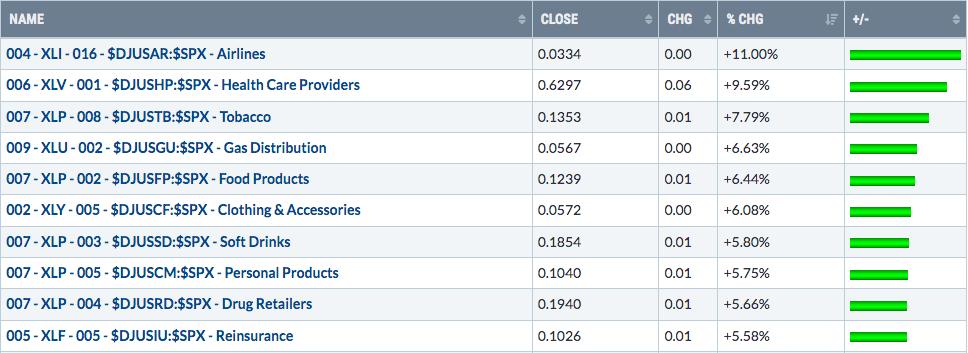
Top 10 Industries Last Week
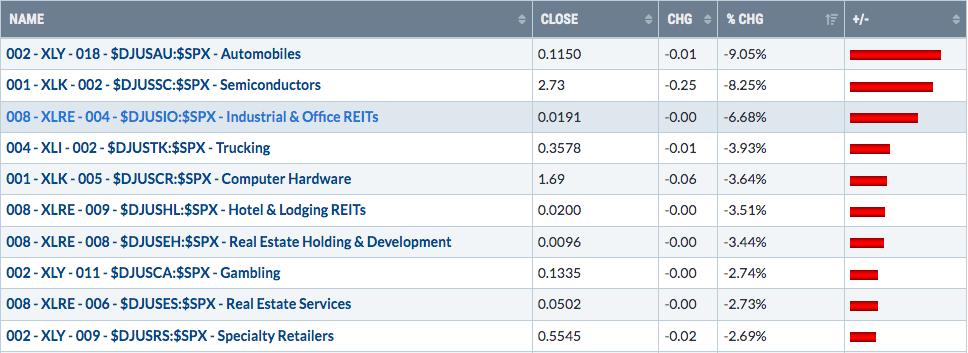
Bottom 10 Industries Last Week
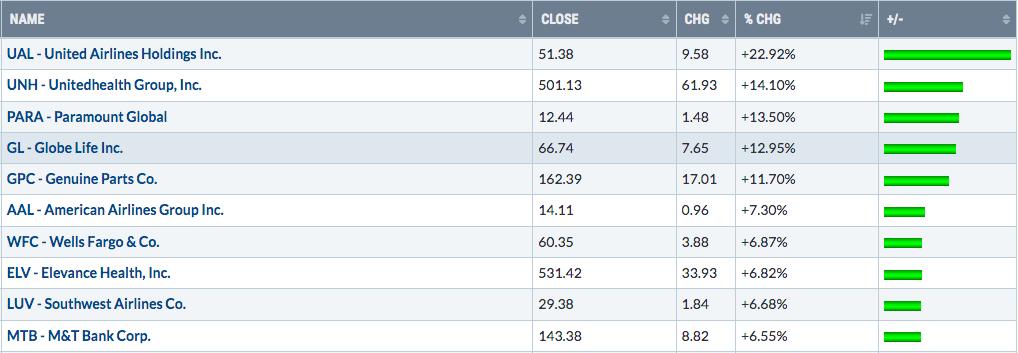
Top 10 Stocks - S&P 500/NASDAQ 100
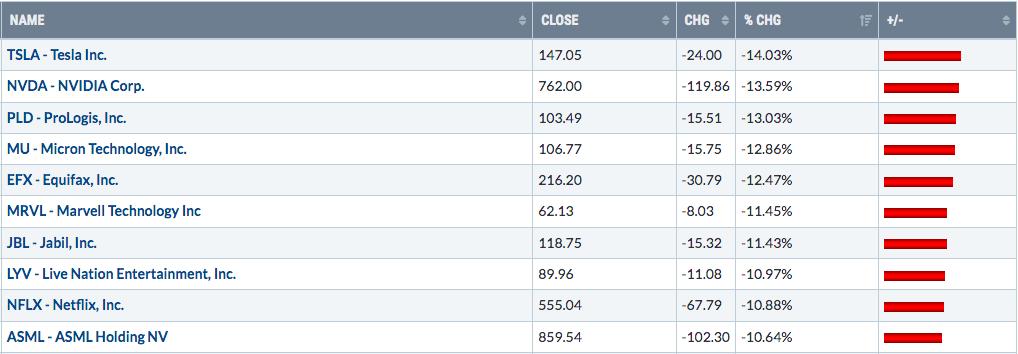
Bottom 10 Stocks - S&P 500/NASDAQ 100
Big Picture
Last week's selling certainly didn't feel good from a long perspective. It never does. But the pullback "noise" is filtered out when we look at the S&P 500 from a long-term perspective.
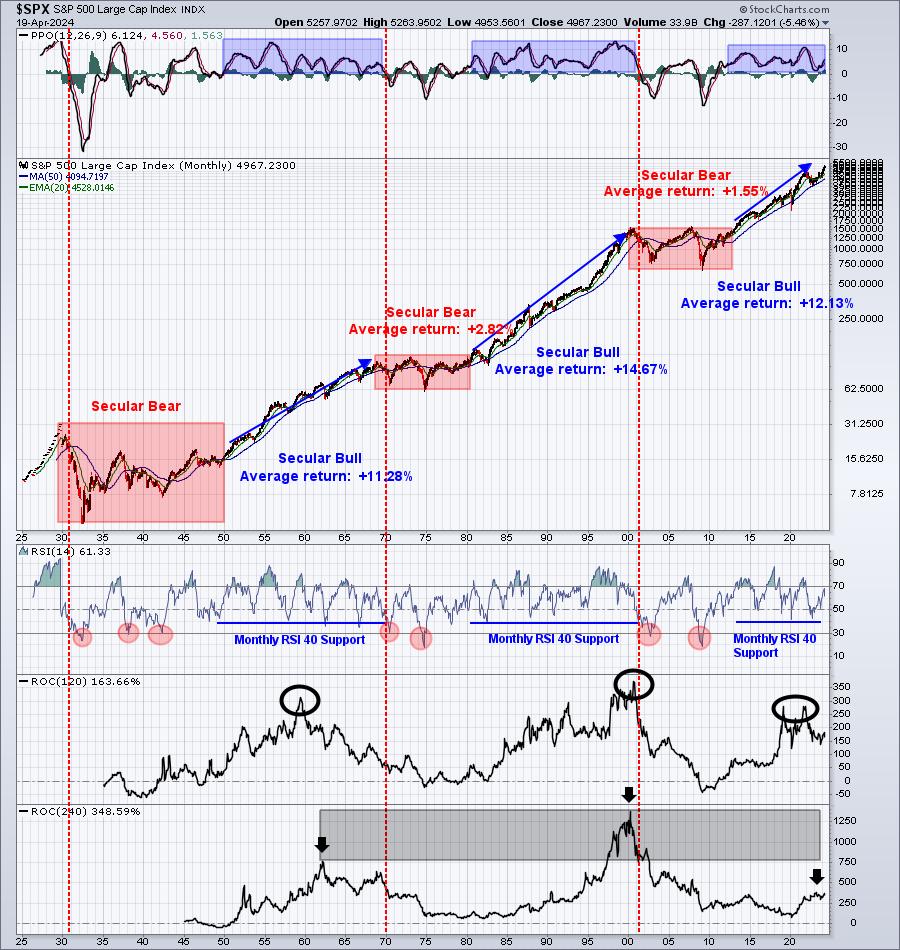
Also, if you were in attendance earlier this year when I gave my MarketVision 2024 forecast, I expected to see the S&P 500 dip back below 5000 in Q1 - most likely February or March. I believe what we're seeing now is simply what I expected a bit earlier in the year.
Sentiment
The 5-day SMA of the equity only put call ratio ($CPCE) jumped last week, if no adjustments are made for the hedging that took place late in the day Wednesday. From 3:30pm ET to the close, 1.16 million equity puts traded vs. 150,000 equity calls. That is NOT the result of retail traders, but rather hedging by professionals. Intraday readings RARELY are more than 1:1 (puts vs. calls). During the 2008 financial crisis, half hour readings intraday topped at roughly 3:1 or so. That was when the VIX was above 50 and panic was everywhere. We're nowhere near that level of fear, making the Wednesday reading way out of character. This is why I adjust my readings and track a User-Defined Index (UDI) at StockCharts.com. My sentiment indicators really haven't spiked enough to contemplate a "panicked" bottom. The VIX needs to break through 20, maybe quite a bit higher than 20 and the 5-day SMA of the CPCE would need to reach a minimum of .75, but more likely above .80. I'm not saying that this will happen, but to see a capitulatory-type bottom, that's what we'd likely see.
I took a snapshot of the CBOE half-hourly readings last Wednesday, so that you can see how the CPCE was impacted by a MASSIVE surge in the CPCE after 3:30pm ET (Remember, the CBOE is on central time, so 2:30pm CT equals 3:30pm ET). I shared that screenshot in my EB Weekly Market Recap video yesterday. Be sure to check that out.
Rotation/Intermarket Analysis
Here's the latest look at our key intraday ratios as we follow where the money is traveling on an INTRADAY basis:
QQQ:SPY
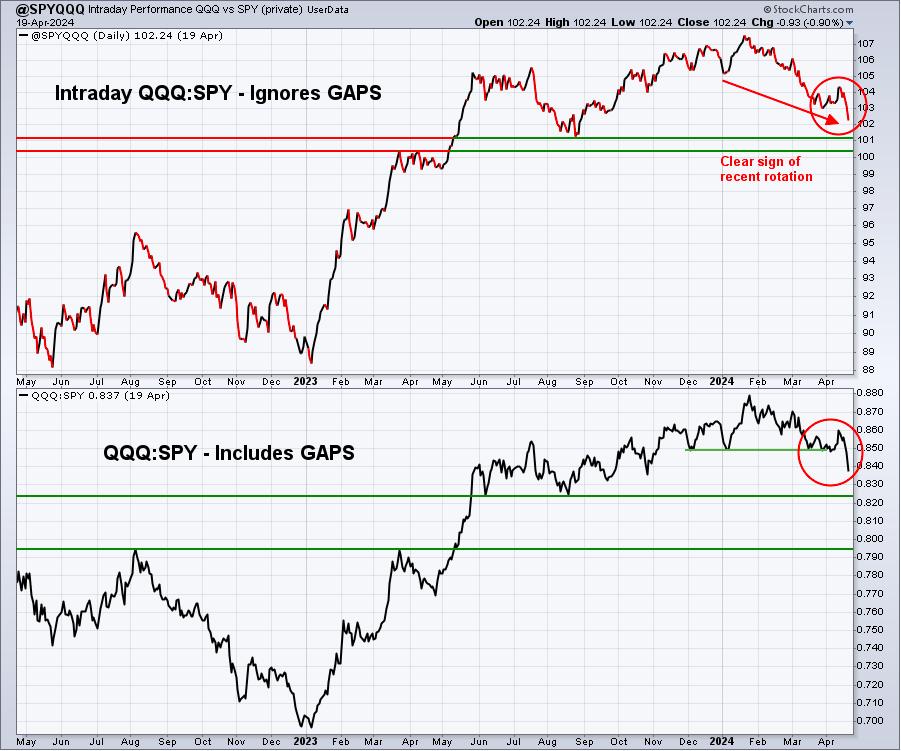
The QQQ:SPY ratio has been deteriorating as value has outperformed growth, but I'd watch the key relative support levels provided and the upcoming May to August period that favors growth (see next section that discusses growth's historical strength the next 4 months).
IWM:QQQ
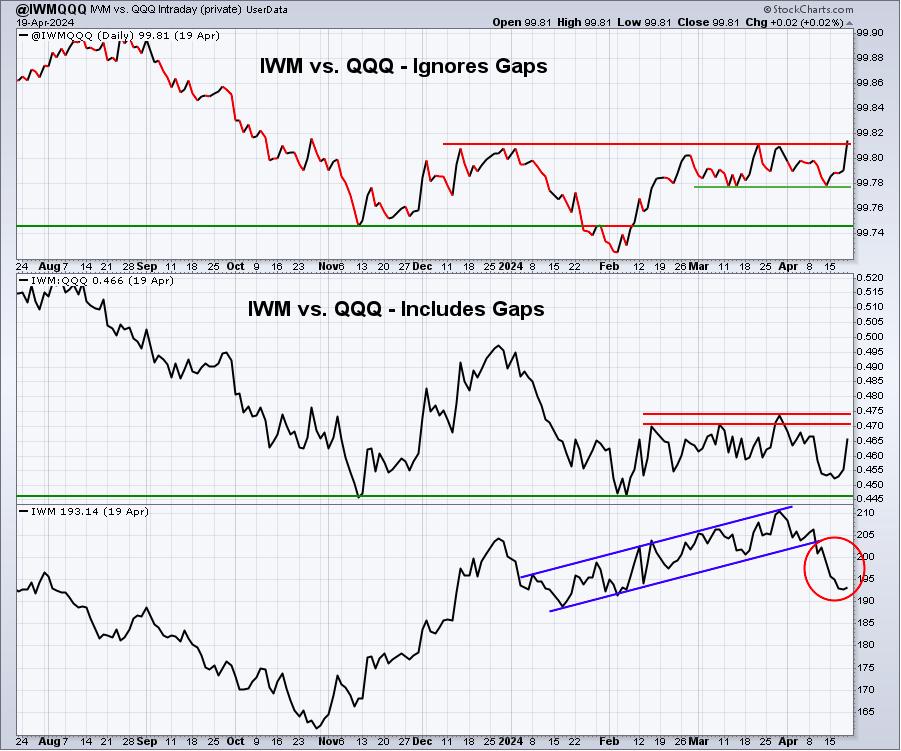
I know we've seen small caps struggle in the short-term, but this chart says not to give up on them. The "ignoring gaps" version has just broken to its highest level since October 2023.
XLY:XLP
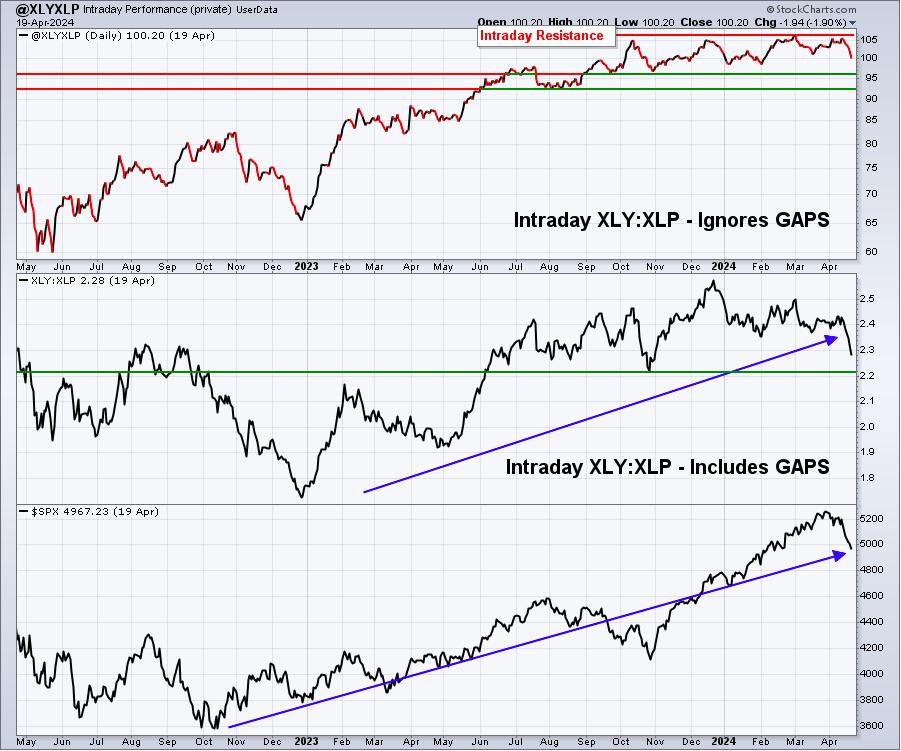
If we ignore gaps, the XLY:XLP ratio has actually remained quite strong and in a clear uptrend, despite the recent relative weakness. We took a big hit last week, but the VIX has remained beneath 20. Perhaps the worst is behind us?
Key Sector/Industry Charts
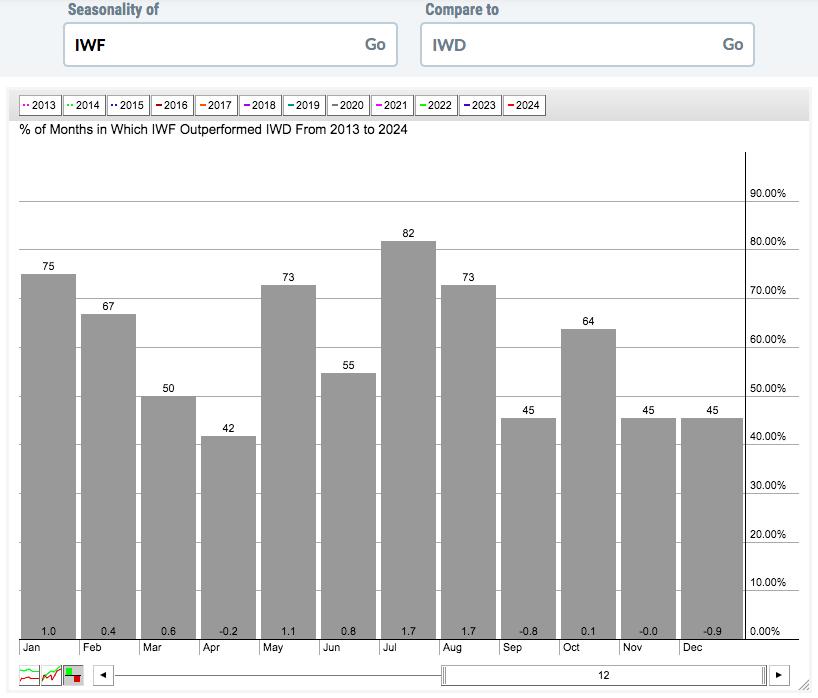
I've started discussing this recently, but we are approaching the absolute best time of the year to be invested in growth stocks (vs. value). Here's a seasonality chart that covers the past 11+ years since this secular bull market began. At the bottom of each bar is the average outperformance of growth (IWF) vs. value (IWD) for that calendar month. If you add up the totals, you'll find that the IWF averages outperforming the IWD by 5.3% from May through August. The other 8 months combined shows IWF outperformance of just 0.2%. Clearly, this upcoming May through August period is where growth separates itself from value - at least historically. Check this out:
Trade Setup
Since beginning this Weekly Market Report in early September, I've discussed the long-term trade candidates below that I really like. Generally, these stocks have excellent long-term track records and many pay nice dividends that mostly grow every year. Only in very specific cases (exceptions) would I consider a long-term entry into a stock that has a poor or limited long-term track record:
- JPM
- BA
- FFIV
- MA
- GS
- FDX
- AAPL
- CHRW
- JBHT
- STX
- HSY
- DIS
- MSCI
- SBUX
- KRE
- ED
- AJG
Keep in mind that our Weekly Market Reports favor those more interested in the long-term market picture. Therefore, the list of stocks above are stocks that we believe are safer (but nothing is ever 100% safe) to own with the long-term in mind. Nearly everything else we do at EarningsBeats.com favors short-term momentum trading, so I wanted to provide an explanation of what we're doing with this list.
I don't have any additions to list "long-term" list at this time.
Looking Ahead
Upcoming Earnings:
Q1 earnings are underway and accelerating. I've identified what I believe are key companies that will report this week, with their respective market caps in parenthesis. This is NOT a list of ALL companies reporting this week, so please be sure to check for earnings of any companies that you own or add. Any companies in BOLD represent stocks in one of our Portfolios:
- Monday: VZ ($169 billion)
- Tuesday: V ($498 billion), TSLA ($477 billion), GE ($167 billion)
- Wednesday: META ($1.28 trillion), NOW ($150 billion), LRCX ($117 billion)
- Thursday: MSFT ($3.00 trillion), GOOGL ($1.96 trillion), CAT ($179 billion), INTC ($148 billion)
- Friday: XOM ($469 billion), CVX ($293 billion)
Key Economic Reports:
- Monday: None
- Tuesday: March new home sales
- Wednesday: March durable goods
- Thursday: Initial jobless claims, Q1 GDP, Q1 PCE, March pending home sales
- Friday: March personal income & personal spending, March Core PCE, April consumer sentiment
Historical Data
I'm a true stock market historian. I am absolutely PASSIONATE about studying stock market history to provide us more clues about likely stock market direction and potential sectors/industries/stocks to trade. While I don't use history as a primary indicator, I'm always very aware of it as a secondary indicator. I love it when history lines up with my technical signals, providing me much more confidence to make particular trades.
Below you'll find the next two weeks of historical data and tendencies across the 3 key indices that I follow most closely:
S&P 500 (since 1950)
- April 22: -3.59%
- April 23: -12.38%
- April 24: -19.70%
- April 25: +23.36%
- April 26: +10.87%
- April 27: -0.94%
- April 28: +2.53%
- April 29: +38.84%
- April 30: -10.67%
- May 1: +49.60%
- May 2: +40.36%
- May 3: +16.87%
- May 4: +13.45%
- May 5: +33.21%
NASDAQ (since 1971)
- April 22: +57.27%
- April 23: -19.86%
- April 24: -33.54%
- April 25: +47.15%
- April 26: -14.24%
- April 27: +15.06%
- April 28: +11.63%
- April 29: +47.61%
- April 30: -9.90%
- May 1: +71.05%
- May 2: +56.11%
- May 3: -28.63%
- May 4: +56.84%
- May 5: +57.18%
Russell 2000 (since 1987)
- April 22: +10.64%
- April 23: +29.93%
- April 24: +25.63%
- April 25: +72.55%
- April 26: -6.37%
- April 27: +10.14%
- April 28: +45.63%
- April 29: +99.89%
- April 30: -97.98%
- May 1: +22.81%
- May 2: +69.89%
- May 3: +17.82%
- May 4: +71.17%
- May 5: +8.87%
The S&P 500 data dates back to 1950, while the NASDAQ and Russell 2000 information date back to 1971 and 1987, respectively.
From our April Seasonality Report, here's how April historically breaks down on the benchmark S&P 500 (annualized returns):
- April 1-18: +31.39%
- April 19-24: -8.77%
- April 25-30: +10.55%
Final Thoughts
The inflation hype rose significantly last week. Yes, we still have inflation above the Fed's target level and, yes, we've seen a couple of recent Core CPI readings that have been slightly above expectations. But the annual Core CPI rate has moved lower nearly every month for the past couple years. It's heading in the right direction. A few years ago, I said that when inflation tops and rolls over, the stock market, and particularly growth stocks, would explode higher. And they have.
Here are several things to consider in the week ahead:
- Inflation. CPI remains a hot topic in the news. We'll get the Q1 PCE with the GDP report on Thursday and then will get the March month over month PCE with the personal income & personal spending report on Friday.
- Interest Rates. The 10-year treasury yield ($TNX) broke out of a cup with handle recently and the yield measurement was to 4.66%, which was hit last week. I was watching for a possible reversal at this level and we tried after posting the high intraday yield near 4.70% - the bottom of gap resistance. The TNX, while falling a bit from these key levels last week, stubbornly remains near the 4.66% level.
- Growth Stocks. We have a serious battle ahead. Higher inflationary concerns and higher yields are putting pressure on growth stocks, but key earnings reports from NASDAQ leaders are due out over the next few weeks, starting with a few giants this week. Earnings thus far have been very strong, but it's the outlooks that traders are mostly concerned with. Tesla (TSLA), Meta Platforms (META), Amazon.com (AMZN), Alphabet (GOOGL), and Microsoft (MSFT), are reporting this week, just to name a few.
- Q1 GDP. The Fed is always trying to balance policy, given inflationary AND economic concerns. While they are very likely to recognize inflation as the their primary concern, which they should, keeping rates higher for longer threatens what has been a very resilient economy. Housing starts fell rather significantly last week, possibly sending an early warning signal for U.S. equities
- Apple, Inc. (AAPL): AAPL doesn't report earnings until next week, but it's broken down slightly below 165 support. If it doesn't reverse now, I see the next support level closer to 155. AAPL will likely trade in sympathy with those other NASDAQ leaders above that will be reporting results this week.
- Consumer Stocks. If inflation does become a bigger concern, the XLY:XLP ratio will likely head much lower. If our major indices keep dropping and the XLY:XLP ratio heads higher, that would be an early signal that the selling most likely won't last.
- Manipulation. Over the years, I've suggested that opening gaps to the downside, followed by morning selling is not the same as big afternoon drops. I'll be watching this potential manipulation in the days and, perhaps, weeks ahead, looking for these clues and I'll keep everyone posted.
Feedback
If you'd like to share your thoughts on our Weekly Market Report, positive or negative, you can reach us at "[email protected]".
Happy trading!
Tom