
EB Weekly Market Report - Monday, May 13, 2024
ChartLists Updated
A large number of ChartLists were updated over the weekend and have been updated on our website. Here's what was updated:
- Strong Earnings (SECL)
- Strong Future Earnings (SFECL)
- Raised Guidance (RGCL) - through Friday, May 3rd.
- Strong AD (SADCL)
- Bullish Trifecta (BTCL)
- Earnings AD (EADCL)
- Upcoming Earnings - 5 ChartLists
- Upcoming Earnings - Relative Strength
Weekly Market Recap
Major Indices
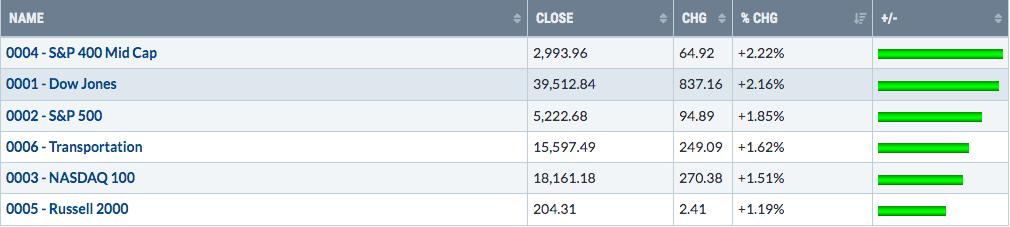
We saw gains across the board last week, with mid cap stocks leading the charge. Here are the levels on the $MID that I'm currently watching:
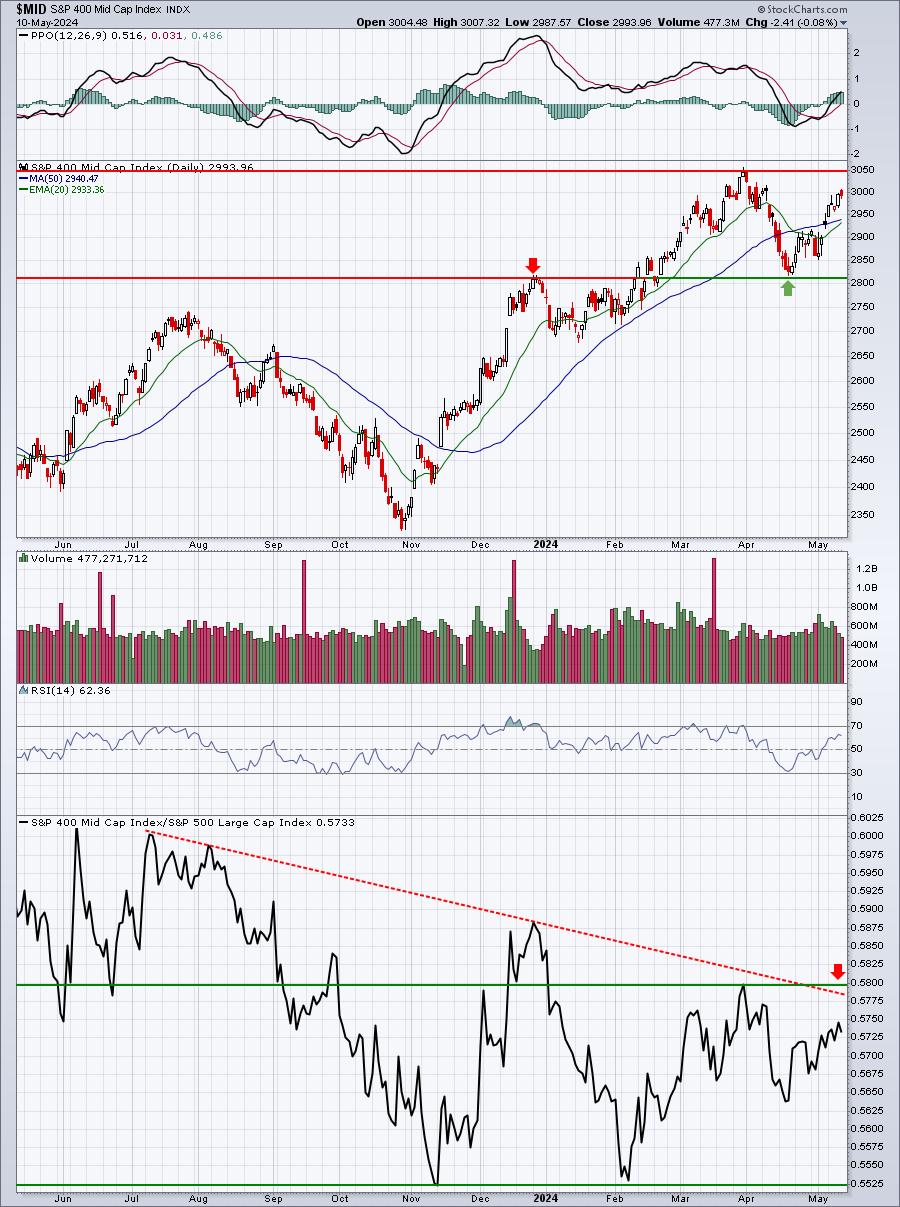
Clearing above 3050 on the absolute price chart and above 0.5800 on the relative price chart (bottom panel) would be extremely bullish for mid caps. There's still plenty of work to do, but keep an eye on it.
Sectors
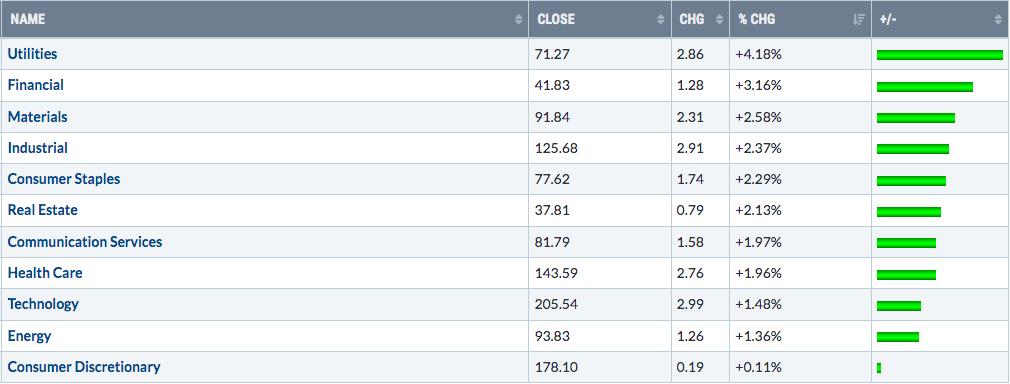
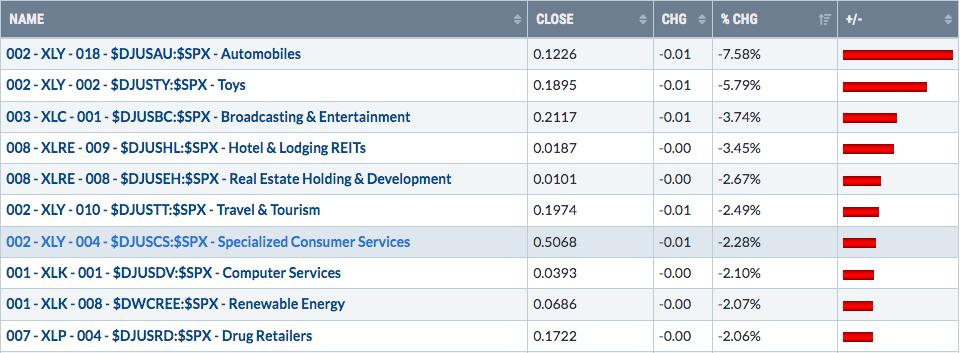
All 11 sectors were positive last week, though consumer discretionary (XLY) really struggled on a relative basis. Value stocks were definitely in play last week, with utilities (XLU), financials (XLF), and materials (XLB) leading the action. Still, seeing all 11 sectors moving higher as the S&P 500 moves toward all-time highs is a good thing.
Top 10 Industries Last Week
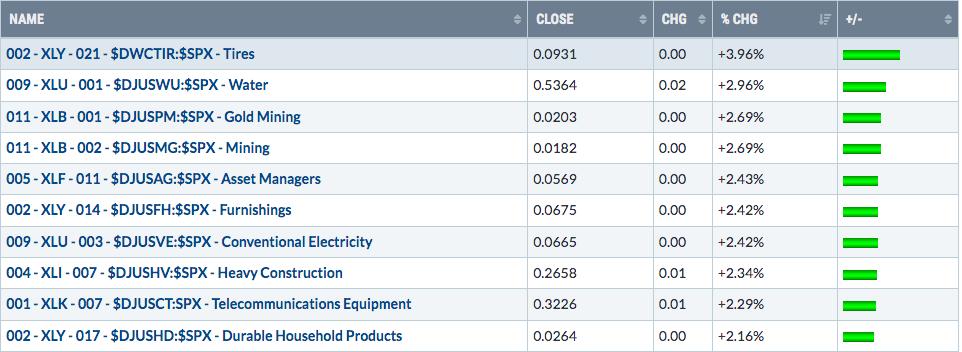
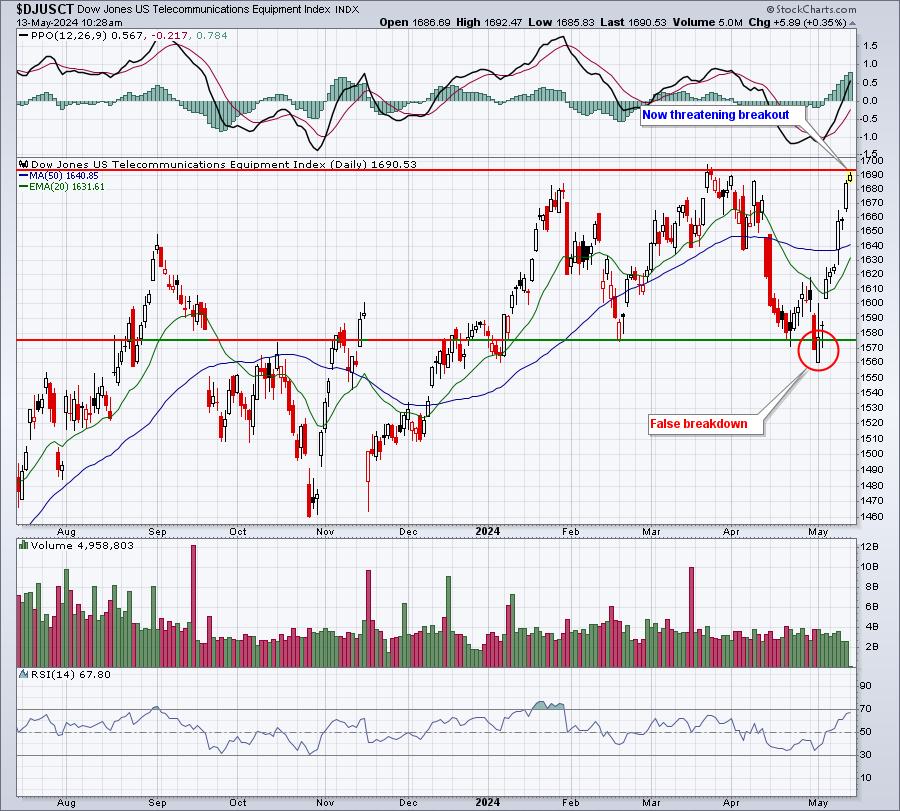
Telecom equipment ($DJUSCT) looked like it was breaking down a few weeks ago. But after that head fake, the group has rallied strongly and is now threatening a key breakout:
Bottom 10 Industries Last Week
This morning, Tesla (TSLA, +3.70%) is attempting to rebound off gap support and the automobiles group ($DJUSAU) is attempting to do the same thing:
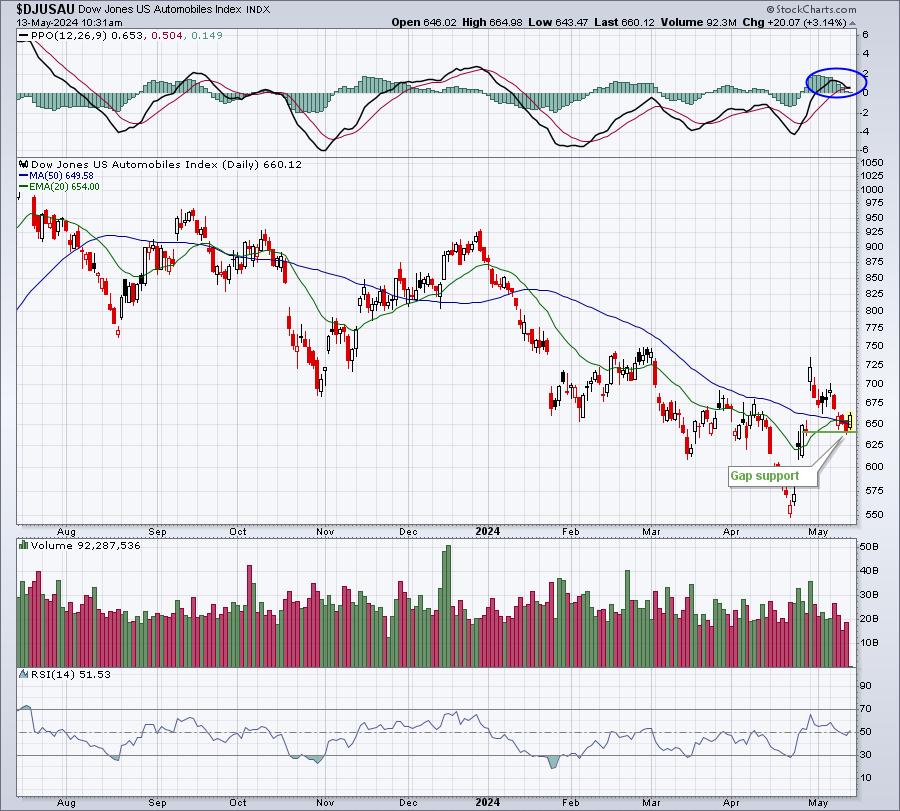
This is a solid entry into TSLA given that we've seen an initial rebound off gap support. As a bull, I'd expect this rebound to continue. However, if it fails to, a close below gap support of 168.29 would be reason to exit and take a small loss. If this level holds, though, a return trip to nearly 200 is quite possible. Clearly, the reward-to-risk is solid at this level and even better if it falls back and approaches 168.29.
Top 10 Stocks - S&P 500/NASDAQ 100
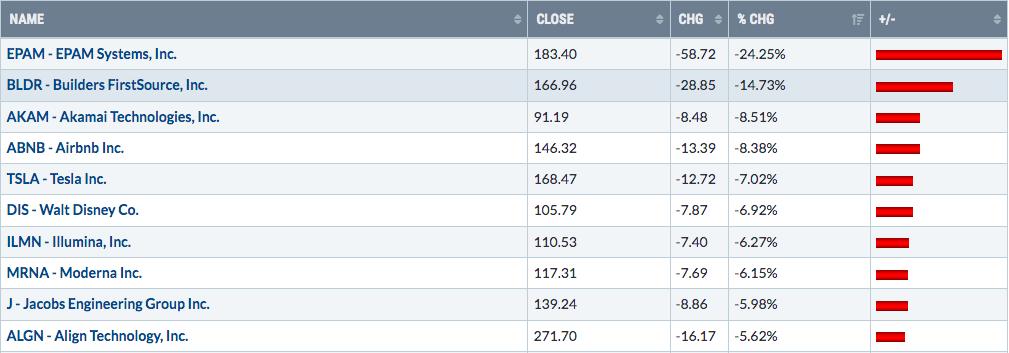
Bottom 10 Stocks - S&P 500/NASDAQ 100
Big Picture
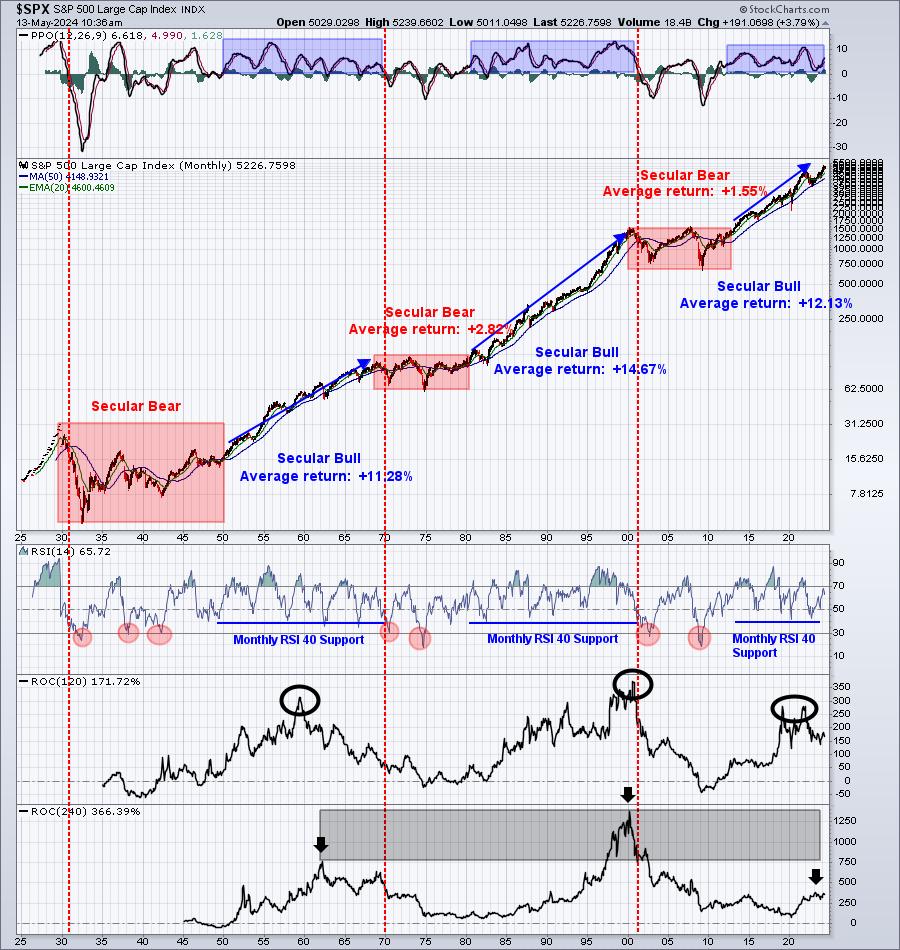
Recently, I pointed out that the April weakness barely shows up on this "Big Picture" chart of the S&P 500. It's nothing more than noise. The Big Picture isn't concerned about the day-to-day or week-to-week action. It ignores it and only shows concern when key long-term technical levels are breached or when our long-term signals at EarningsBeats.com begin to show topping signs. We're nowhere near that right now. Here's our weekly look at the Big Picture:
Sentiment
Here's one of those very important long-term signals - the 253-day (1-year) SMA of the equity only put call ratio ($CPCE). When this moving average is falling from extremely high levels, it has a strong history of coinciding with major S&P 500 advances. Bet against this chart at your own risk:
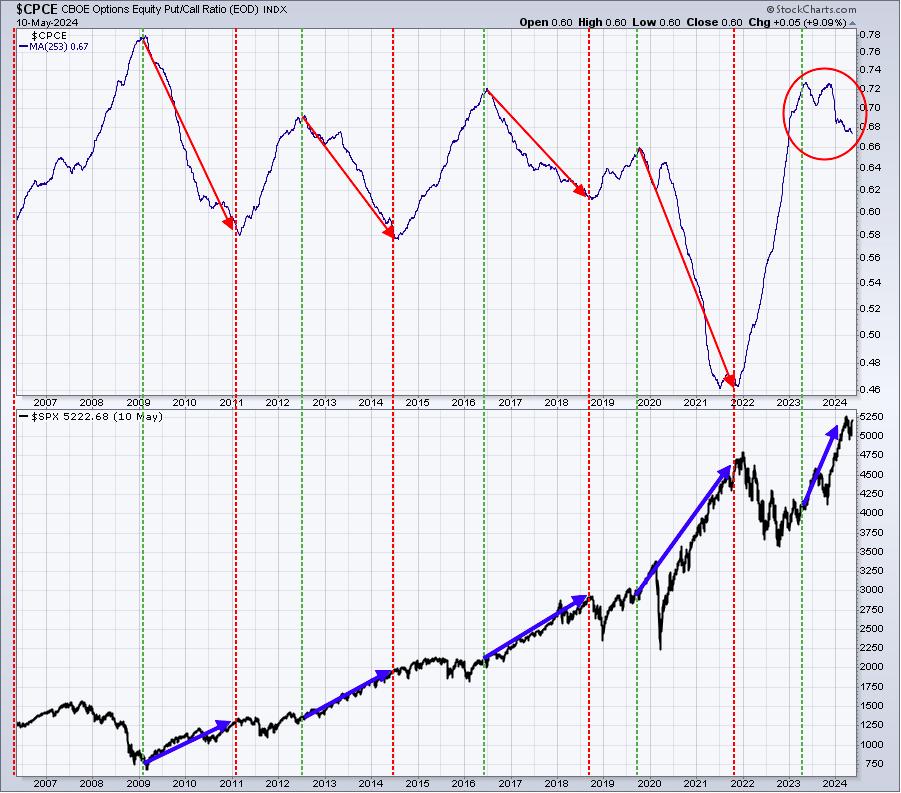
This is a VERY important signal that tells me we should remain on the long side and ignore all the noise spewed in mainstream media. Listen to the story that matters.
Another very significant sentiment development that's taken place recently is the HUGE drop in the Volatility Index ($VIX). Many are (were) calling for a bear market to develop with the April selling. I was most definitely NOT one of those, but I was issuing caution IF the VIX closed above 20. My research suggests that we are MOST at risk in the near-term (possibly long-term), when the VIX closes above 20. It doesn't always lead to big selling, but we need to heed this significant warning to make sure we protect our capital. Fortunately, we never saw the VIX close above 20. Instead, it quickly retreated back below 17, which HAS NOT occurred this century when a bear market is underway. In other words, bear markets REQUIRE fear and panic and once the VIX tells us that fear and panic are no longer in its plans, the thoughts of a bear market need to vanish.
Anyhow, check out the VIX, which closed last week in the 12s (though it has jumped today back into the 13s):
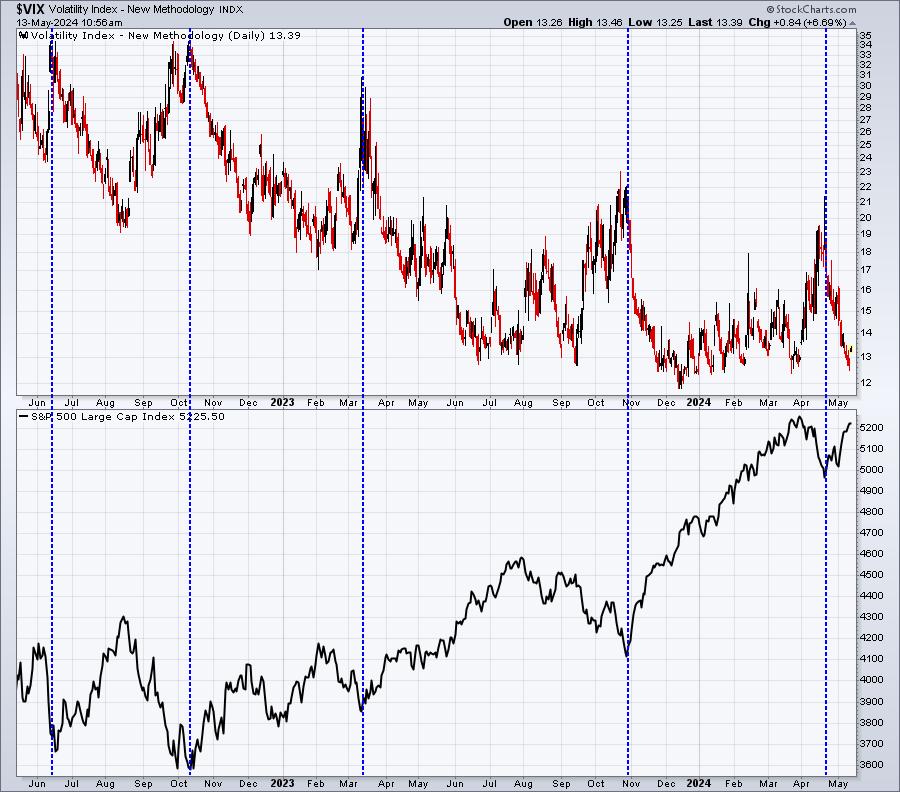
Over the past two years, every time the VIX has peaked, and then fallen precipitously, the S&P 500 has rallied and, AT LEAST, taken out prior short-term highs. That suggests that, at a minimum, we should look for another S&P 500 all-time high.
Rotation/Intermarket Analysis
Here's the latest look at our key intraday ratios as we follow where the money is traveling on an INTRADAY basis (ignoring gaps):
QQQ:SPY
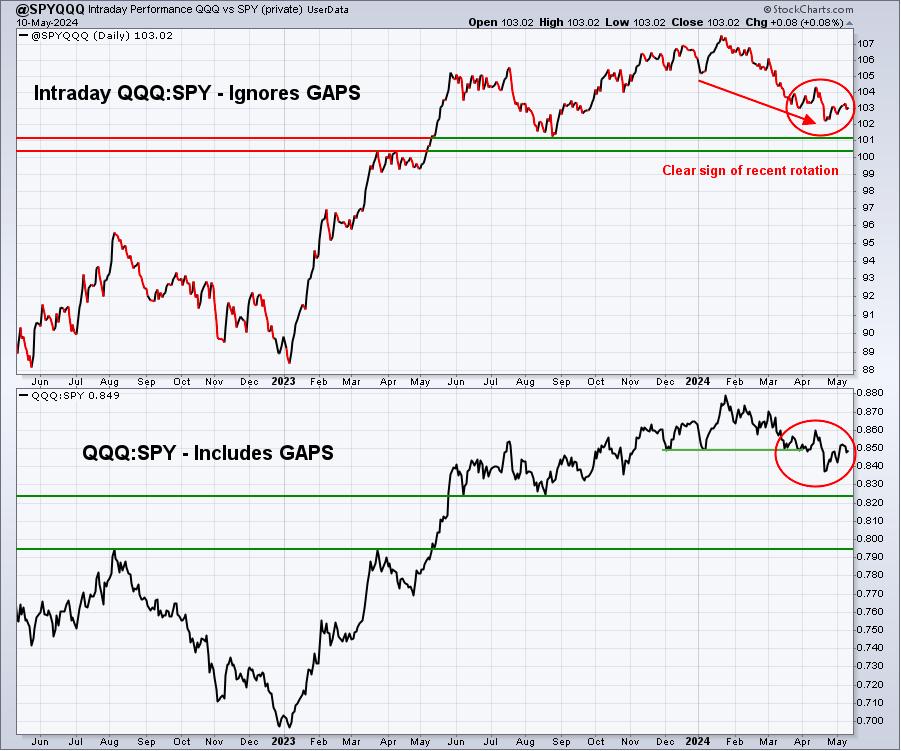
First, a quick reminder. While this chart is named "@SPYQQQ", it's actually the QQQ divided by the SPY. When this line is rising, it means the QQQ is outperforming the SPY ("risk on" environment). When it's falling, it means the SPY is outperforming the QQQ ("risk off" environment).
IWM:QQQ
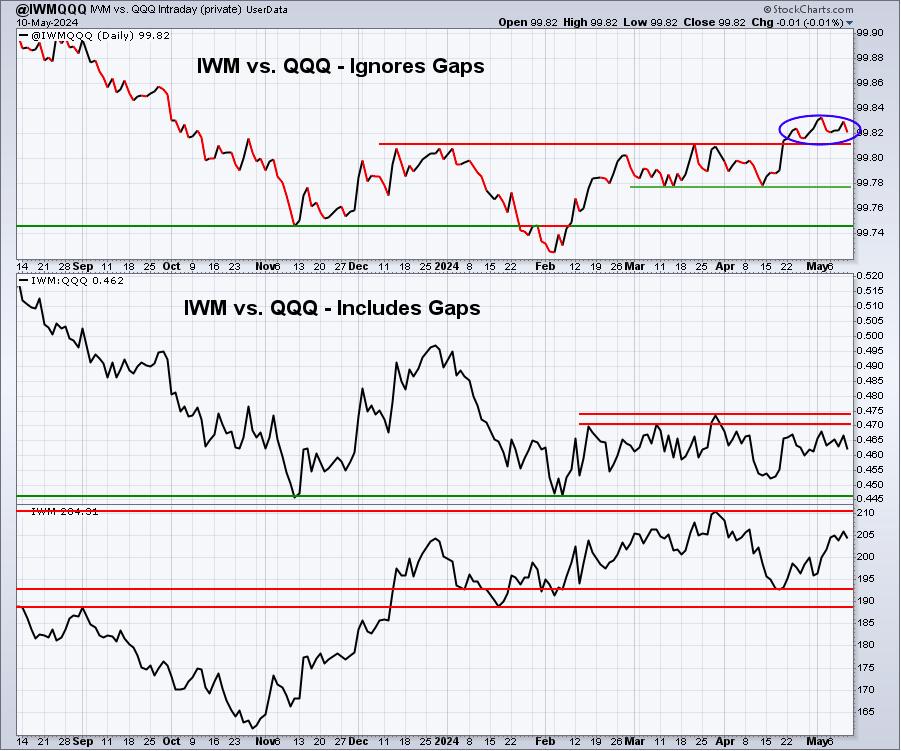
In the top panel, last week wasn't the best week for the IWM:QQQ intraday ratio (ignoring gaps). But it was at its highest ratio since early-October 2023. Continuing upside in this ratio would support my theory that we'll see significant outperformance by the IWM later this year. Personally, I continue to weight the IWM much heavier than normal, relative to my holdings in the QQQ and SPY.
XLY:XLP
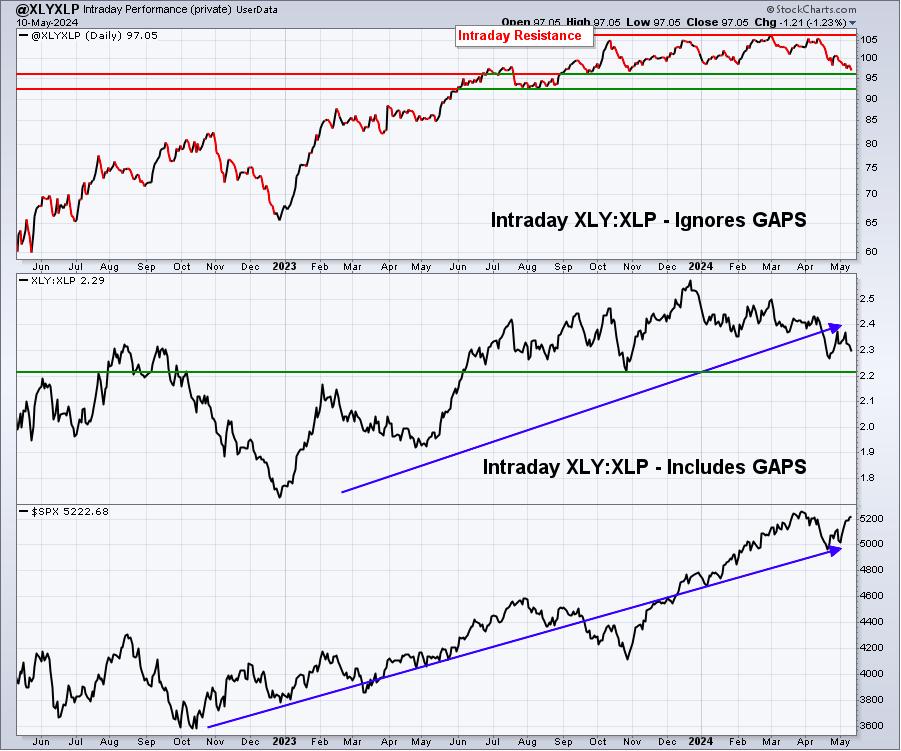
This is perhaps the most cautious of my short-term market signals. Consumer discretionary (XLY) has not performed well in 2024. Another way to look at its underperformance is to view the Y-T-D sector performance for all sectors:
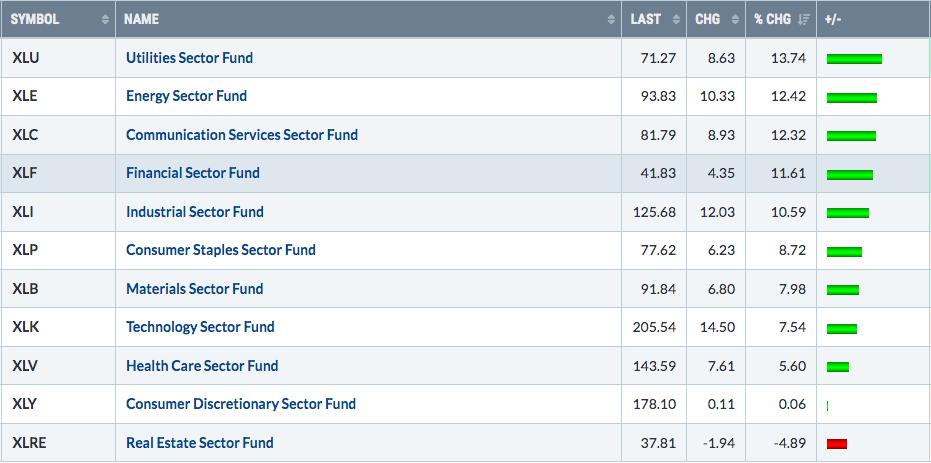
Leadership has been mixed in 2024, but the XLY barely shows any gain for the year, despite overall bullish action in U.S. equities. One final way to view how badly the XLY is lagging is by using an RRG chart to picture it visually:
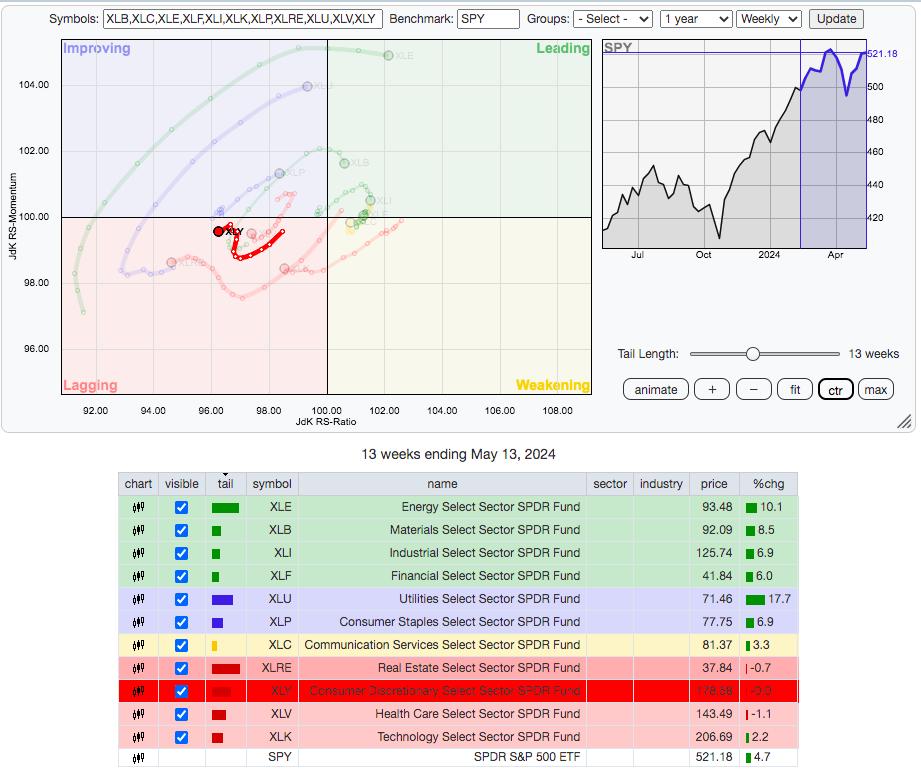
I've highlighted the XLY on the RRG chart above, so that you can see its movement over the past 13 weeks, or 1 quarter. It keeps moving further and further left, which is indicative of deteriorating relative strength vs. the S&P 500. This group is almost single-handedly responsible for the S&P 500 remaining beneath its all-time high.
Key Sector/Industry Charts
Industrials (XLI) has completed its cup, which is a bullish continuation pattern after an uptrend:
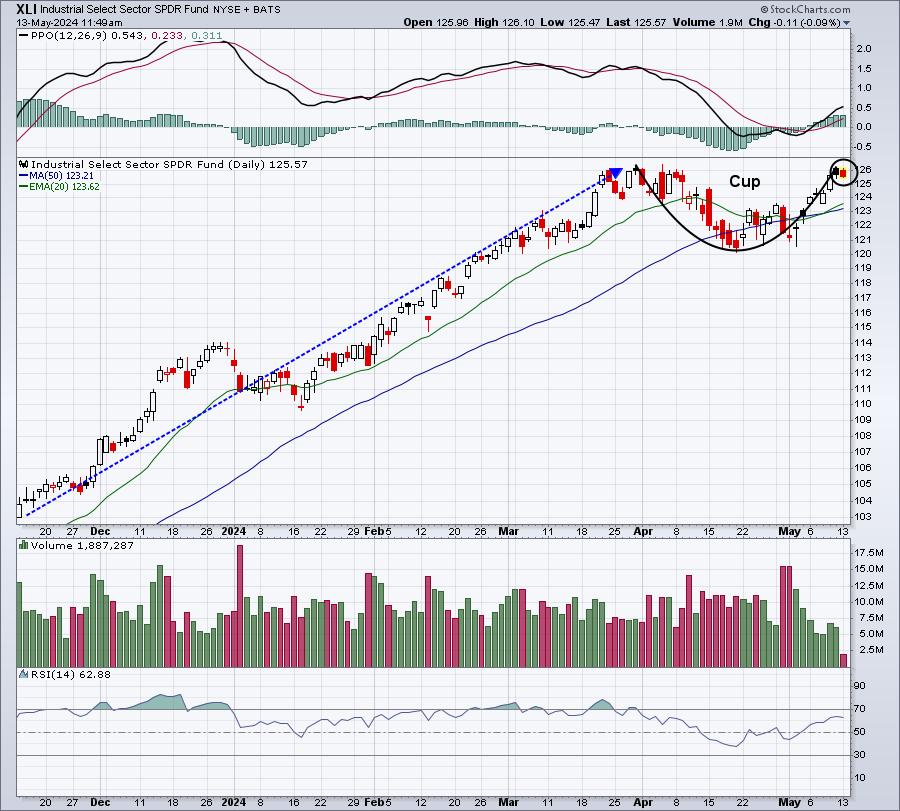
The XLI shows a beautiful uptrend, followed by a rounded cup. The black circle could represent the start of a handle, which could precede a key cup with handle breakout that would measure initially to 132.
Trade Setup
Since beginning this Weekly Market Report in early September, I've discussed the long-term trade candidates below that I really like. Generally, these stocks have excellent long-term track records and many pay nice dividends that mostly grow every year. Only in very specific cases (exceptions) would I consider a long-term entry into a stock that has a poor or limited long-term track record:
- JPM
- BA
- FFIV
- MA
- GS
- FDX
- AAPL
- CHRW
- JBHT
- STX
- HSY
- DIS
- MSCI
- SBUX
- KRE
- ED
- AJG
Keep in mind that our Weekly Market Reports favor those more interested in the long-term market picture. Therefore, the list of stocks above are stocks that we believe are safer (but nothing is ever 100% safe) to own with the long-term in mind. Nearly everything else we do at EarningsBeats.com favors short-term momentum trading, so I wanted to provide an explanation of what we're doing with this list.
I don't have any additions to list "long-term" list at this time.
Looking Ahead
Upcoming Earnings:
Q1 earnings are winding down as fewer and fewer of market-moving stocks will be reporting. Still, I've identified what I believe are key companies that will report this week, with their respective market caps in parenthesis. This is NOT a list of ALL companies reporting this week, so please be sure to check for earnings of any companies that you own or add. Any companies in BOLD represent stocks in one of our Portfolios:
- Monday: None
- Tuesday: HD ($344 billion), BABA ($202 billion)
- Wednesday: CSCO ($194 billion)
- Thursday: WMT ($487 billion), AMAT ($171 billion), DE ($114 billion)
- Friday: None
Key Economic Reports:
- Monday: None
- Tuesday: April PPI
- Wednesday: April CPI, April retail sales, May empire state manufacturing index, May housing market index
- Thursday: Initial jobless claims, April housing starts & building permits, May Philadelphia Fed manufacturing index, April industrial production & capacity utilization
- Friday: April leading indicators
Historical Data
I'm a true stock market historian. I am absolutely PASSIONATE about studying stock market history to provide us more clues about likely stock market direction and potential sectors/industries/stocks to trade. While I don't use history as a primary indicator, I'm always very aware of it as a secondary indicator. I love it when history lines up with my technical signals, providing me much more confidence to make particular trades.
Below you'll find the next two weeks of historical data and tendencies across the 3 key indices that I follow most closely:
S&P 500 (since 1950)
- May 13: -7.49%
- May 14: -20.15%
- May 15: +9.23%
- May 16: +11.47%
- May 17: -18.79%
- May 18: -13.84%
- May 19: -25.73%
- May 20: -12.62%
- May 21: -11.02%
- May 22: +9.71%
- May 23: -37.61%
- May 24: -8.55%
- May 25: -15.90%
- May 26: +54.11% (begins very bullish historical period through June 6)
NASDAQ (since 1971)
- May 13: -16.95%
- May 14: +13.42%
- May 15: +35.21%
- May 16: +52.22%
- May 17: -36.99%
- May 18: -9.09%
- May 19: -42.21%
- May 20: -18.45%
- May 21: +16.69%
- May 22: +34.73%
- May 23: -55.30%
- May 24: +9.57%
- May 25: +15.82%
- May 26: +106.29% (begins very bullish historical period through June 5)
Russell 2000 (since 1987)
- May 13: -84.43%
- May 14: +10.37%
- May 15: +29.02%
- May 16: +20.18%
- May 17: -23.07%
- May 18: +82.33%
- May 19: -41.25%
- May 20: -32.79%
- May 21: +88.48%
- May 22: -5.27%
- May 23: -34.29%
- May 24: -21.00%
- May 25: +38.88%
- May 26: +170.50% (begins very bullish historical period through June 5)
The S&P 500 data dates back to 1950, while the NASDAQ and Russell 2000 information date back to 1971 and 1987, respectively.
Here's a quick historical analysis of the S&P 500 during May since 1950:
- May 1-5: +29.94%
- May 6-25: -12.10%
- May 26-31: +37.27%
The May 26 through June 6 period has annualized returns of +34.45%.
Here are the May 26 through June 5 annualized returns for the NASDAQ and Russell 2000:
- NASDAQ: +57.08%
- Russell 2000: +78.26%
Final Thoughts
We've rallied back close to all-time highs on the Dow Jones, S&P 500 and NASDAQ. The Russell 2000 (IWM) has been strong, but still has a long way to go to challenge its all-time high from November 8, 2021, of 236.12.
Here are several things to consider in the week ahead:
- Inflation. The next big inflation report will hit on Wednesday morning as the April CPI will be released. Current expectations are for both headline and core CPI to come in at +0.3%. If that number hits, I believe the stock market will be fine. If we come in below expectations, I believe it could trigger all-time highs. BUT, if we see a higher-than-expected number, it could be the news that continues to trap us in this current consolidation period best case and perhaps challenge April lows worst case.
- Earnings. These are becoming less of a factor, but we will hear from Walmart (WMT), Home Depot (HD), Cisco Systems (CSCO), and Applied Materials (AMAT). I doubt that CSCO will have much of an impact on overall action, but WMT and HD are part of discretionary stocks that need a lift. AMAT is a semiconductor equipment company that certainly could impact that group, which, in turn, could have an impact on our major indices, especially the NASDAQ.
- Interest Rates: The 10-year treasury yield ($TNX) is now comfortably below recent highs near 4.70%. The April CPI could have a material effect on the TNX. That would be news that could impact small caps considerably as the IWM has been moving in inverse fashion vs. the TNX.
- Semiconductors ($DJUSSC): This group recently broke its downtrend and AMAT will be reporting earnings this week. The DJUSSC has tremendous influence on our major indices, so keeping the momentum moving to the upside is important to drive equity prices higher.
- Gold/Silver. To my short-term surprise, both of these commodities bounced back big time last week, with the latter actually testing its breakout level. This occurred with the U.S. Dollar Index ($USD) rising as well.
- Growth vs. Value (IWF:IWD). Last week saw this ratio drop throughout the week. We got off to a very rough start this morning as well, but growth has battled back to near breakeven. Remember, we're in a 4-month period that favors growth stocks heavily from a historical perspective.
- Transports ($TRAN): Transports have rallied strongly in May, rising more than 6%. The group isn't out of the woods, but the rally has at least been a start in repairing significant technical price damage.
Feedback
If you'd like to share your thoughts on our Weekly Market Report, positive or negative, you can reach us at "[email protected]".
Happy trading!
Tom