
EB Weekly Market Report - Monday, May 20, 2024
ChartLists Updated
A large number of ChartLists were updated over the weekend and have been updated on our website. Here's what was updated:
- Strong Earnings (SECL)
- Strong Future Earnings (SFECL)
- Raised Guidance (RGCL)
- Short Squeeze (SSCL)
- Bullish Trifecta (BTCL)
- Upcoming Earnings - 5 ChartLists
- Upcoming Earnings - Relative Strength
- All Portfolio ChartLists
Weekly Market Recap
Major Indices
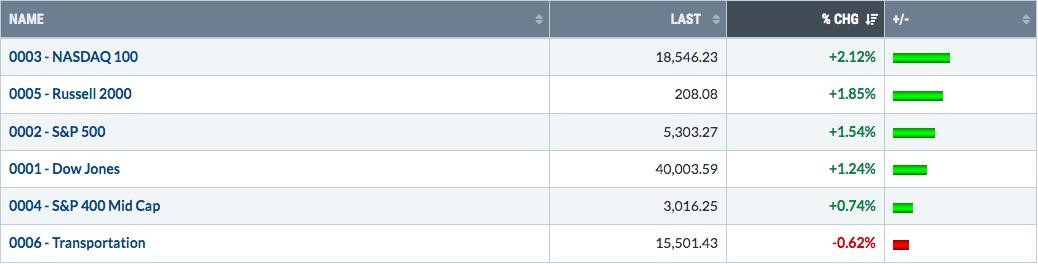
The NASDAQ regained a leadership role last week as money began rotating more towards growth stocks. Transportation ($TRAN) continued to lag badly, but our other indices gained ground as we saw new record highs in most of our key indices, along with broad participation.
Sectors
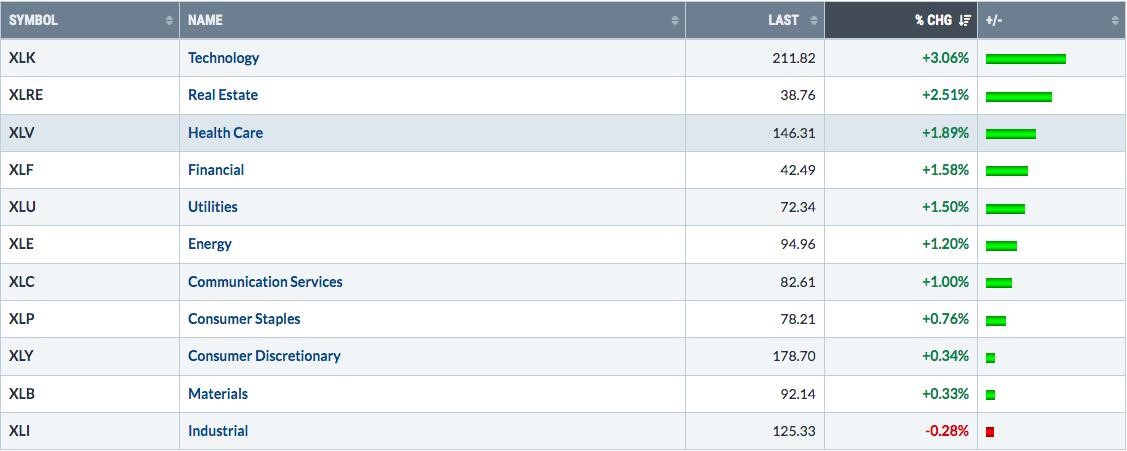
After a week in which we saw all 11 sectors advance, last week was nearly as good. 10 of 11 sectors gained ground, helping to provide the wide-participation advance that I love to see during secular bull market advances. It's very difficult to beg against U.S. equities right now, especially with a deteriorating 10-year treasury yield ($TNX)
Top 10 Industries Last Week
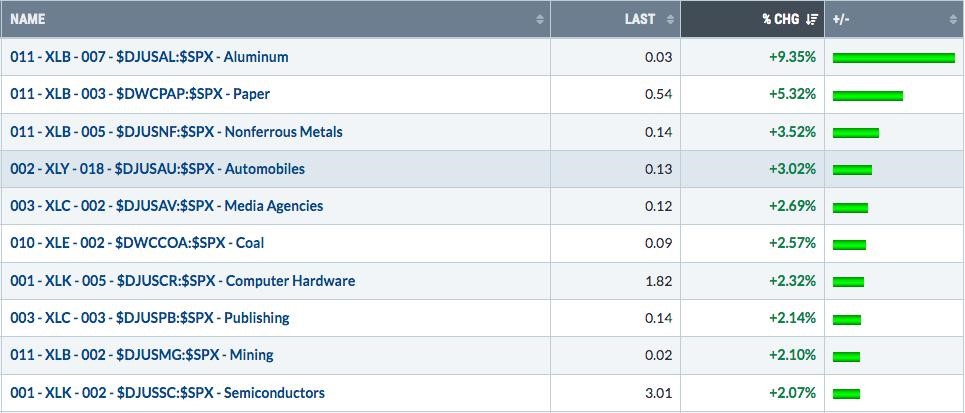
It's worth noting the breakout on media agencies ($DJUSAV):
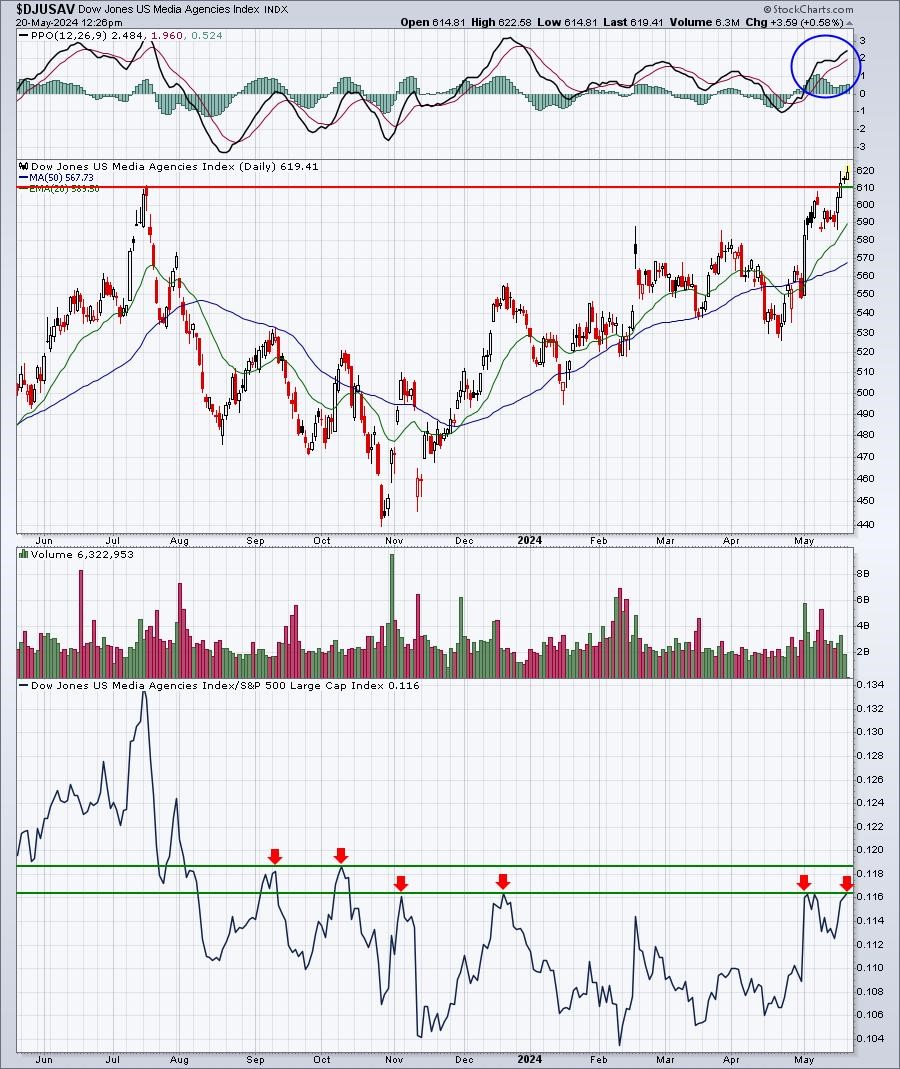
The good news is that the DJUSAV broke out to a fresh 52-week high. It still has a LONG way to go to approach its all-time high from April 2021 (near 900). Short-term, the obstacle is clear. The DJUSAV is testing key overhead relative resistance vs. the benchmark S&P 500 ($DJUSAV:$SPX). A breakout there tells us that media agencies are truly seeing solid rotation INTO the group.
Bottom 10 Industries Last Week
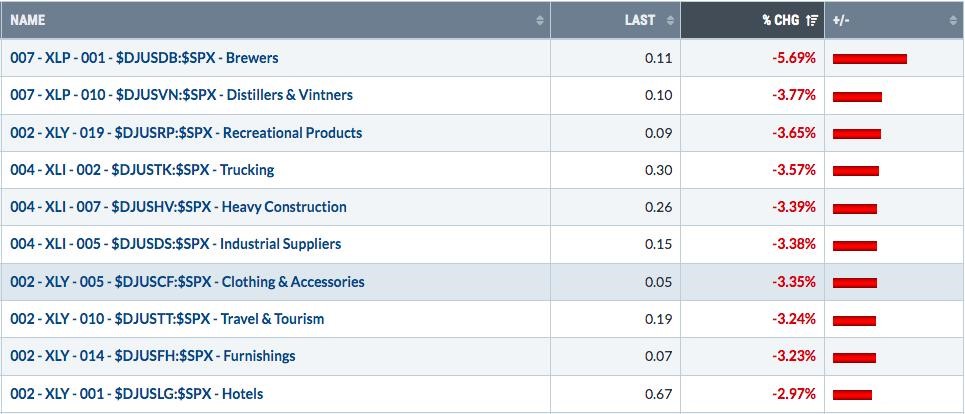
These groups were definite underperformers last week, but during a secular bull market advance, I look for the silver lining in weak industries. Many of the above groups are truly in downtrends that seem to only be getting worse - like the brewers ($DJUSDB). But others are in solid uptrends that simply pulled back, likely temporarily. The heavy construction group ($DJUSHV) would seem to fit that bill:
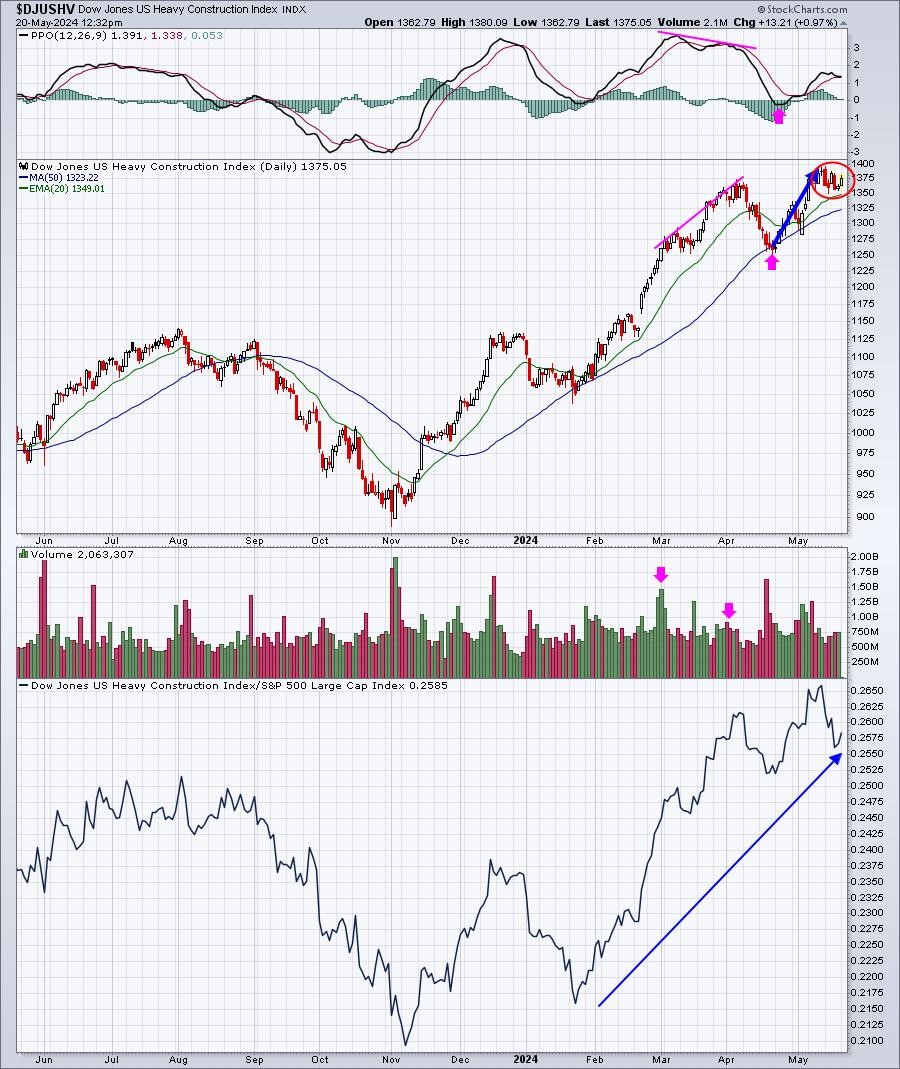
Last week's decline does not seem to be anything too terribly concerning. In fact, the red circle highlights what I believe is a flag in a bull flag pattern. I'd expect the next move to be higher, not lower.
Down doesn't always mean WEAK.
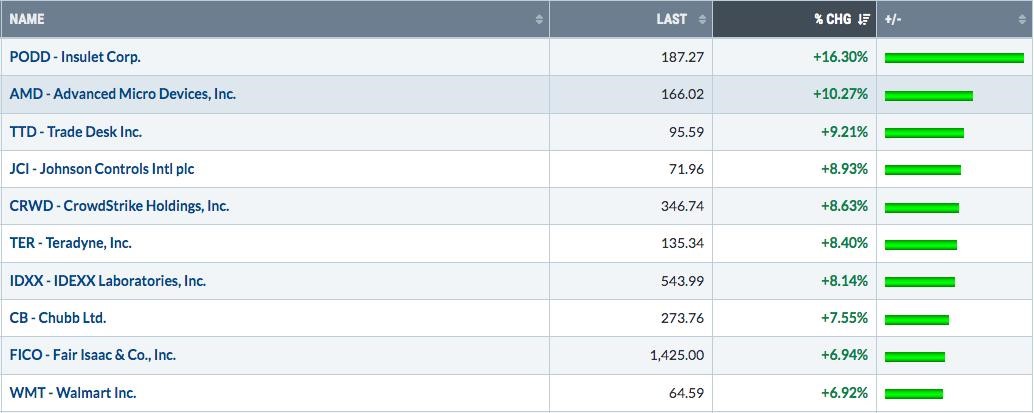
Top 10 Stocks - S&P 500/NASDAQ 100
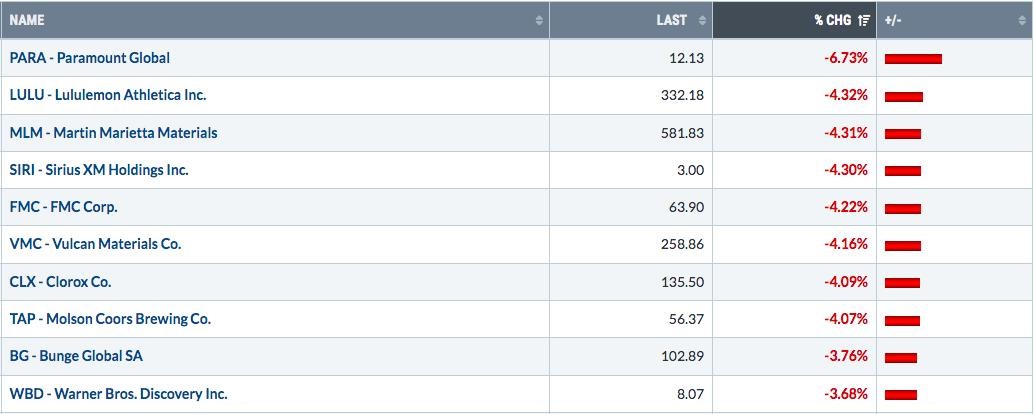
Bottom 10 Stocks - S&P 500/NASDAQ 100
Big Picture
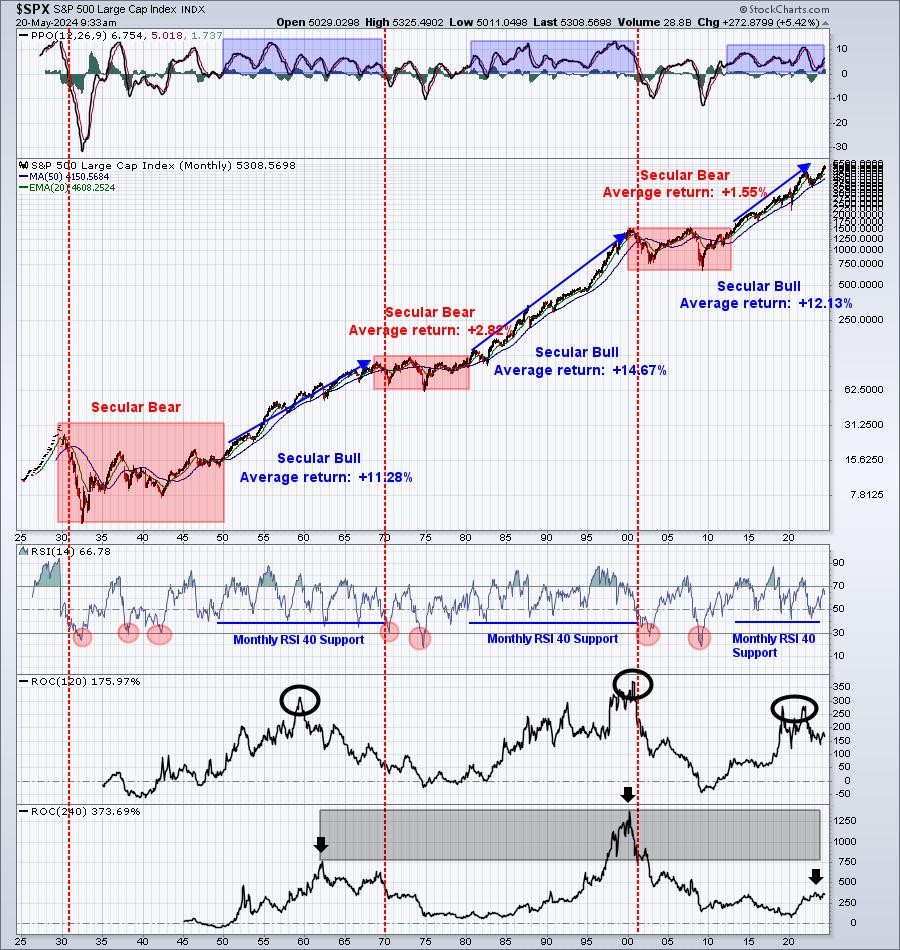
Well, the latest blip in April is no longer apparent on this BIG PICTURE 100-year chart at all. The bulls have done what they usually do during secular bull markets. They've left the recent weakness in the dust as we see more record highs. As I've continued to repeat over and over again for the past 12 years, STICK WITH THIS BULL MARKET. Do not let mainstream media brainwash you. Remember, we have no idea about their agenda. Those BIG Wall Street firms send their influencers (oops meant to say analysts) onto CNBC and elsewhere to TALK about what the stock market and individual stocks might or might not do. But the charts TELL US where the money is going. Breaking out to all-time highs with a Volatility Index ($VIX) reading in the 12s is bullish, PERIOD. That doesn't mean we can't see short-term selling from time to time, but it provides ZERO evidence of a bear market ahead.
Sentiment
I've written and discussed the Volatility Index ($VIX) and its implications many, many times. A VIX below 20 is a good VIX. A VIX below 17 is a better VIX. A VIX below 13 is an AWESOME VIX. I've done the research to back this up. The stock market performs its absolute best during a secular bull market when the VIX is below 13. Here's where we currently stand:
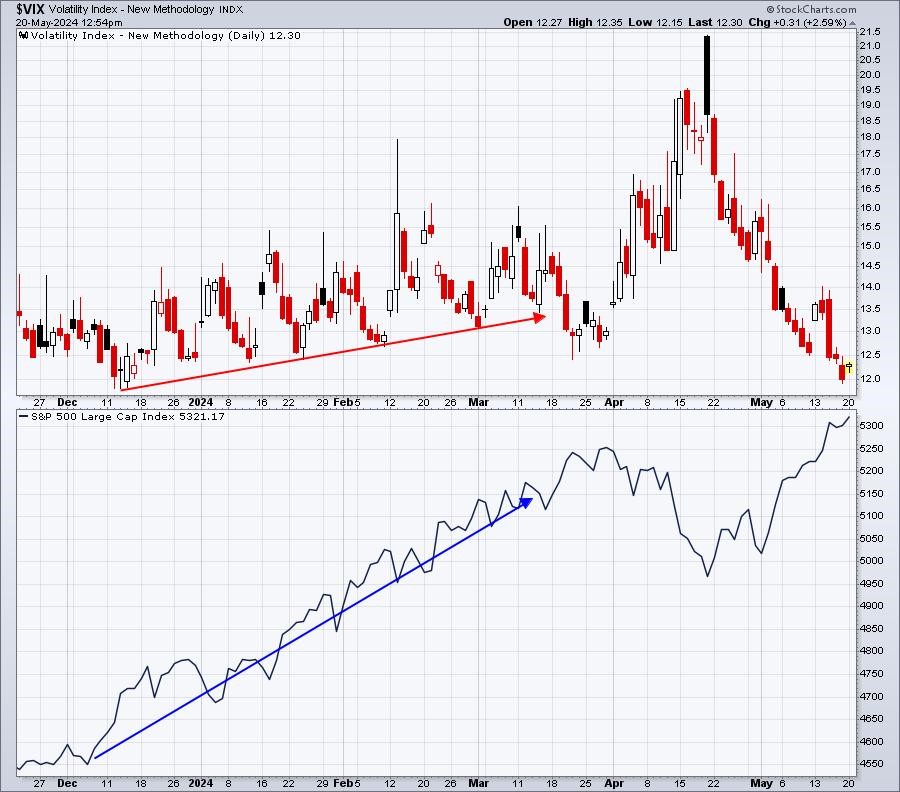
Last week, I wrote that the low VIX meant that, at the very least, we should see another all-time record high close on the S&P 500. We did that on Wednesday of last week and we're challenging that high today.
Generally, the VIX and S&P 500 move in opposite directions. However, that inverse relationship is much stronger when the VIX is jumping with big spikes, as opposed to slowly climbing. Many analysts believe that a low VIX means that weakness lies ahead, but I want you to check out the slow and steady increase in the VIX from 12 to 16 that spanned the 3 months from mid-December to mid-March. How did the S&P 500 fare? Do you see a big drop? It's another myth in the stock market that a rising VIX WILL always move inversely to the S&P 500, which would go down in that circumstance. That's why a low VIX is so bullish. It's the low reading that dictates the bullish market action, not the direction of the VIX. However, when we saw the VIX soar from 13 to nearly 20 in just over two weeks, then yes, we should expect to see a declining S&P 500 as that suggests a rapidly-changing market environment. As a general rule, I pay little attention to a rising VIX as long as the S&P 500 remains above its 20-day EMA.
So the VIX right now is telling me to expect higher prices over the next month. The VIX is calculated by using the premiums on short-term 1-month S&P 500 options. That's why I only use the VIX to predict one month ahead. But there is one short-term sentiment concern that we should be aware of - the 5-day moving average of the equity only put call ratio ($CPCE):
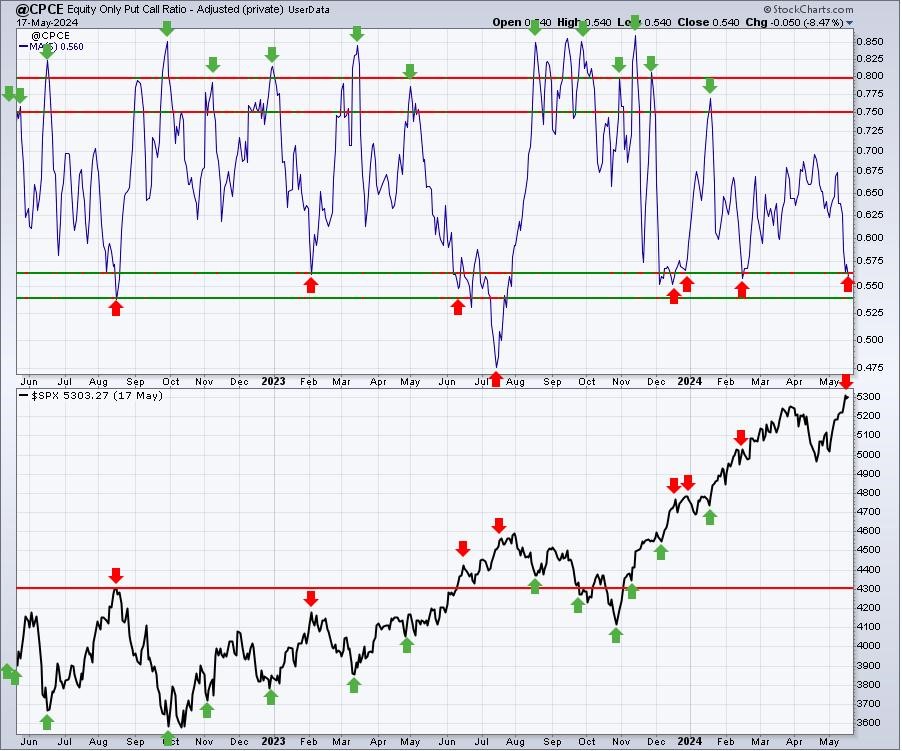
I've marked the overly bullish, complacent readings (those 5-day readings below .56) with red arrows, suggesting that a short-term pullback is increasing in odds. The overly bearish, pessimistic readings (those 5-day readings above .75) with green arrows, suggesting that a short-term bottom is increasing in odds. These are NOT guarantees. They're nothing more than SHORT-TERM warning signs that retail traders are growing either too optimistic or pessimistic and that we COULD see a reversal in the near-term.
So what should we do when the VIX sends us a short-term bullish signal saying to go long and the CPCE sends us a short-term bearish signal saying the market is too complacent and a pullback could be in store? Great question, but I NEVER back away from what I believe is a secular bull market advance. So, personally I stay long. But, because of the cautious CPCE signal, I wouldn't use leverage. That's the difference for me.
Rotation/Intermarket Analysis
Here's the latest look at our key intraday ratios as we follow where the money is traveling on an INTRADAY basis (ignoring gaps):
QQQ:SPY
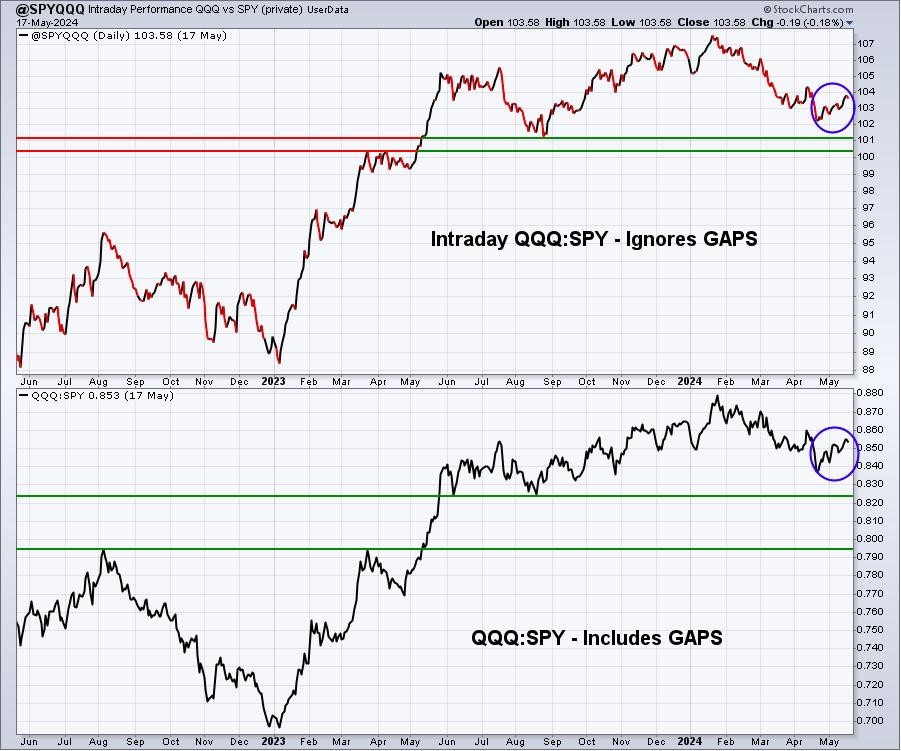
First, a quick reminder. While this chart is named "@SPYQQQ", it's actually the QQQ divided by the SPY. When this line is rising, it means the QQQ is outperforming the SPY ("risk on" environment). When it's falling, it means the SPY is outperforming the QQQ ("risk off" environment). The return to a short-term uptrend (blue circle) illustrates the rotation back into growth during May.
IWM:QQQ
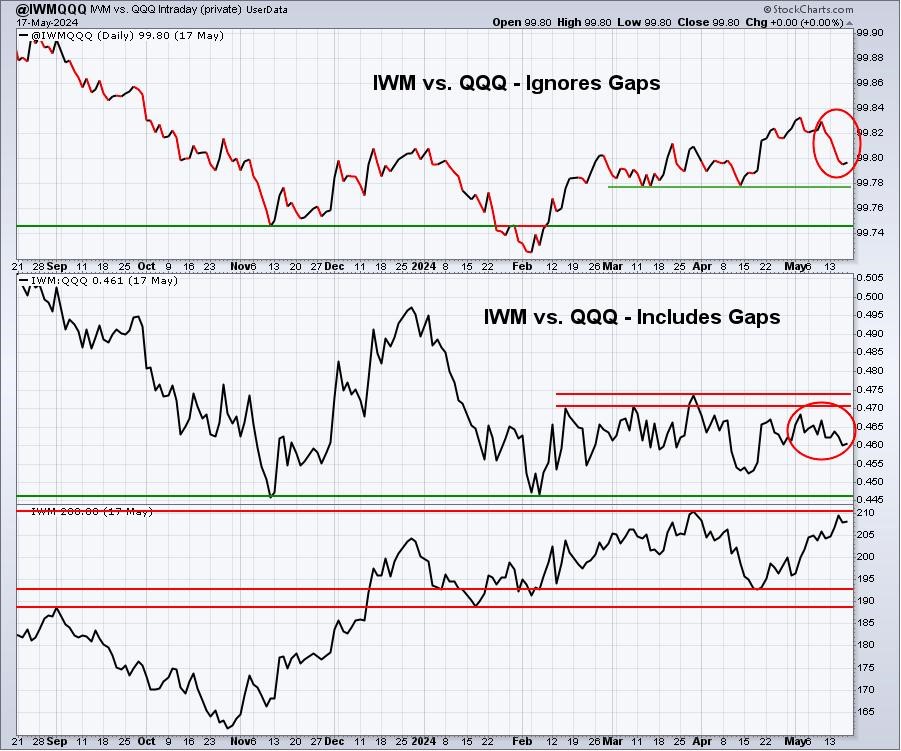
I certainly would rather see this ratio keep trending higher as further evidence of money rotating towards small caps. But the move away from value to growth also impacted small caps negatively. I'm watching the relative support level just below 99.78 (green line). A move below this line would mean that IWM's relative strength to the QQQ, on an intraday basis, would hit its lowest level in 3 months - not a great signal if you're overweight small caps, as I am at the moment.
XLY:XLP
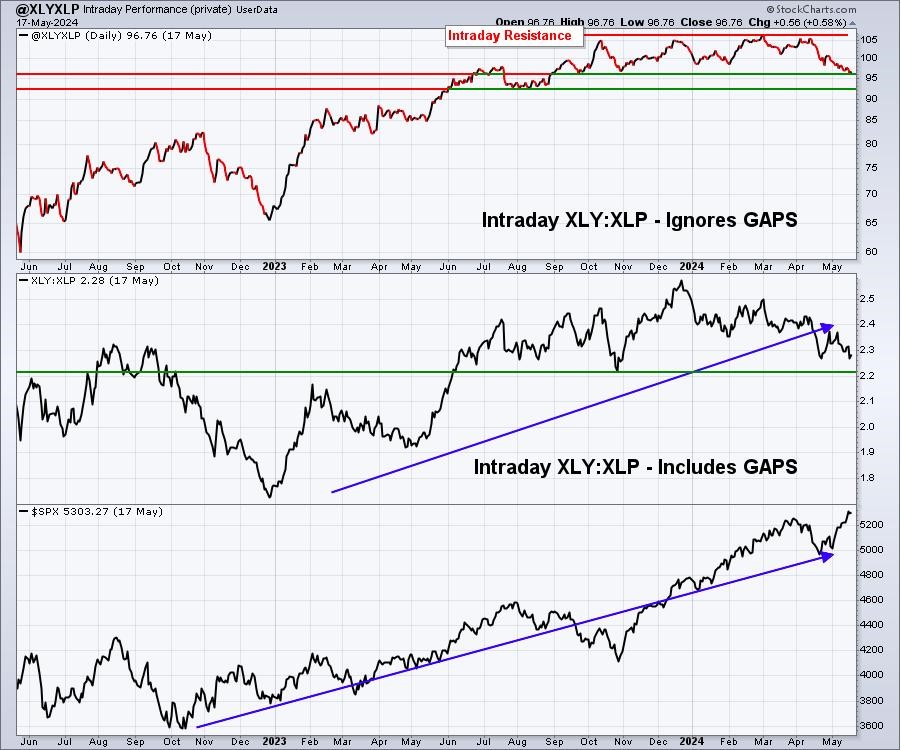
Like the IWM:QQQ, I'm watching the two relative support levels on the XLY:XLP intraday ratio. While the IWM:QQQ has more to do with my own personal weighting of investments, the XLY:XLP is one of my more important signals for overall market guidance. We would always prefer to see the XLY outperform the XLP as it tells us that investors have an appetite for risk and this risk-on mentality is what drives secular bull markets higher.
Key Sector/Industry Charts
I love the breakout last week in technology (XLK) for one very obvious reason. It's the most highly weighted sector in both the S&P 500 and NASDAQ 100. So seeing this is yet another very bullish development:
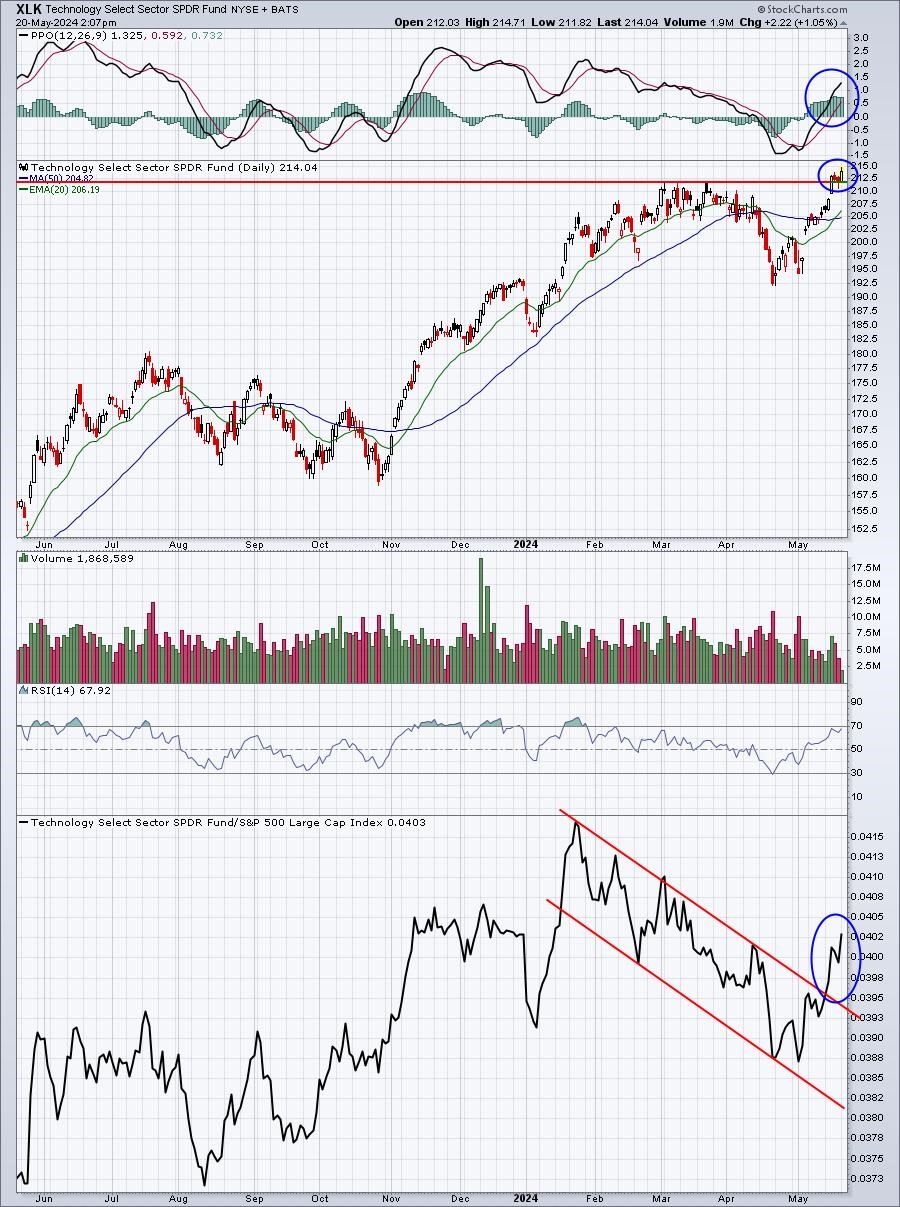
Obviously, the breakout is nice, but the bottom panel is key. As the XLK breaks out, it's regaining its relative strength vs. the benchmark S&P 500. We want to see leadership from this very aggressive sector.
Trade Setup
Since beginning this Weekly Market Report in early September, I've discussed the long-term trade candidates below that I really like. Generally, these stocks have excellent long-term track records and many pay nice dividends that mostly grow every year. Only in very specific cases (exceptions) would I consider a long-term entry into a stock that has a poor or limited long-term track record:
- JPM
- BA
- FFIV
- MA
- GS
- FDX
- AAPL
- CHRW
- JBHT
- STX
- HSY
- DIS
- MSCI
- SBUX
- KRE
- ED
- AJG
Keep in mind that our Weekly Market Reports favor those more interested in the long-term market picture. Therefore, the list of stocks above are stocks that we believe are safer (but nothing is ever 100% safe) to own with the long-term in mind. Nearly everything else we do at EarningsBeats.com favors short-term momentum trading, so I wanted to provide an explanation of what we're doing with this list.
I don't have any additions to list "long-term" list at this time.
Looking Ahead
Upcoming Earnings:
Q1 earnings are winding down as fewer and fewer of market-moving stocks will be reporting. Still, I've identified what I believe are key companies that will report this week, with their respective market caps in parenthesis. This is NOT a list of ALL companies reporting this week, so please be sure to check for earnings of any companies that you own or add. Any companies in BOLD represent stocks in one of our Portfolios:
- Monday: PANW ($102 billion)
- Tuesday: LOW ($133 billion), AZO ($50 billion)
- Wednesday: NVDA ($2.3 trillion), ADI ($106 billion), SNOW ($55 billion)
- Thursday: INTU ($183 billion), MDT ($114 billion), WDAY ($68 billion)
- Friday: None
Key Economic Reports:
- Monday: None
- Tuesday: None
- Wednesday: April existing home sales
- Thursday: Initial jobless claims, April new home sales
- Friday: April durable goods, May consumer sentiment
Historical Data
I'm a true stock market historian. I am absolutely PASSIONATE about studying stock market history to provide us more clues about likely stock market direction and potential sectors/industries/stocks to trade. While I don't use history as a primary indicator, I'm always very aware of it as a secondary indicator. I love it when history lines up with my technical signals, providing me much more confidence to make particular trades.
Below you'll find the next two weeks of historical data and tendencies across the 3 key indices that I follow most closely:
S&P 500 (since 1950)
- May 20: -12.62%
- May 21: -11.02%
- May 22: +9.71%
- May 23: -37.61%
- May 24: -8.55%
- May 25: -15.90%
- May 26: +54.11% (begins very bullish historical period through June 6)
- May 27: +57.71%
- May 28: +5.42%
- May 29: +27.35%
- May 30: +54.27%
- May 31: +27.79%
- Jun 1: +54.02%
- June 2: +36.90%
NASDAQ (since 1971)
- May 20: -18.45%
- May 21: +16.69%
- May 22: +34.73%
- May 23: -55.30%
- May 24: +9.57%
- May 25: +15.82%
- May 26: +106.29% (begins very bullish historical period through June 5)
- May 27: +160.41%
- May 28: +38.94%
- May 29: -37.73%
- May 30: +42.59%
- May 31: -8.29%
- Jun 1: +73.91%
- June 2: +131.50%
Russell 2000 (since 1987)
- May 20: -32.79%
- May 21: +88.48%
- May 22: -5.27%
- May 23: -34.29%
- May 24: -21.00%
- May 25: +38.88%
- May 26: +170.50% (begins very bullish historical period through June 5)
- May 27: +209.58%
- May 28: +2.86%
- May 29: +24.64%
- May 30: +36.13%
- May 31: +18.28%
- Jun 1: +113.13%
- June 2: +179.79%
The S&P 500 data dates back to 1950, while the NASDAQ and Russell 2000 information date back to 1971 and 1987, respectively.
Here's a quick historical analysis of the S&P 500 during May since 1950:
- May 1-5: +29.94%
- May 6-25: -12.10%
- May 26-31: +37.27%
The May 26 through June 6 period has annualized returns of +34.45%.
Here are the May 26 through June 5 annualized returns for the NASDAQ and Russell 2000:
- NASDAQ: +57.08%
- Russell 2000: +78.26%
Final Thoughts
We had another solid week last week and the secular bull market lives on as new all-time highs were seen on several key indices. The bearish historical tendencies that run from May 6 through May 25 will end this week. Thus far, we really haven't seen much typical, mid-May market weakness. We do still have a week to go, however, before moving into a much more favorably historical period from May 26 through June 5.
Here are several things to consider in the week ahead:
- Housing. Both the April existing home sales and April new home sales will be released later this week and the home construction index ($DJUSHB) is attempting to put in the right side of a cup. That'll be worth monitoring with key economic reports in the industry due out.
- Interest Rates. I'll be watching to see if the 10-year treasury yield ($TNX) remains contained beneath its 20-day EMA. If not, it could play into further short-term relative weakness for the small cap IWM.
- NVIDIA Corp: This is an enormous earnings report released on Wednesday after the bell. It's especially big for the semiconductor group ($DJUSSC) that's on the verge of yet another breakout and all-time high. NVDA is on the verge of its own breakout and all-time high and this stock has been the poster child of semiconductors over at least the past year to year and a half.
- Transports ($TRAN): After finally looking somewhat better technically, the transports tumbled again last week and a key 20-day EMA test is upon the group. If May strength is the beginning of a much larger uptrend for transports, it very likely will need to hold its now-rising 20-day EMA, currently at 15,449.52.
- Cryptocurrencies. This asset class, led by bitcoin ($BTCUSD), appears to be trending higher once again. If I had to make an educated guess, I'd say that bitcoin has a decent chance of hitting 100,000 by year end. I would only be concerned if bitcoin were to lose recent price support from 56,000-57,000. Otherwise, I'm expecting higher price action ahead.
- Copper ($COPPER). I know gold ($GOLD) and silver ($SILVER) are grabbing all of the headlines, but the performance in copper is the most encouraging to me. Copper is the one industrial metal that signals economic strength or weakness ahead. And copper just broke to an all-time high.
Feedback
If you'd like to share your thoughts on our Weekly Market Report, positive or negative, you can reach us at "[email protected]".
Happy trading!
Tom