
EB Weekly Market Report - Monday, June 3, 2024 (Spring Special Extended!)
Spring Special EXTENDED
We've had a great response to our Spring Special, so thanks to everyone who used this opportunity to extend your membership at our lowest price of the year! We do not want to leave any member behind, so we've extended for two more days to make sure everyone has ample opportunity to lock in savings. CLICK HERE for more details!
ChartLists Updated
Here are the ChartLists that were updated over the weekend and have been posted to our website.
- Strong Earnings (SECL)
- Strong Future Earnings (SFECL)
- Raised Guidance (RGCL)
- Bullish Trifecta (BTCL)
- Short Squeeze (SSCL)
- June Seasonality (SEASCL)
- Upcoming Earnings - 5 ChartLists
- Upcoming Earnings - Relative Strength
Weekly Market Recap
Major Indices
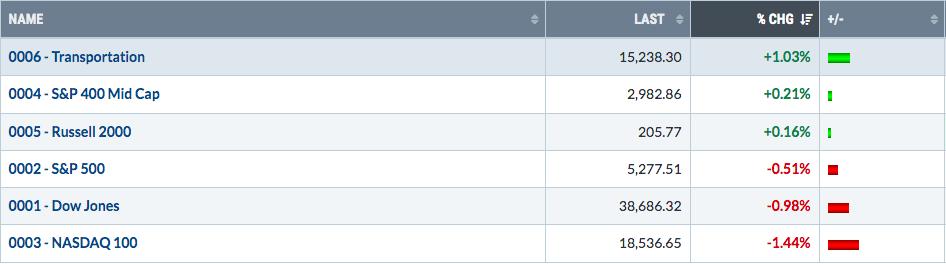
It's been a LONG while since we've seen transports ($TRAN) take on a leadership role, but that's what happened last week, especially into the close on Friday. However, we've seen little follow through to start this week, so it's probably wise not to get too bullish too early. There'll be plenty of opportunities within this area of the market AFTER we get confirmed bullish breakouts.
Sectors
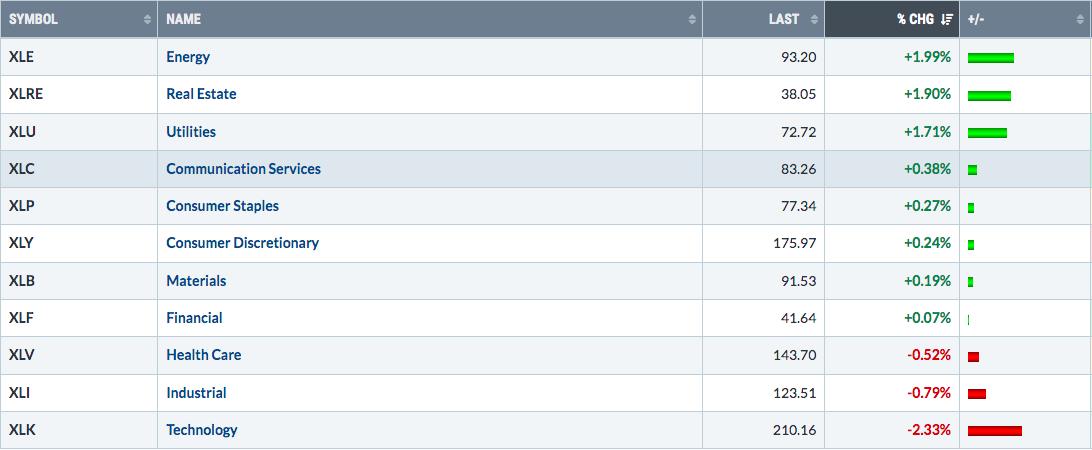
There was plenty of rotation OUT of technology (XLK) last week. Today, we saw the group spike higher at the opening bell, but there's been more selling today after that solid open. One week's rotation doesn't make a market, but it's worth noting that energy, real estate and utilities - neutral and defensive sectors - were the beneficiaries of last week's rotation.
Top 10 Industries Last Week
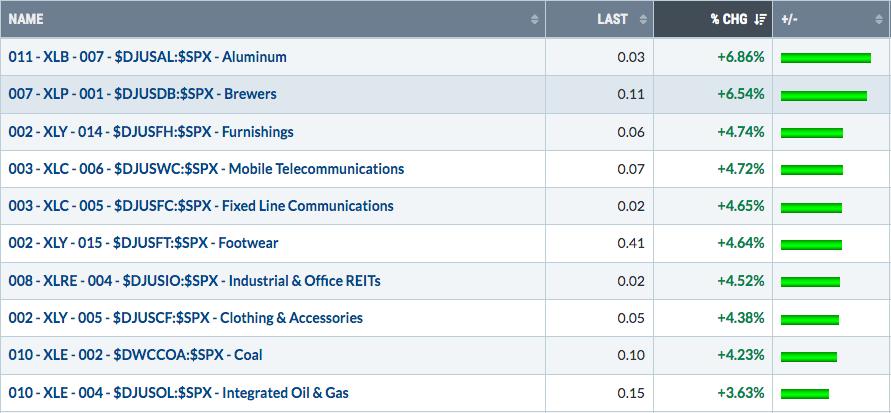
Footwear ($DJUSFT) had a very strong week and appears to be breaking a downtrend line that began in December 2023:
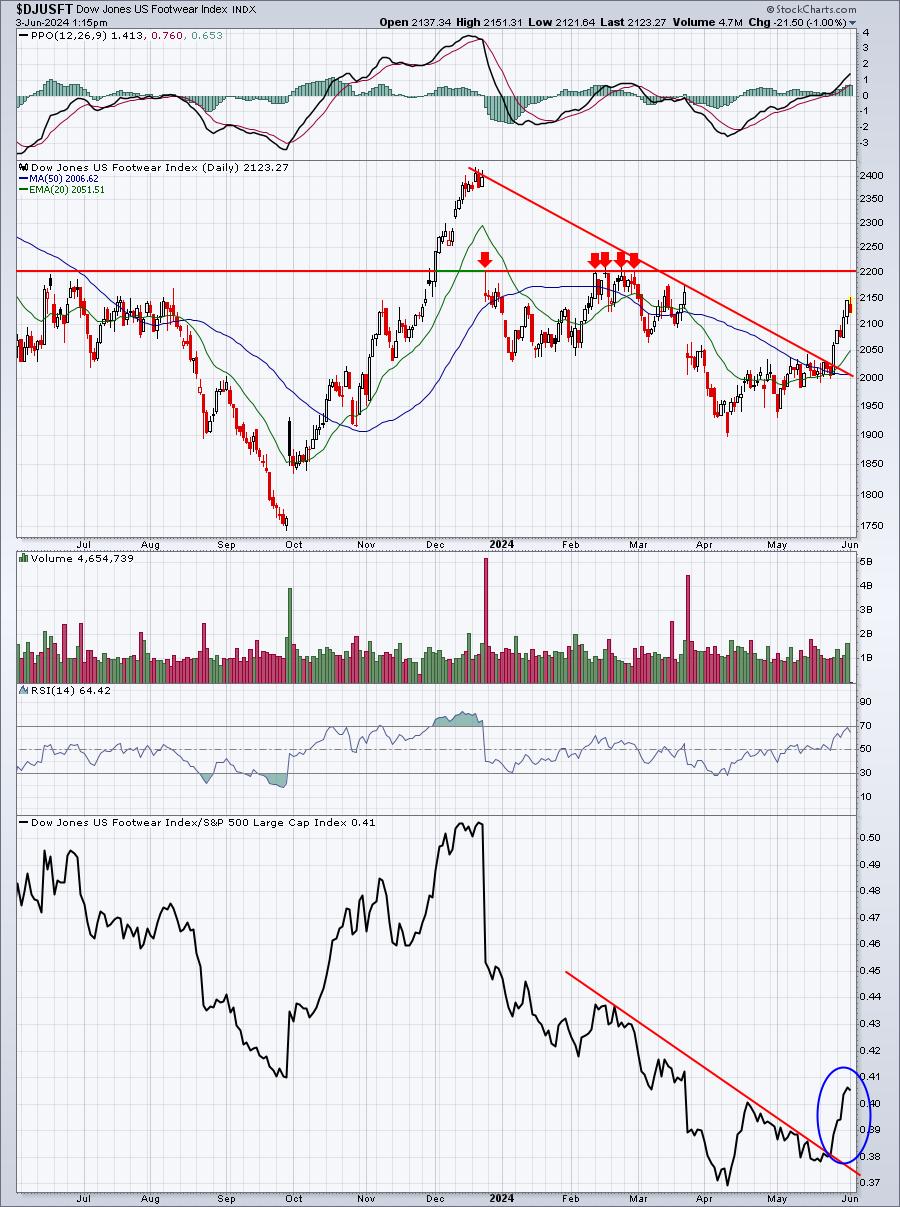
Any time a stock or area of the market is in an extended downtrend, there's lots of work to repair all the technical issues. But the first one is normally to begin breaking trendlines and showing relative strength. Check and check last week. From a price perspective, I believe the DJUSFT must clear overhead resistance at 2200. The red arrows mark several failures at that level
Bottom 10 Industries Last Week
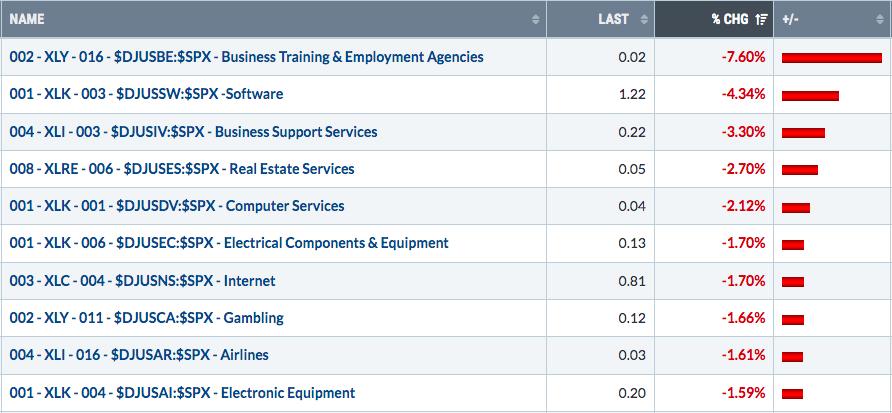
Internet ($DJUSNS) is a key group in terms of growth stocks. When they're rolling to the upside, it's usually a very bullish signal for the overall market. Currently, however, the DJUSNS is pausing above key price support and the rising 50-day SMA:
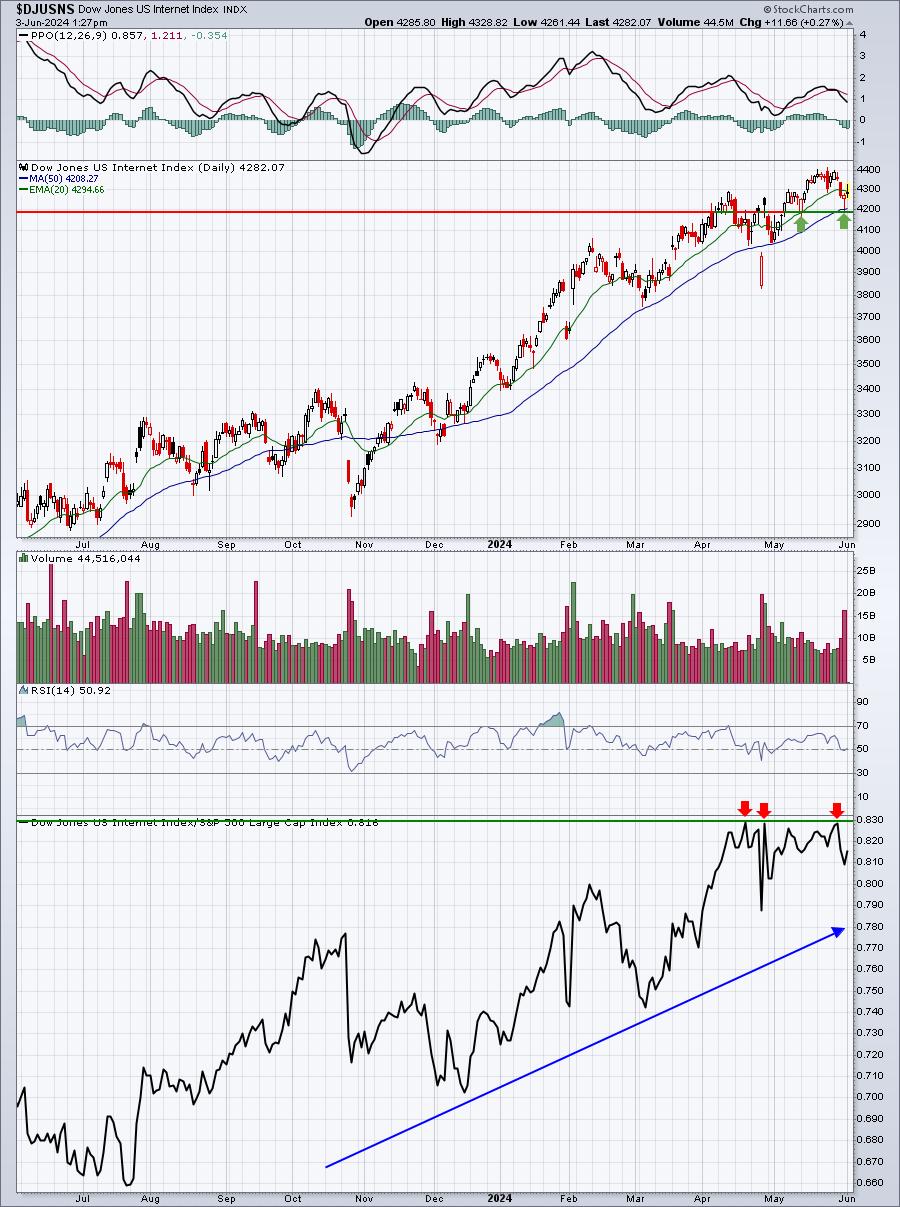
Internet clearly has been a very strong group and a leader. Here's what I'd be looking for. From a bearish perspective, the DJUSNS would need to lose recent support just below 4200. That could encourage further selling near-term. From a bullish perspective, I'd watch that relative strength resistance near 0.83. We have struggled for 6-7 weeks, attempting to make that relative breakout. Should the group eventually make that relative breakout, it could be a signal of further strength ahead as money rotates towards more growth-oriented areas.
Top 10 Stocks - S&P 500/NASDAQ 100
Bottom 10 Stocks - S&P 500/NASDAQ 100
Big Picture
Last week's up and down is nothing more than "noise" from a long-term perspective. There was nothing that suggests we're going to take off and nothing suggesting we're heading for an imminent correction or cyclical bear market. I'm continuing to view this long-term secular bull market uptrend as a signal that we're heading higher later this year, though pullbacks may occur at any time:
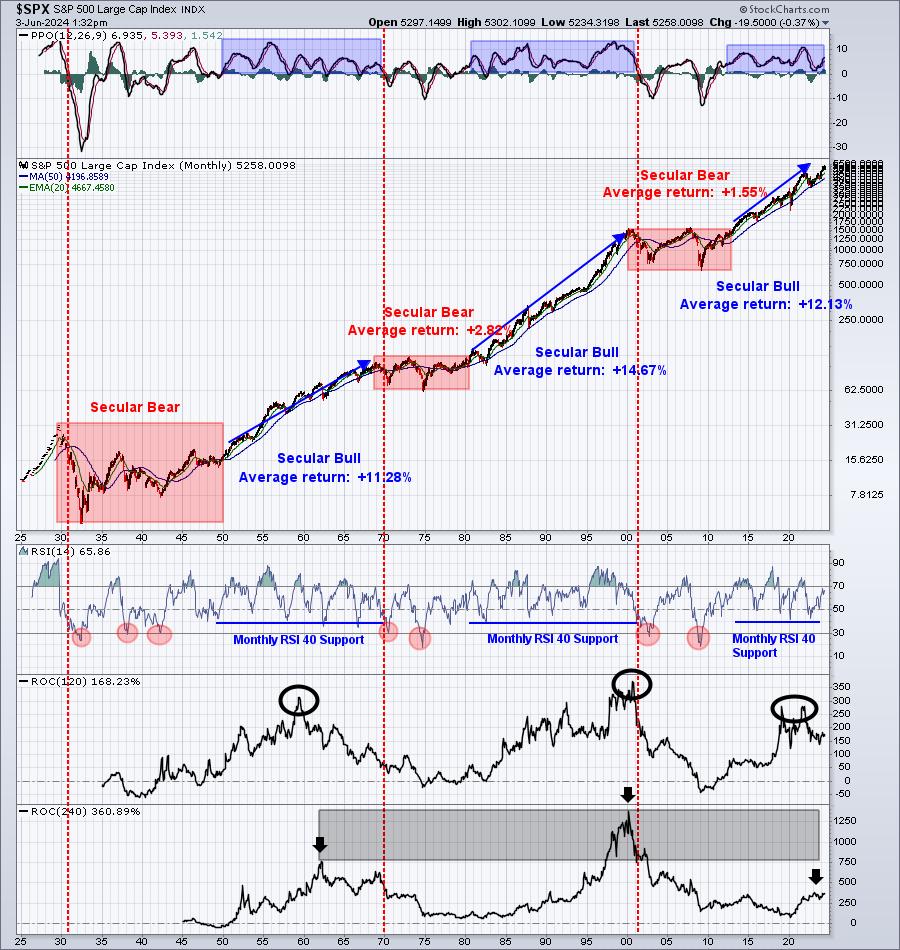
We review this chart every single week for a reason. There is always so much negativity in the news and we hear reasons why stocks have topped and can't go higher. Etch this chart inside your mind and only give up on higher prices ahead when there are an overwhelming number of reasons to do so.
Rotation/Intermarket Analysis
Here's the latest look at our key intraday ratios as we follow where the money is traveling on an INTRADAY basis (ignoring gaps):
QQQ:SPY
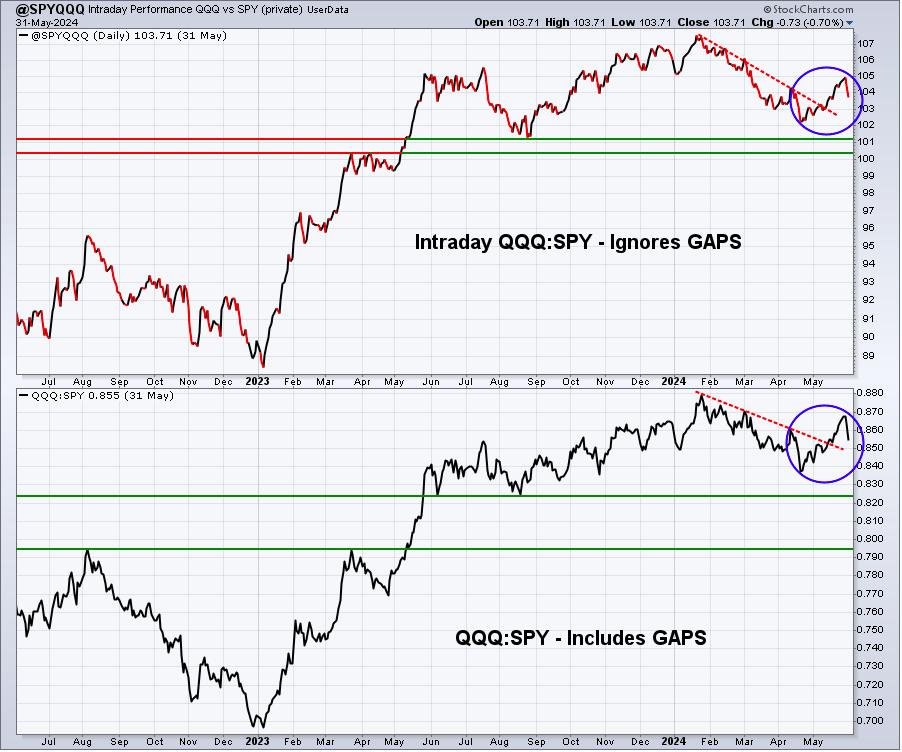
First, a quick reminder. While this chart is named "@SPYQQQ", it's actually the QQQ divided by the SPY. When this line is rising, it means the QQQ is outperforming the SPY ("risk on" environment). When it's falling, it means the SPY is outperforming the QQQ ("risk off" environment). The return to a short-term uptrend (blue circle) illustrates the rotation back into growth during May, breaking the prior relative downtrend line. We did end May, however, with a bit of rotation back towards the S&P 500. We'll continue to monitor that relationship this week.
IWM:QQQ
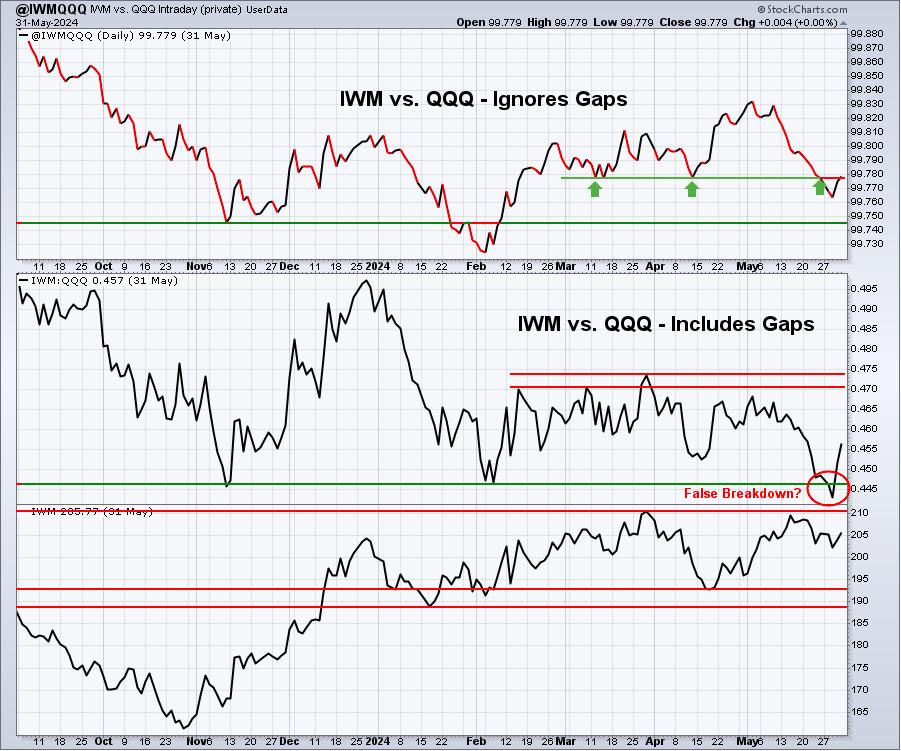
Last week, I wanted to see a relative bounce in this IWM:QQQ ratio, indicating that small caps remain in play on a relative basis. We did get that as we closed out the week, but this group remains under pressure on a relative basis. Today is once again perplexing as the 10-year treasury yield ($TNX) has dropped 12 basis points and is beneath 4.40%, yet small caps are not only down, but underperforming. I still remain firmly in the camp that lower interest rates will benefit small caps in time, but today's action is disappointing.
XLY:XLP
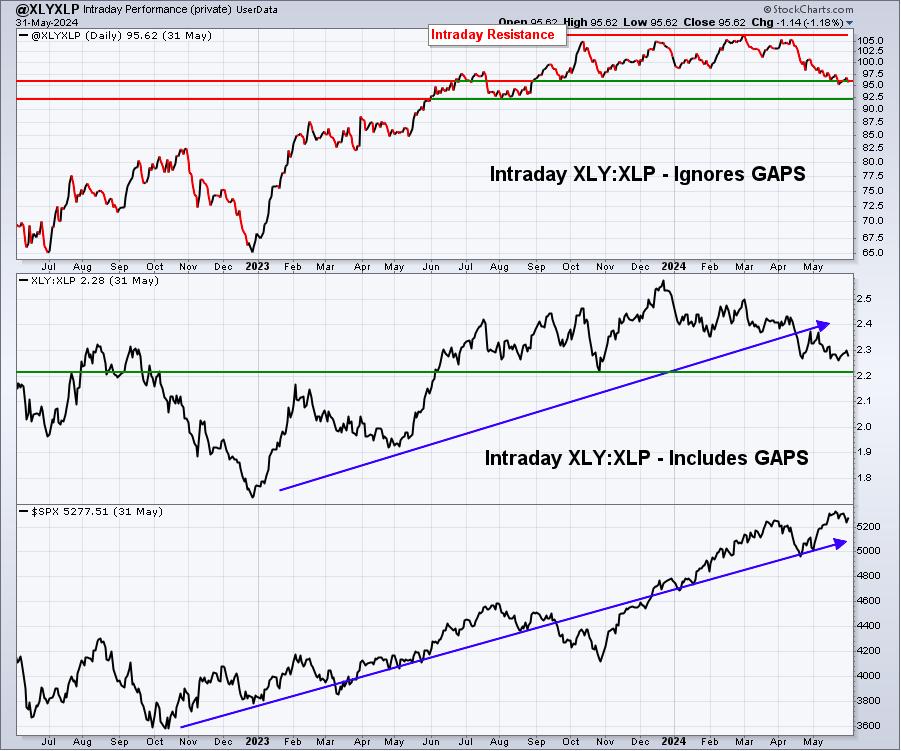
I always look at this ratio from a long-term perspective and try not to read too much into short-term developments. If we do that now, then this XLY:XLP relationship is still fine. The recent relative trend lower is contained thus far at relative support. But a rebound sooner rather that later would make me feel a whole lot better about any attempted or actual rally in the benchmark S&P 500. As I mentioned in the June Seasonality Report over the weekend, the XLY shows its most outperformance vs. its aggressive sector peers in June. If we see similar action now, it couldn't come at a much better time.
Sentiment
Volatility
The Volatility Index ($VIX) topped just below 15 last Thursday and has been working its way back down since. Another trip in the VIX below 13 would certainly be a short-term bullish development as the S&P 500 has a history of performing its absolute best when the VIX resides below 13. Currently, the VIX is at 13.57.
Equity Only Put Call Ratio ($CPCE)
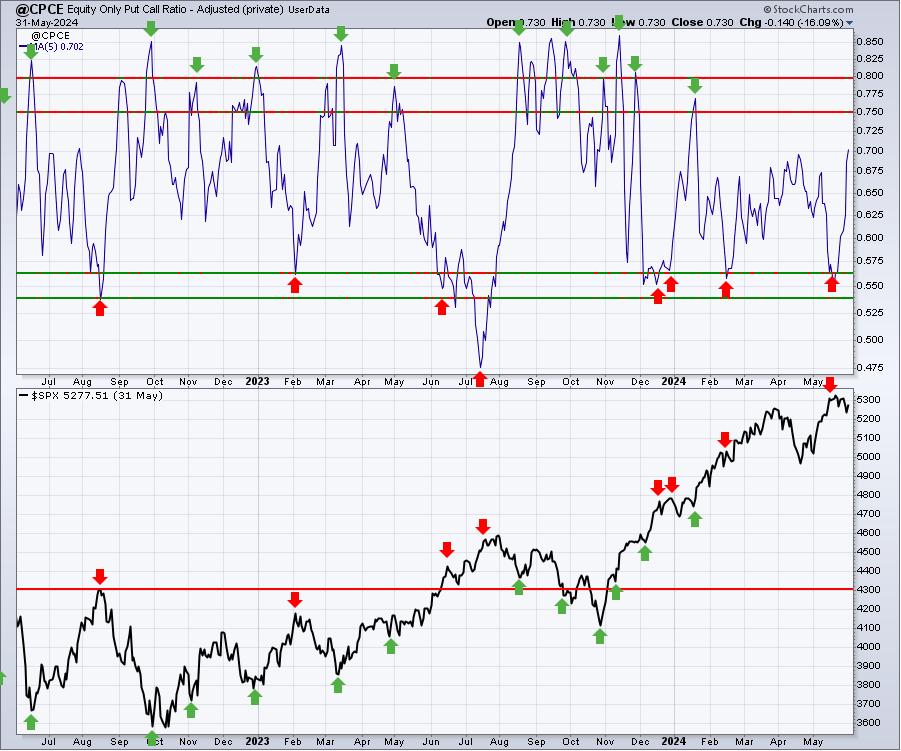
Recently, the 5-day SMA of the CPCE reached a low close to .55, which suggests that retail options traders grew quite bullish. Because this is a contrarian indicator, I look for the possibility of short-term market weakness. This sentiment indicator is what I refer to as my "speed boat" signal as it typically provides only a very short-term warning. We've already seen some weakness and hesitation in stock prices since this signal flashed.
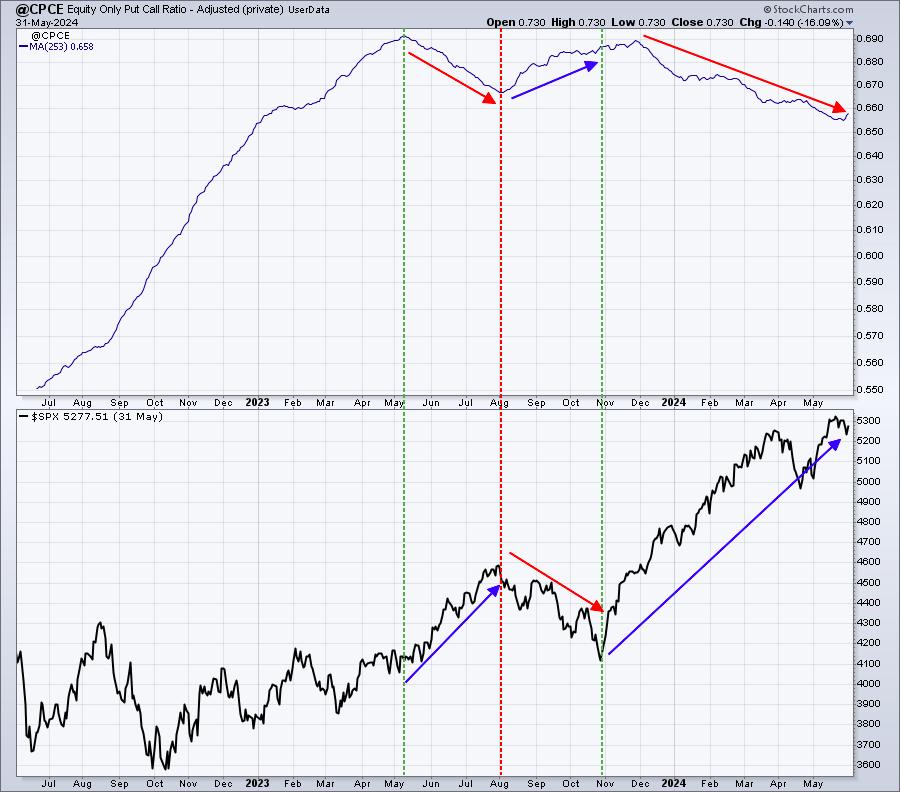
I also have my "ocean liner" signal, which takes much, much longer to send signals. And when we do get a signal, it's typically a signal to remember for months, or even years, not simply the next few days. This 253-day SMA of the CPCE initially topped in May 2023. Since rolling over, the S&P 500 has gained roughly 25% in just a year. As this 253-day SMA drops further, it'll very likely accompany rising U.S. equity prices:
Trade Setup
Since beginning this Weekly Market Report in early September, I've discussed the long-term trade candidates below that I really like. Generally, these stocks have excellent long-term track records and many pay nice dividends that mostly grow every year. Only in very specific cases (exceptions) would I consider a long-term entry into a stock that has a poor or limited long-term track record:
- JPM
- BA
- FFIV
- MA
- GS
- FDX
- AAPL
- CHRW
- JBHT
- STX
- HSY
- DIS
- MSCI
- SBUX
- KRE
- ED
- AJG
Keep in mind that our Weekly Market Reports favor those more interested in the long-term market picture. Therefore, the list of stocks above are stocks that we believe are safer (but nothing is ever 100% safe) to own with the long-term in mind. Nearly everything else we do at EarningsBeats.com favors short-term momentum trading, so I wanted to provide an explanation of what we're doing with this list.
I don't have any additions to list "long-term" list at this time.
Looking Ahead
Upcoming Earnings:
Q1 earnings continue to wind down, but we will see a pick up in the number of software companies reporting this week. I've identified what I believe are key companies that will report this week, with their respective market caps in parenthesis. This is NOT a list of ALL companies reporting this week, so please be sure to check for earnings of any companies that you own or add. Any companies in BOLD represent stocks in one of our Portfolios:
- Monday: None
- Tuesday: CRWD ($76 billion)
- Wednesday: LULU ($38 billion), DLTR ($25 billion)
- Thursday: None
- Friday: None
Key Economic Reports:
- Monday: May PMI manufacturing index, May ISM manufacturing index, April construction spending
- Tuesday: April factory orders
- Wednesday: May ADP employment report, May PMI composite, May ISM services index
- Thursday: Initial jobless claims, Q1 productivity and costs (unit labor costs)
- Friday: May nonfarm payrolls, April wholesale inventories
Historical Data
I'm a true stock market historian. I am absolutely PASSIONATE about studying stock market history to provide us more clues about likely stock market direction and potential sectors/industries/stocks to trade. While I don't use history as a primary indicator, I'm always very aware of it as a secondary indicator. I love it when history lines up with my technical signals, providing me much more confidence to make particular trades.
Below you'll find the next two weeks of historical data and tendencies across the 3 key indices that I follow most closely:
S&P 500 (since 1950)
- Jun 3: +3.68%
- Jun 4: -1.79%
- Jun 5: +43.13%
- Jun 6: +56.57%
- Jun 7: +3.97%
- Jun 8: -18.56%
- Jun 9: -63.85%
- Jun 10: +9.24%
- Jun 11: -18.03%
- Jun 12: +6.41%
- Jun 13: +10.90%
- Jun 14: -12.57%
- Jun 15: +18.27%
- Jun 16: +23.94%
NASDAQ (since 1971)
- Jun 3: -71.71%
- Jun 4: +81.57%
- Jun 5: +97.21%
- Jun 6: -12.84%
- Jun 7: +19.62%
- Jun 8: -18.14%
- Jun 9: -49.37%
- Jun 10: -7.29%
- Jun 11: -73.20%
- Jun 12: -3.70%
- Jun 13: -1.85%
- Jun 14: -24.03%
- Jun 15: +45.66%
- Jun 16: +55.20%
Russell 2000 (since 1987)
- Jun 3: -43.34%
- Jun 4: +54.73%
- Jun 5: +77.47%
- Jun 6: +2.16%
- Jun 7: +44.43%
- Jun 8: +1.50%
- Jun 9: -63.05%
- Jun 10: -56.95%
- Jun 11: -163.36%
- Jun 12: -36.14%
- Jun 13: -22.45%
- Jun 14: -27.34%
- Jun 15: +84.42%
- Jun 16: +10.36%
The S&P 500 data dates back to 1950, while the NASDAQ and Russell 2000 information date back to 1971 and 1987, respectively.
The S&P 500, during May 26 through June 6, has produced annualized returns of +34.45% since 1950.
Here are the May 26 through June 5 annualized returns for the NASDAQ and Russell 2000:
- NASDAQ: +57.08%
- Russell 2000: +78.26%
Final Thoughts
There were ups and downs in the stock market last week, but the sector rotation was not favorable. It's only one week, but we have seen rotation to more value-oriented areas throughout much of 2024, especially since February. For U.S. equities to enjoy another solid run to the upside, we'll need to see a return to leadership in the technology (XLK) area.
Here are several things to consider in the week ahead:
- Jobs Report. Currently, the estimate for May nonfarm payrolls is 195,000, slightly above April's 175,000. We don't want horrible news - like jobs turning negative - but a slightly disappointment somewhere around the April number wouldn't be bad, in my opinion. We want to show that the economy is resilient, but perhaps weakening slightly.
- Interest Rates ($TNX). The ADP employment report on Wednesday, along with the May nonfarm payrolls report on Friday, can move the bond and stock markets. It would likely be good for stocks to keep the TNX below 4.70%, and would be particularly bullish if the TNX were to fall back below the 4.20%-4.30% yield support area.
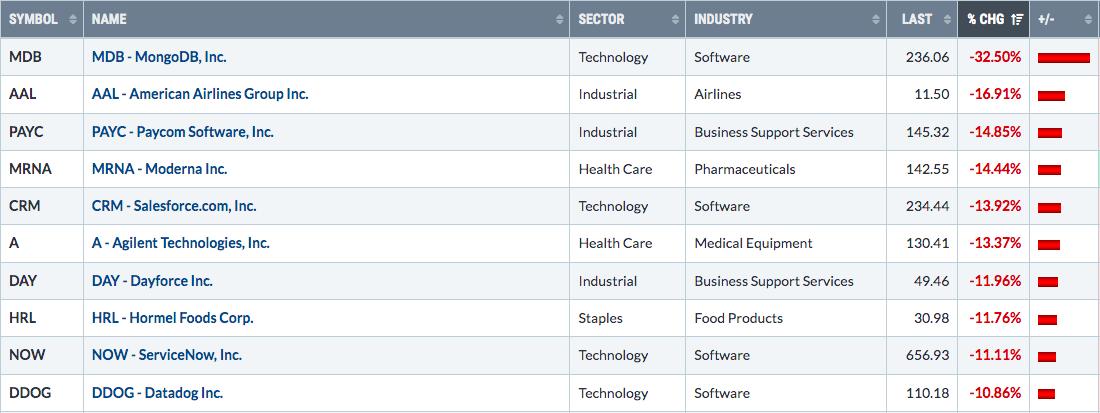
- Earnings. This will be a very boring week of earnings as I see CrowdStrike Holdings (CRWD) as the only stock that might produce a strong impact on prices, particularly in the software space ($DJUSSW). Earnings reports in software have not been received very well this quarter. Overall, the AD line and relative strength has been solid for CRWD, so perhaps we'll get a much-better-than-expected report. We'll find out on Tuesday after the close.
- Inflation/The Fed. This one goes without saying and we're going to begin FedWatch soon as we have another meeting next week. Key inflation reports will be out on Wednesday, June 12th (May CPI) and Thursday, June 13th (May PPI). Interestingly, that CPI report will be released in the morning on the second day of the Fed meeting. Next Wednesday (June 12) could be a WILD day of trading.
Feedback
If you'd like to share your thoughts on our Weekly Market Report, positive or negative, you can reach us at "[email protected]".
Happy trading!
Tom