
EB Weekly Market Report - Monday, June 10, 2024
ChartLists
ChartLists were not updated over the weekend as I was traveling. However, there wasn't a whole lot to update. I'll get everything updated this weekend.
Weekly Market Recap
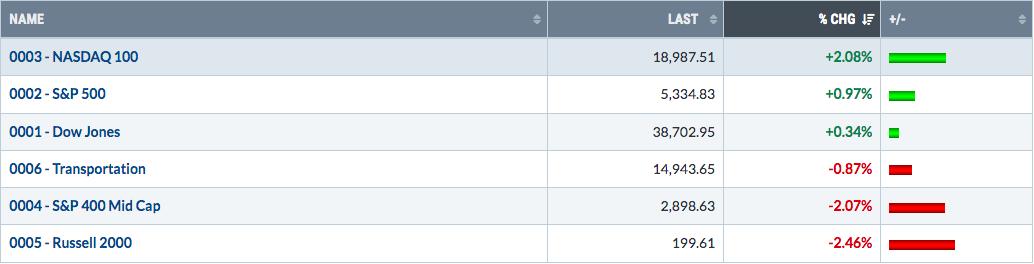
Major Indices
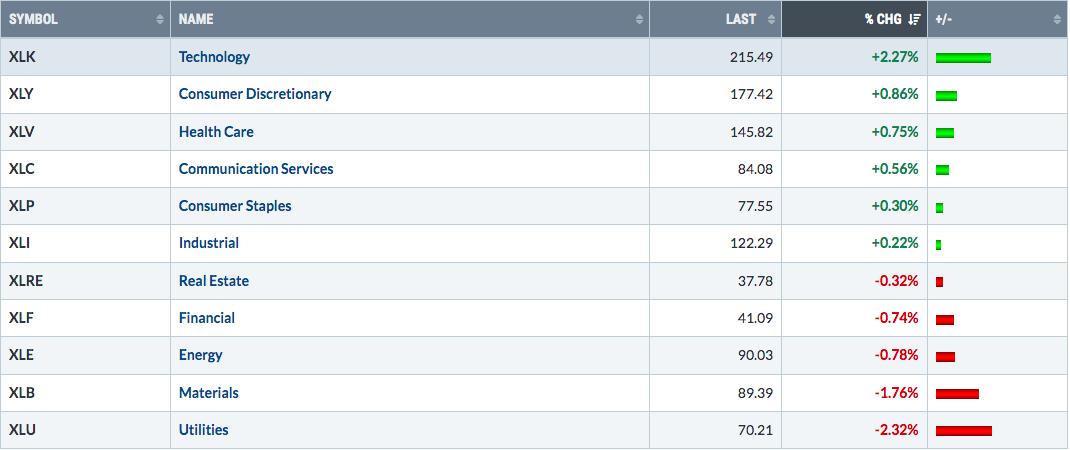
Sectors
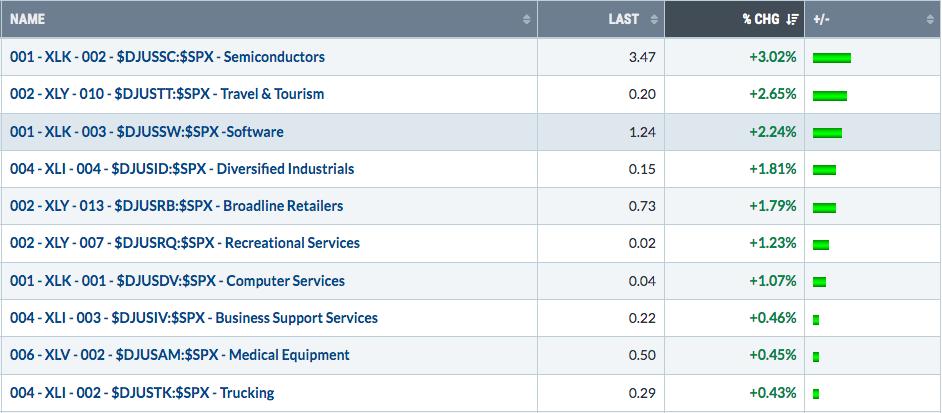
Top 10 Industries Last Week
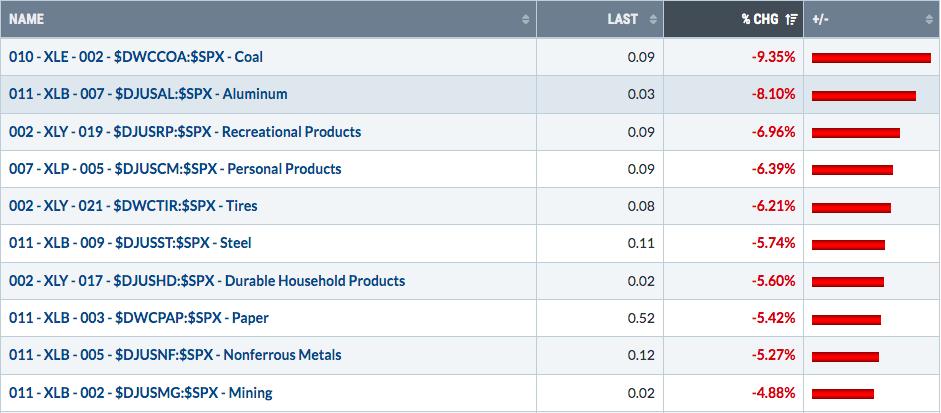
Bottom 10 Industries Last Week
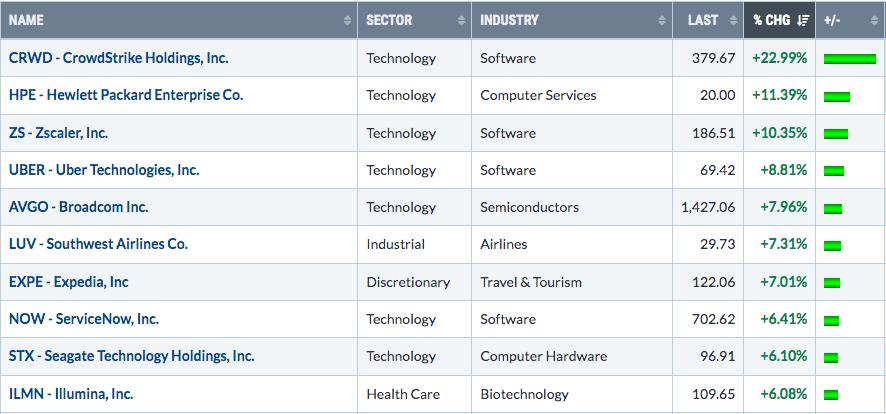
Top 10 Stocks - S&P 500/NASDAQ 100
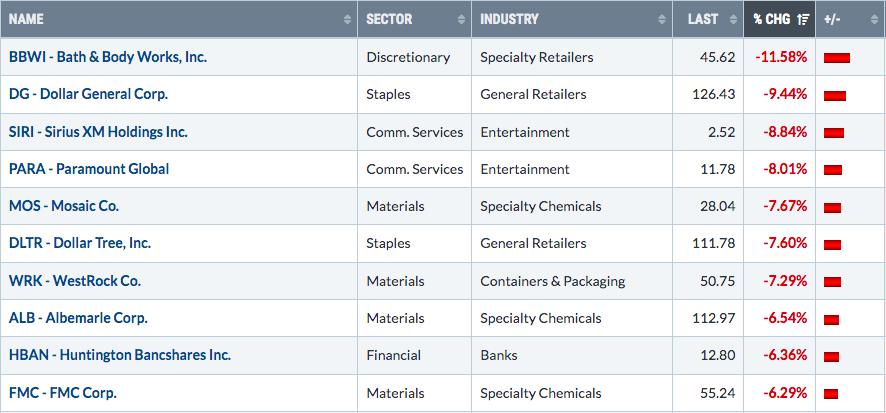
Bottom 10 Stocks - S&P 500/NASDAQ 100
Big Picture
Here's an update of the Big Picture, 100-year chart of the S&P 500:
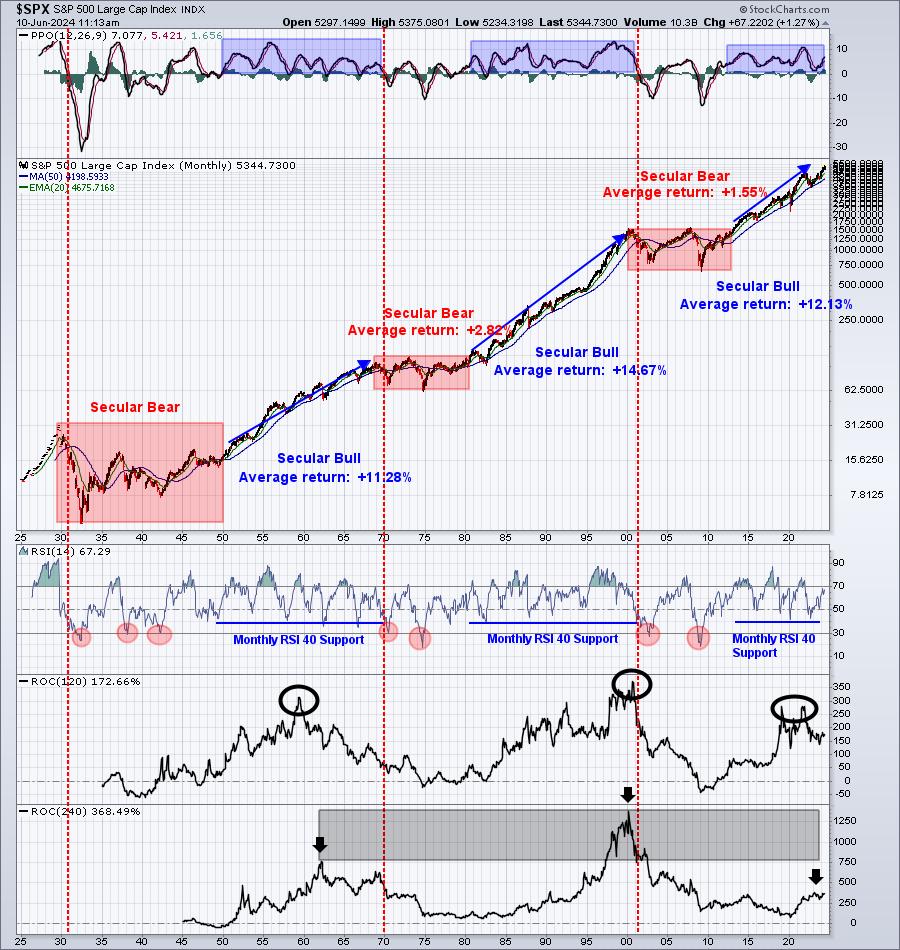
We witnessed more all-time highs last week, again reinforcing the notion to stick to the long side of secular bull market advances. Bet against them at your own risk.
Rotation/Intermarket Analysis
Here's the latest look at our key intraday ratios as we follow where the money is traveling on an INTRADAY basis (ignoring gaps):
QQQ:SPY
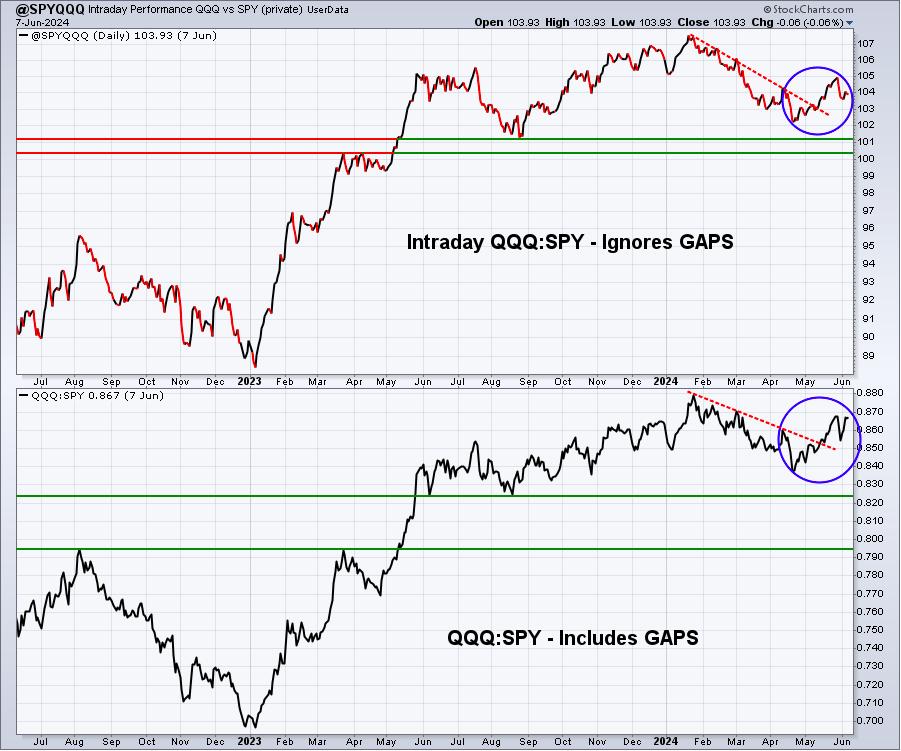
This ratio is strengthening (blue circles), suggesting we remain in a "risk-on" market environment, which is bullish.
IWM:QQQ
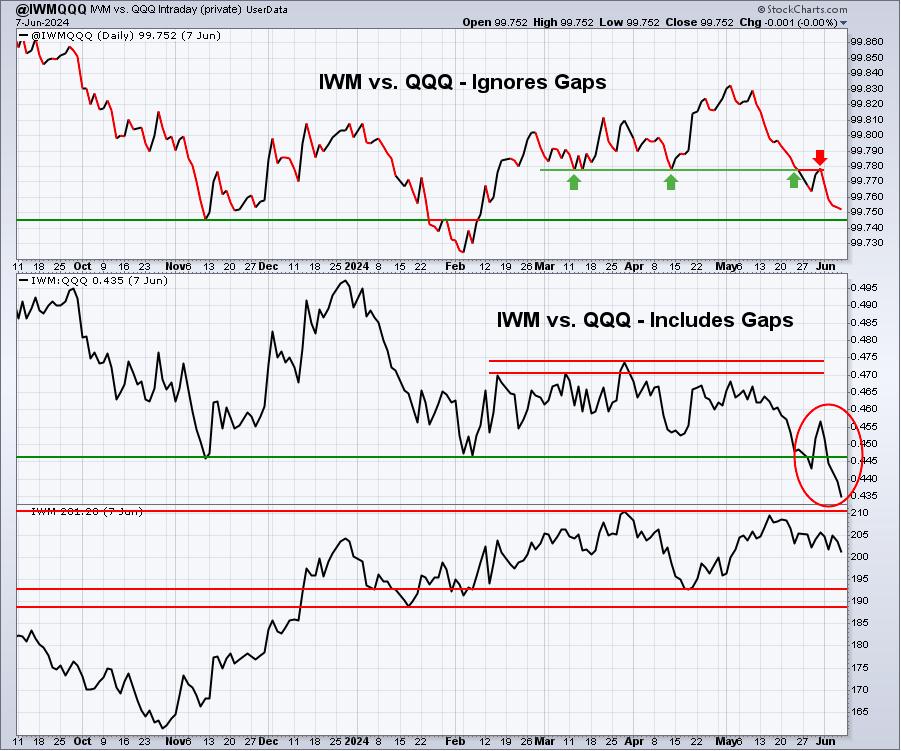
Small caps continue to underperform their larger counterparts. During much of 2024, we've seen small caps outperform when the 10-year treasury yield ($TNX) is under pressure. That hasn't been the case recently, however, which is concerning.
XLY:XLP
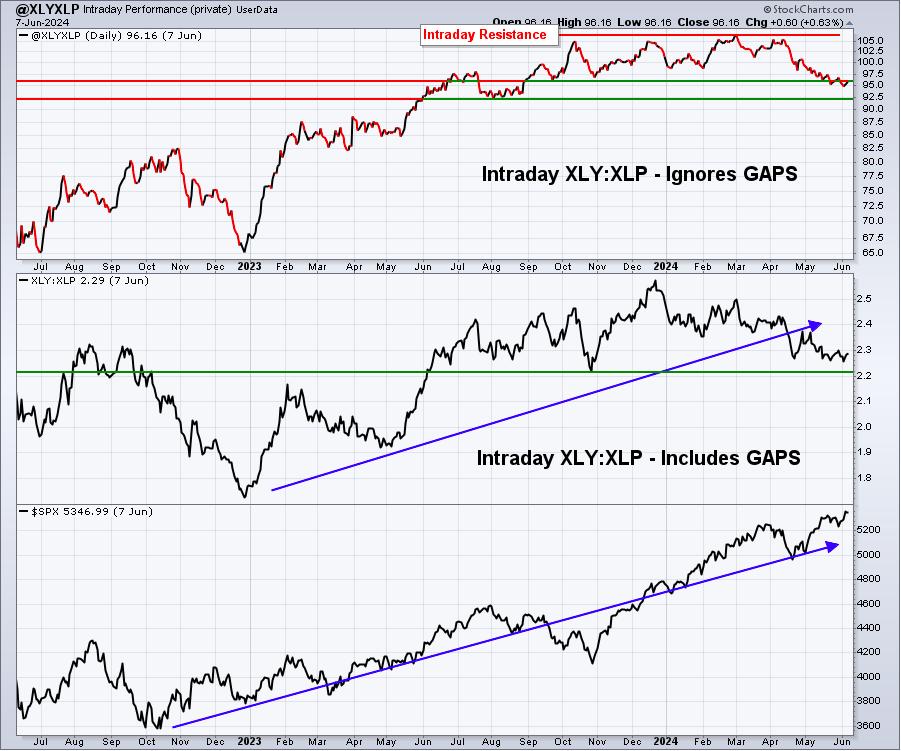
There wasn't much change in this XLY:XLP ratio last week. Clearly, a move back to the upside is what we want to see here. I've provided support levels to watch on both ratios. As long as we remain above these support levels, I'm okay with the XLY:XLP. There's no doubt, however, that these ratios rising would provide a much more bullish view on market action.
Sentiment
Volatility
The Volatility Index ($VIX) jumped a bit at today's opening bell, but has since retreated back to 12.86 - below the key 13 level. The VIX is priced to suggest we're going higher on the S&P 500.
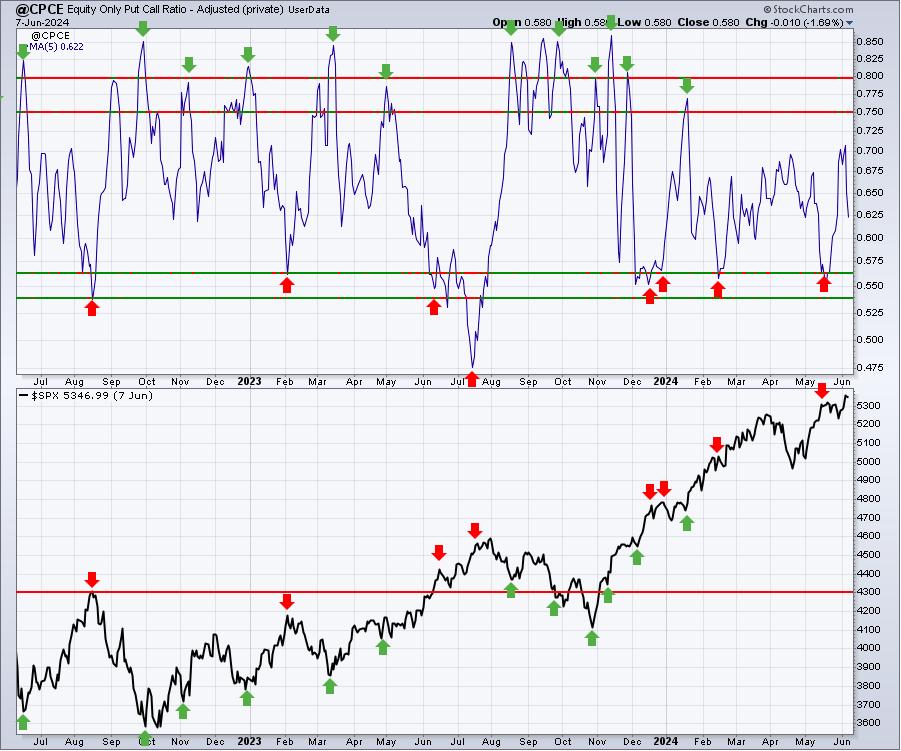
Equity Only Put Call Ratio ($CPCE)
The 5-day SMA of the CPCE is in neutral territory. The last signal provided was the complacent, bullish reading of 0.56 in mid-May. Of course, the CPCE indicator is CONTRARIAN, so when this 5-day SMA is in bullish territory in the 0.54 or 0.56 range, or below, it actually indicates we should be on the lookout for short-term weakness. The S&P 500 did drop about 2% after that last reading. Right now, it's telling us little.
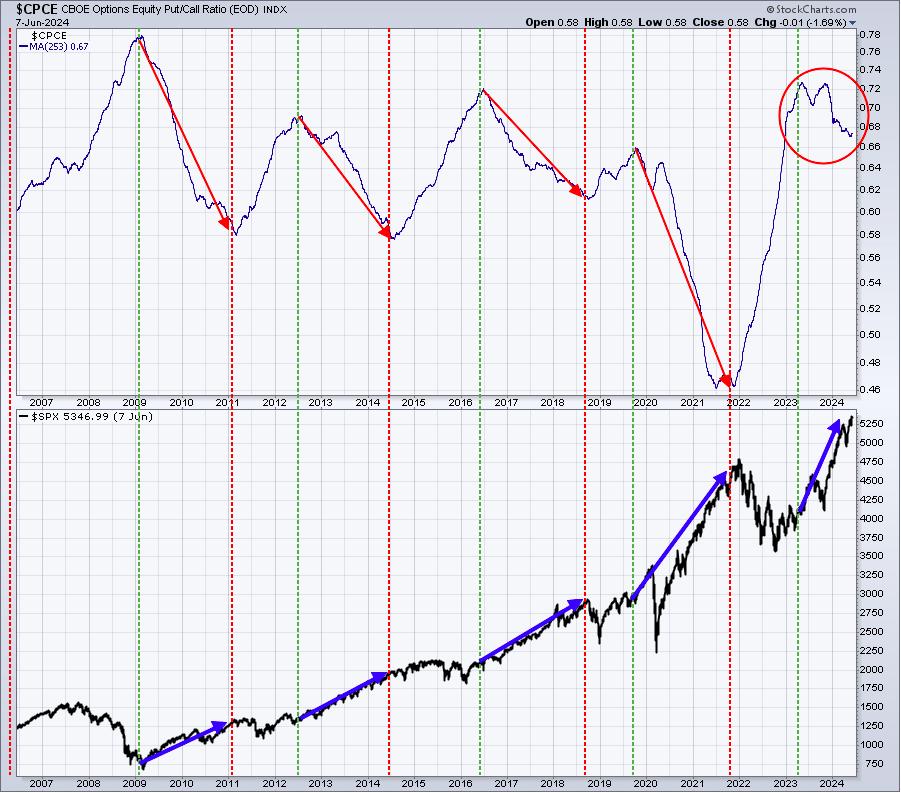
The 253-day SMA of the CPCE doesn't change often, which makes it easier to stick with a bullish or bearish theme longer. The direction of this 253-day SMA is very important and has been amazingly accurate in predicting the S&P 500 direction. Currently, it suggests we're going much higher on the S&P 500 as this long-term moving average remains squarely in an obvious downtrend:
Trade Setup
Since beginning this Weekly Market Report in early September, I've discussed the long-term trade candidates below that I really like. Generally, these stocks have excellent long-term track records and many pay nice dividends that mostly grow every year. Only in very specific cases (exceptions) would I consider a long-term entry into a stock that has a poor or limited long-term track record:
- JPM
- BA
- FFIV
- MA
- GS
- FDX
- AAPL
- CHRW
- JBHT
- STX
- HSY
- DIS
- MSCI
- SBUX
- KRE
- ED
- AJG
Keep in mind that our Weekly Market Reports favor those more interested in the long-term market picture. Therefore, the list of stocks above are stocks that we believe are safer (but nothing is ever 100% safe) to own with the long-term in mind. Nearly everything else we do at EarningsBeats.com favors short-term momentum trading, so I wanted to provide an explanation of what we're doing with this list.
I don't have any additions to list "long-term" list at this time.
Looking Ahead
Upcoming Earnings:
Outside of the 3 large technology companies listed below, there is little happening in terms of earnings. I've identified what I believe are key companies that will report this week, with their respective market caps in parenthesis. This is NOT a list of ALL companies reporting this week, so please be sure to check for earnings of any companies that you own or add. Any companies in BOLD represent stocks in one of our Portfolios:
- Monday: None
- Tuesday: ORCL ($339 billion)
- Wednesday: AVGO ($649 billion)
- Thursday: ADBE ($205 billion)
- Friday: None
Key Economic Reports:
- Monday: None
- Tuesday: FOMC meeting begins
- Wednesday: May CPI, FOMC policy statement at 2pm ET
- Thursday: Initial jobless claims, May PPI
- Friday: June consumer sentiment
Historical Data
I'm a true stock market historian. I am absolutely PASSIONATE about studying stock market history to provide us more clues about likely stock market direction and potential sectors/industries/stocks to trade. While I don't use history as a primary indicator, I'm always very aware of it as a secondary indicator. I love it when history lines up with my technical signals, providing me much more confidence to make particular trades.
Below you'll find the next two weeks of historical data and tendencies across the 3 key indices that I follow most closely:
S&P 500 (since 1950)
- Jun 10: +9.24%
- Jun 11: -18.03%
- Jun 12: +6.41%
- Jun 13: +10.90%
- Jun 14: -12.57%
- Jun 15: +18.27%
- Jun 16: +23.94%
- Jun 17: +14.98%
- Jun 18: -24.13%
- Jun 19: -13.07%
- Jun 20: -22.82%
- Jun 21: +14.57%
- Jun 22: -25.23%
- Jun 23: -8.82%
NASDAQ (since 1971)
- Jun 10: -7.29%
- Jun 11: -73.20%
- Jun 12: -3.70%
- Jun 13: -1.85%
- Jun 14: -24.03%
- Jun 15: +45.66%
- Jun 16: +55.20%
- Jun 17: +23.65%
- Jun 18: -56.99%
- Jun 19: +31.68%
- Jun 20: -42.67%
- Jun 21: +18.15%
- Jun 22: -33.43%
- Jun 23: +13.79%
Russell 2000 (since 1987)
- Jun 10: -56.95%
- Jun 11: -163.36%
- Jun 12: -36.14%
- Jun 13: -22.45%
- Jun 14: -27.34%
- Jun 15: +84.42%
- Jun 16: +10.36%
- Jun 17: +12.59%
- Jun 18: -38.03%
- Jun 19: -8.37%
- Jun 20: -68.83%
- Jun 21: +29.20%
- Jun 22: -75.31%
- Jun 23: -8.12%
The S&P 500 data dates back to 1950, while the NASDAQ and Russell 2000 information date back to 1971 and 1987, respectively.
Final Thoughts
Both the S&P 500 and NASDAQ 100 set new all-time highs last week and strength was felt in technology (XLK), specifically semiconductors ($DJUSSC) and software ($DJUSSW). Health care (XLV) also performed well, led by biotechnology ($DJUSBT) and medical equipment ($DJUSAM). Rotation definitely favored the more aggressive areas of the stock market. Will we be able to do the same this week with a Fed meeting and inflation news on deck?
Here are several things to consider in the week ahead:
- The Fed. My 2024 call for the fed funds rate was a cut in June 2024 and at least two more by year end. It appears unlikely that The Fed will cut rates on Wednesday, at least according to futures. The possibility of a rate cut was probably exhausted when May nonfarm payrolls were reported well ahead of expectations on Friday. But we also saw unemployment move to 4%, its highest level since January 2022. The big question will be the latest FedSpeak. They'll have plenty more data, so I'd guess the market will react mostly to what the Fed believes they'll do down the road. Do they believe a rate cut is still in the cards for later in 2024?
- Wednesday's May CPI report. Current expectations are for May Core CPI to rise 0.3%, which would lower the May Core annual rate from 3.60% to 3.50%. Will that be enough to change the Fed's thinking for the balance of 2024 and into 2025? Stay tuned.
- 10-year treasury yield ($TNX). The TNX is down quite a bit from the recent high just above 3.70%, though it's also risen off the recent low of 3.28%. Today, the TNX is in the middle at 3.48%. Which way does it go? If the bond market believes the inflation outlook is improving, I'd look for buying of bonds, with the corresponding yield dropping back towards 3.28%. If the bond market suspects further inflation trouble ahead, then a trip back to 3.70% could be in the cards. Just remember that interest rates and earnings move the stock market. With few earnings being reported this week, it's all about interest rates and interest rate expectations.
- Biotechnology ($DJUSBT). I'm watching this group closely. May, June and July have proven to be the 3 best consecutive months for this group and I've been seeing improvement lately. 2900 is key price resistance. If we see a breakout, seasonality would only add to the bullishness for this group. The DJUSBT has risen all but one July since 2013 and its average monthly performance (+4.2%) over that time period trails only November (+4.9%).
- Earnings. As I mentioned, there's little in the way of earnings out this week. Broadcom (AVGO) is printing a potential false breakout today and its relative strength vs. its semiconductors peers is poor at best. It has been consolidating, however, for the past 3 months. Watch the 1204.71-1436.17 trading range as this sideways consolidation follows an uptrend. A breakout of this pattern would be bullish. Meanwhile, ORCL has been showing slight improvement relative to its software peers. CrowdStrike (CRWD) has been lifting software, but it could use another big name as a key leader. Maybe ORCL?
Feedback
If you'd like to share your thoughts on our Weekly Market Report, positive or negative, you can reach us at "[email protected]".
Happy trading!
Tom