
EB Weekly Market Report - Monday, June 17, 2024
ChartLists
Here are the ChartLists that were updated over the weekend or are nearly updated:
- Strong Earnings (SECL)
- Strong Future Earnings (SFECL)
- Raised Guidance (RGCL)
- Short Squeeze (SSCL)
These should be available to all members tomorrow morning.
The Strong AD (SADCL) and Bullish Trifecta (BTCL) should be updated by Wednesday morning.
Weekly Market Recap
Major Indices
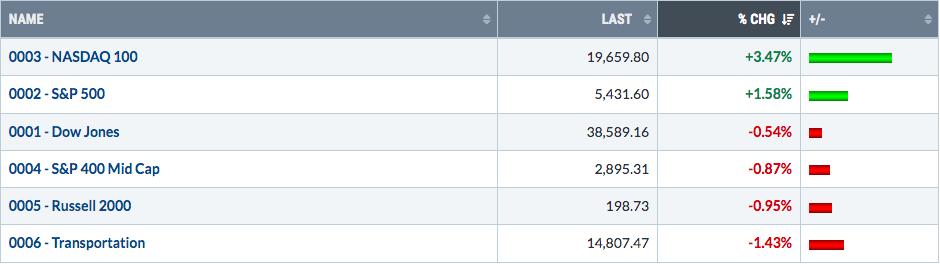
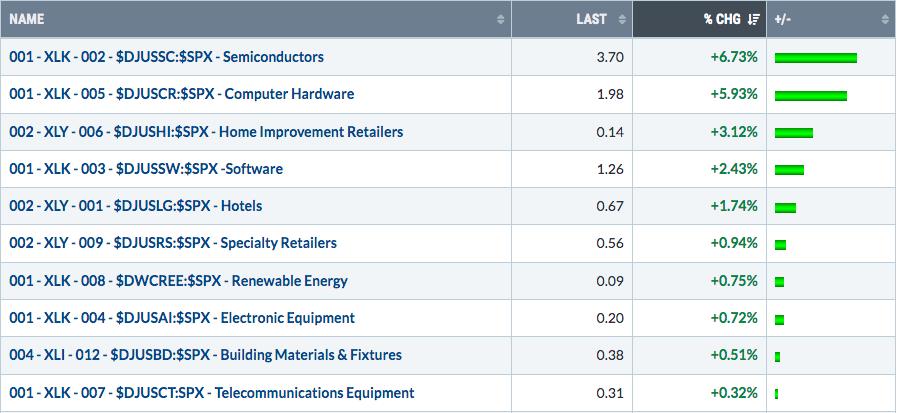
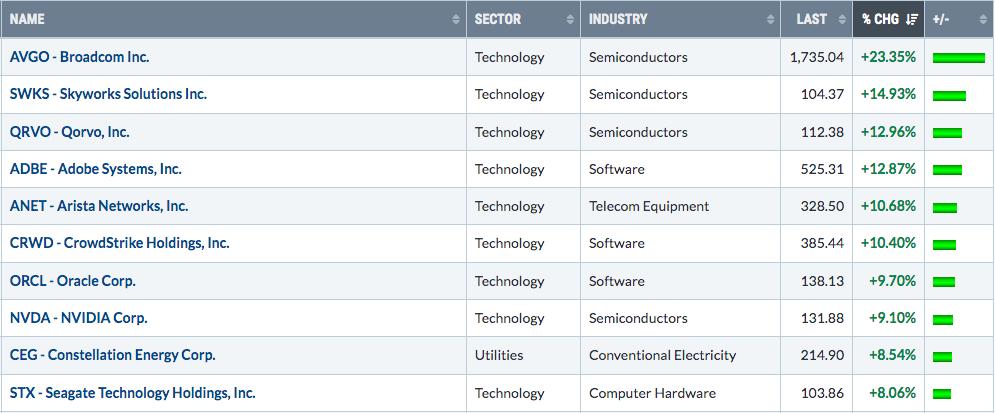
Rotation was quite clear last week as many of the high-flying, mega cap growth stock names were obviously in favor. Further strength in semiconductor ($DJUSSC, +8.41%) names like NVIDIA Corp (NVDA, +9.10%), Broadcom (AVGO, +23.35%), Micron Technology (MU, +7.96%), Lam Research (LRCX, +7.61%), and Monolithic Power Systems (MPWR, +7.31%) helped to stoke the NASDAQ fire. And, of course, it never hurts to see Apple (AAPL, +7.92%) have a solid week. Throw in a resurgence in software ($DJUSSW, +4.05%) and you'll start to get the picture of why the NASDAQ 100 crushed our other indices.
Sectors
Top 10 Industries Last Week
Bottom 10 Industries Last Week
Top 10 Stocks - S&P 500/NASDAQ 100
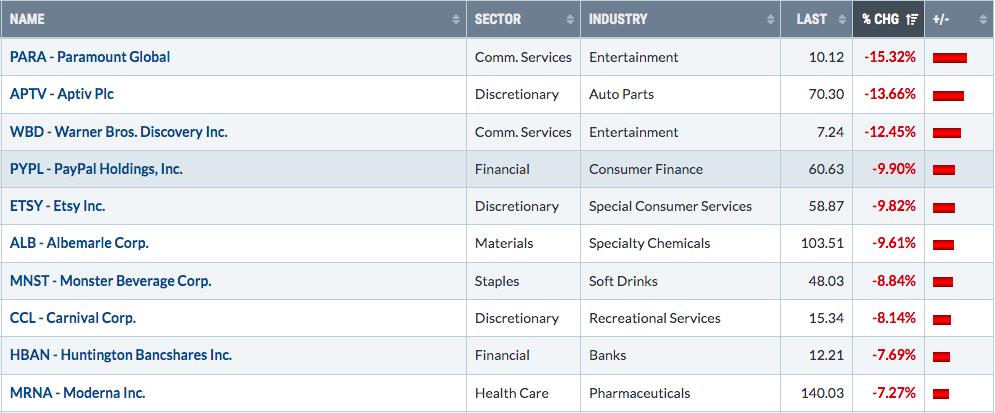
Bottom 10 Stocks - S&P 500/NASDAQ 100
Big Picture
Here's an update of the Big Picture, 100-year chart of the S&P 500:
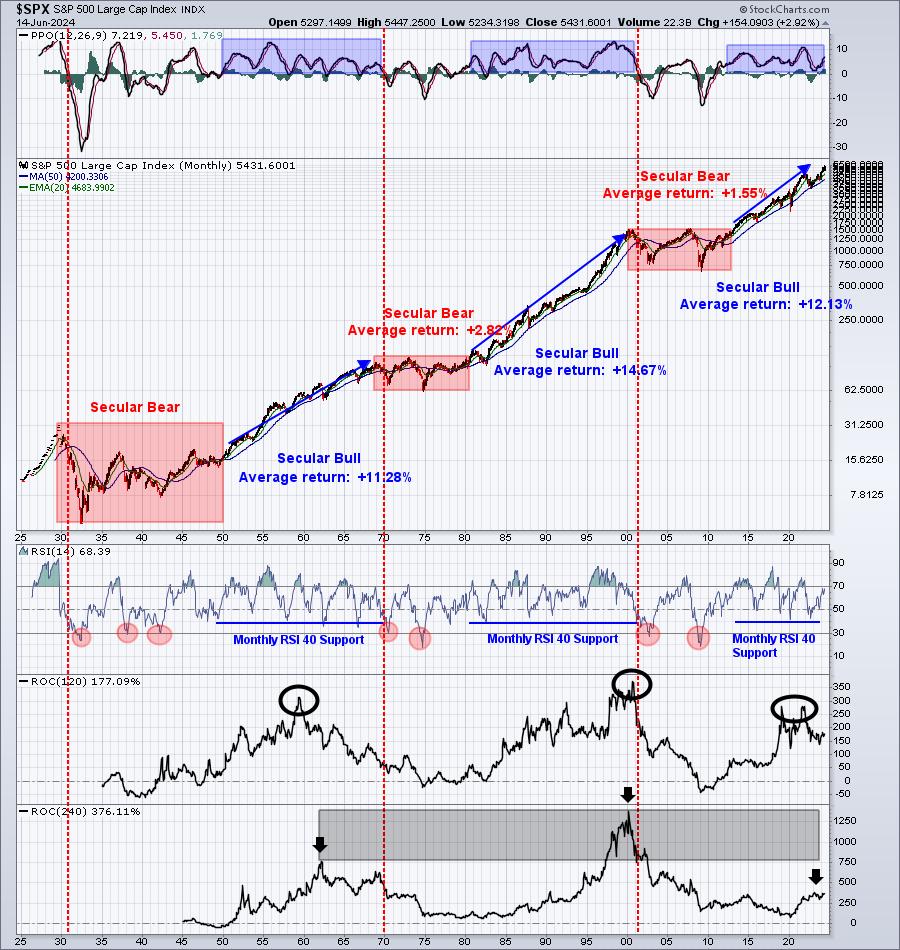
The S&P 500 closed at all-time highs 4 of the 5 trading days last week, only narrowly losing ground on Friday. It also closed higher for the 6th time in the last 7 weeks. Since the opening week of January, the S&P 500 has only seen 2 weeks that have dropped more than 1% - both consecutive weeks from the middle of April. Year-to-date, the S&P 500 has gained 13.87% and we're not yet to the halfway point of the year.
Betting against a secular bull market is typically the equivalent of financial suicide.
Rotation/Intermarket Analysis
Here's the latest look at our key intraday ratios as we follow where the money is traveling on an INTRADAY basis (ignoring gaps):
QQQ:SPY
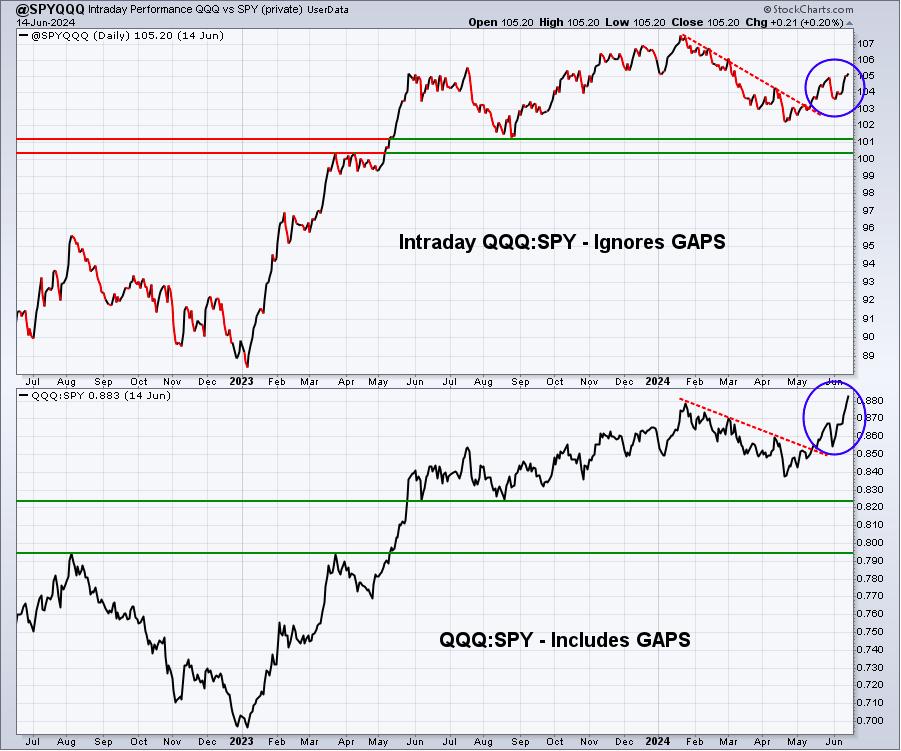
This is a clear sign that many traders have a "risk on" mentality, which typically aids a further move higher in our major indices.
IWM:QQQ
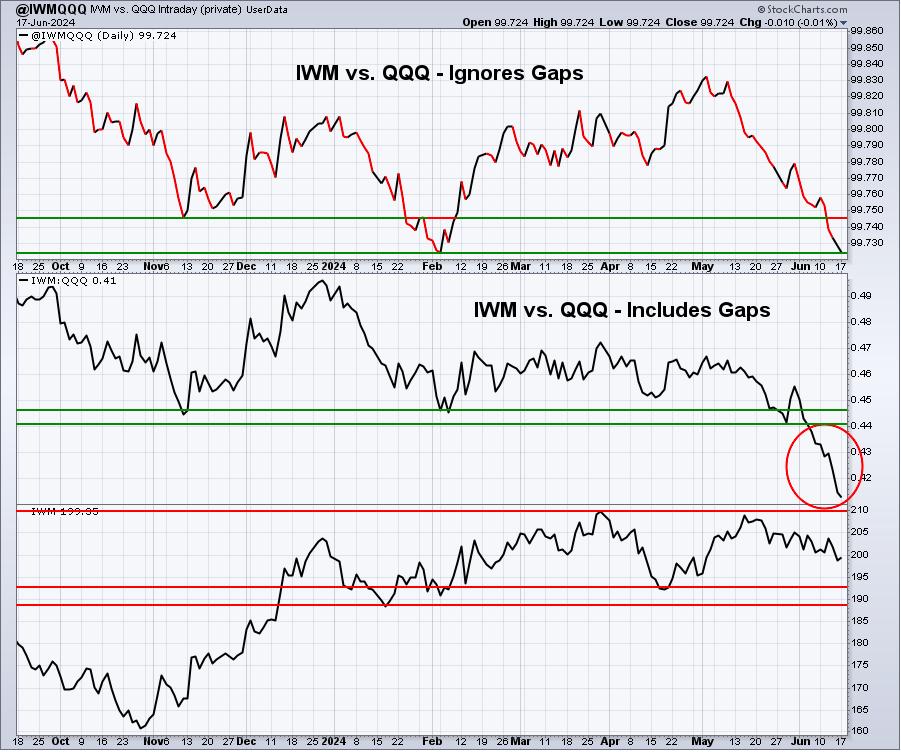
The IWM:QQQ "including gaps" ratio has broken down. Small cap bulls are clinging to the relative support "ignoring gaps". The intraday performance of the IWM really needs to turn higher from here.
XLY:XLP
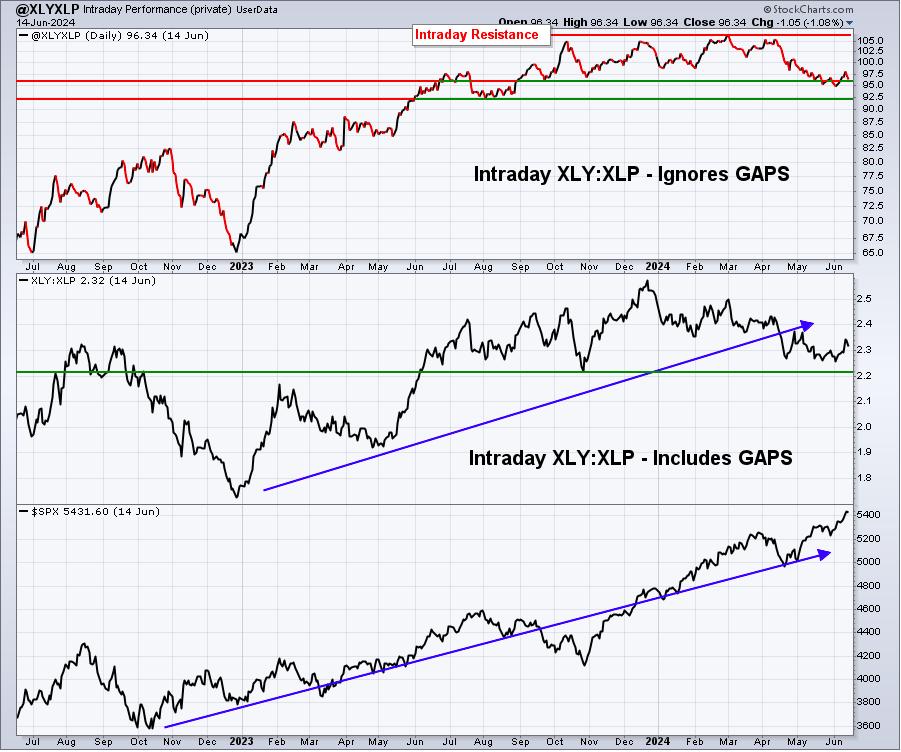
For the first time in two months, the XLY turned higher vs. the XLP - though it didn't hold. A sustainable move higher in this ratio would add to the 2024 bullishness felt across most areas of the stock market.
Sector/Industry Analysis
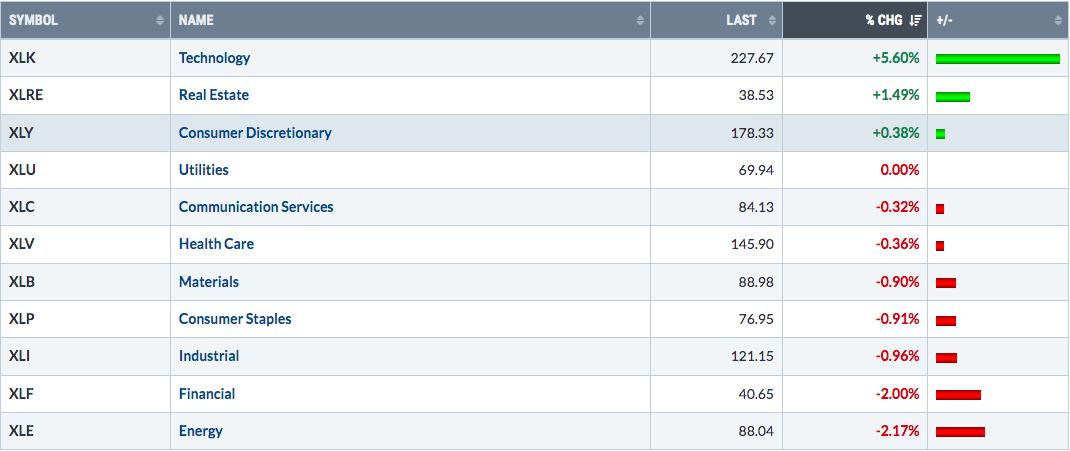
What we are beginning to hear in the news, at least with respect to technical market conditions, is that breadth has become an issue again. Listen, if I can choose what area of the market I'd like to see lead, it'd be technology and the large cap technology stocks. So if breadth issues mean that technology is the overwhelming leader in the market right now, I fully agree with that assessment and I'm actually pretty happy about it. However, I'm more concerned about whether money is leaving the stock market. We know money has been pouring into technology and communication services throughout 2024 as we can see that from this year-to-date sector performance summary:
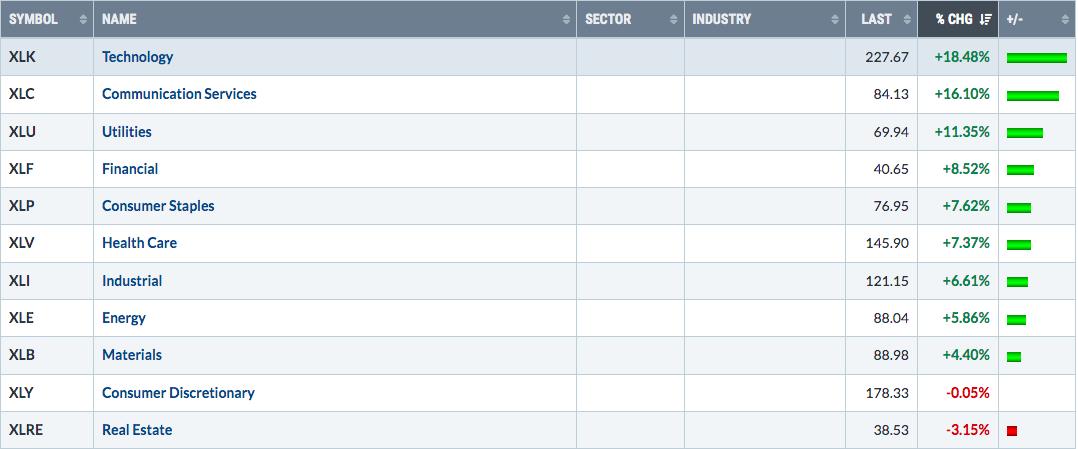
But the really good news is that, technically speaking, all 11 sectors remain in overall uptrends. In other words, there's nowhere for the bears/short sellers to feel comfortable. 9 of 11 sectors are higher year-to-date and consumer discretionary (XLY) is flat. Only real estate (XLRE) is lower and I can make a bullish case for this group:
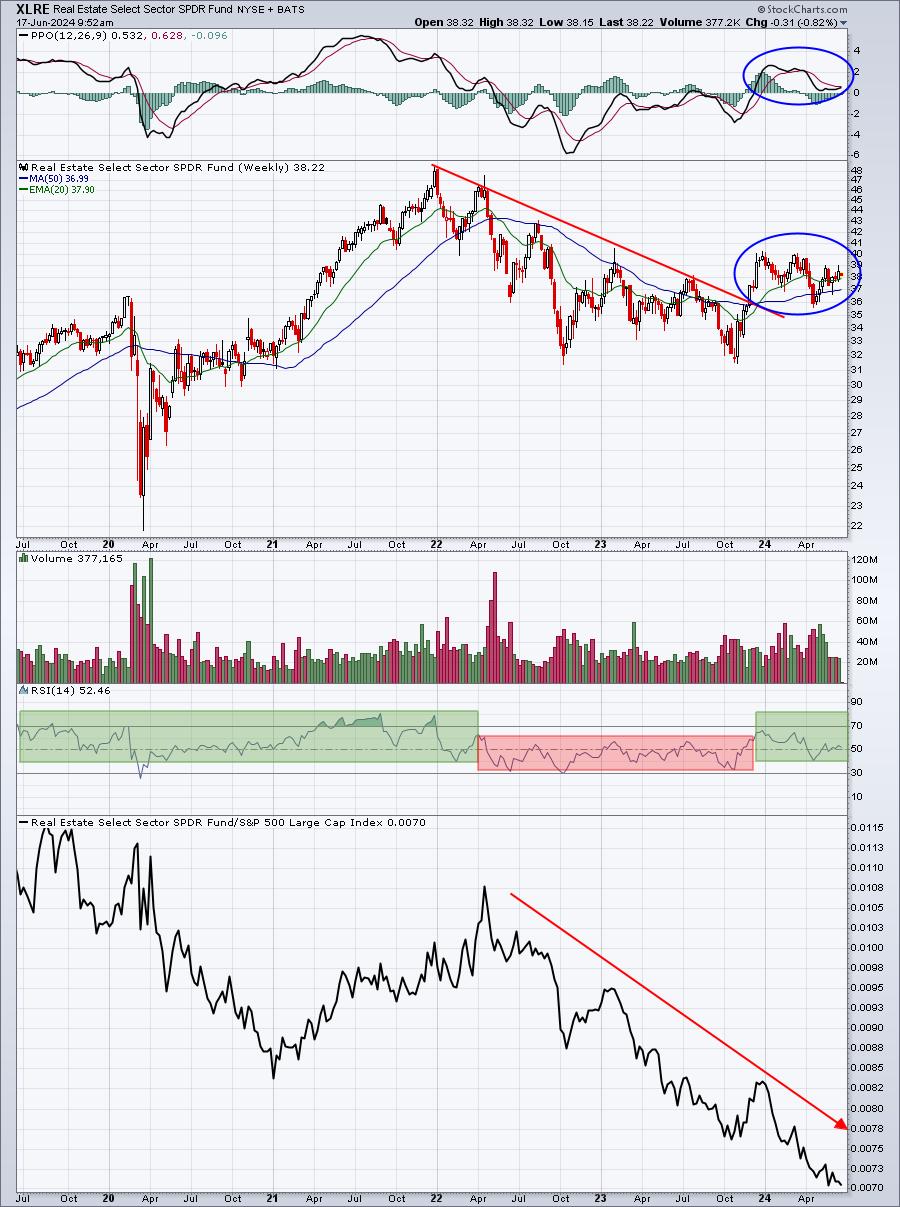
The bottom panel shows the XLRE's relative weakness, which is clear. But there'll be relative weakness in some sectors at all times. We can't have all 11 sectors outperforming the S&P 500 at the same time. It's impossible. We want to see relative strength in aggressive sectors and technology (XLK) has certainly fit the bill there.
Long-Term Trade Setup
Since beginning this Weekly Market Report in early September, I've discussed the long-term trade candidates below that I really like. Generally, these stocks have excellent long-term track records and many pay nice dividends that mostly grow every year. Only in very specific cases (exceptions) would I consider a long-term entry into a stock that has a poor or limited long-term track record:
- JPM
- BA
- FFIV
- MA
- GS
- FDX
- AAPL
- CHRW
- JBHT
- STX
- HSY
- DIS
- MSCI
- SBUX
- KRE
- ED
- AJG
Keep in mind that our Weekly Market Reports favor those more interested in the long-term market picture. Therefore, the list of stocks above are stocks that we believe are safer (but nothing is ever 100% safe) to own with the long-term in mind. Nearly everything else we do at EarningsBeats.com favors short-term momentum trading, so I wanted to provide an explanation of what we're doing with this list.
I don't have any additions to list "long-term" list at this time.
Looking Ahead
Upcoming Earnings:
Outside of the 3 large technology companies listed below, there is little happening in terms of earnings. I've identified what I believe are key companies that will report this week, with their respective market caps in parenthesis. This is NOT a list of ALL companies reporting this week, so please be sure to check for earnings of any companies that you own or add. Any companies in BOLD represent stocks in one of our Portfolios:
- Monday: LEN ($43 billion)
- Tuesday: None
- Wednesday: None
- Thursday: ACN ($189 billion), KR ($36 billion)
- Friday: None
Key Economic Reports:
- Monday: June empire state manufacturing index
- Tuesday: May retail sales, May industrial production & capacity utilization, April business inventories
- Wednesday: June housing market index
- Thursday: Initial jobless claims, May housing starts & building permits, June Philadelphia manufacturing index
- Friday: June PMI composite, May existing home sales, May leading indicators
Historical Data
I'm a true stock market historian. I am absolutely PASSIONATE about studying stock market history to provide us more clues about likely stock market direction and potential sectors/industries/stocks to trade. While I don't use history as a primary indicator, I'm always very aware of it as a secondary indicator. I love it when history lines up with my technical signals, providing me much more confidence to make particular trades.
Below you'll find the next two weeks of historical data and tendencies across the 3 key indices that I follow most closely:
S&P 500 (since 1950)
- Jun 17: +14.98%
- Jun 18: -24.13%
- Jun 19: -13.07%
- Jun 20: -22.82%
- Jun 21: +14.57%
- Jun 22: -25.23%
- Jun 23: -8.82%
- Jun 24: -40.77%
- Jun 25: -16.94%
- Jun 26: -76.61%
- Jun 27: -0.31%
- Jun 28: +44.31%
- Jun 29: +6.42%
- Jun 30: +34.34%
NASDAQ (since 1971)
- Jun 17: +23.65%
- Jun 18: -56.99%
- Jun 19: +31.68%
- Jun 20: -42.67%
- Jun 21: +18.15%
- Jun 22: -33.43%
- Jun 23: +13.79%
- Jun 24: -29.82%
- Jun 25: -20.44%
- Jun 26: -43.93%
- Jun 27: -4.06%
- Jun 28: +88.56%
- Jun 29: +51.99%
- Jun 30: +73.30%
Russell 2000 (since 1987)
- Jun 17: +12.59%
- Jun 18: -38.03%
- Jun 19: -8.37%
- Jun 20: -68.83%
- Jun 21: +29.20%
- Jun 22: -75.31%
- Jun 23: -8.12%
- Jun 24: -130.91%
- Jun 25: +21.38%
- Jun 26: -9.18%
- Jun 27: +37.98%
- Jun 28: +122.51%
- Jun 29: +66.61%
- Jun 30: +99.14%
The S&P 500 data dates back to 1950, while the NASDAQ and Russell 2000 information date back to 1971 and 1987, respectively.
Final Thoughts
Despite a Fed that refuses to acknowledge the current sustainability of the move lower in inflation, the stock market continues its upward ways. We saw more record highs last week and we're starting this week in record high territory.
Here are a few things to consider in the week ahead:
- Max Pain. I'm listing this first for a reason. Max pain never guarantees us any sort of future outcome, but it does provide us a warning that SHORT-TERM downside risks have increased substantially. And the higher our major indices go this week, risk increases proportionally. While I'm not suggesting max pain will force prices to drop, we know from watching max pain over the years how important it can be to short-term market direction. Be on your toes (as a short-term trader) this week and into next! This has little to no impact for those that hold stocks long-term.
- Inflation. The May Core CPI reading last Wednesday of 0.16% was the lowest monthly reading since inflation peaked. It dropped our annual Core CPI from 3.60% to 3.40% as it replaced a much higher reading from May 2023.
- 10-year treasury yield ($TNX). Investors piled into bonds in droves last week, sending yields much lower. The TNX tumbled throughout the week, falling from its Monday high of 4.48% to Friday's low of 4.19%, testing the end of March low at that level. The short-term uptrend appears to be broken as bond traders join stock traders in believing that inflation worries are in the rear view mirror.
- Earnings. As we approach the end of Q2, there are almost zero companies reporting quarterly results. There are a number of economic reports, but the only one that I'd consider to be a really BIG report would be retail sales on Tuesday morning. Industrial production and initial jobless claims will be worth watching as well. The housing reports are important, but they tend to impact a much smaller portion of the stock market.
Feedback
If you'd like to share your thoughts on our Weekly Market Report, positive or negative, you can reach us at "[email protected]".
Happy trading!
Tom