
EB Weekly Market Report - Monday, June 24, 2024
Weekly Market Recap
Major Indices
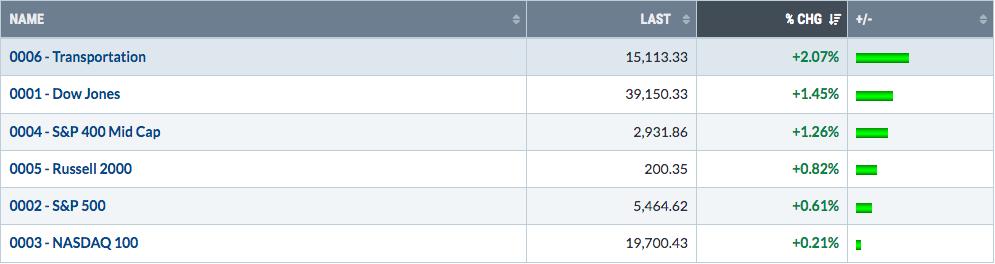
It was max pain week and max pain did what max pain does. The carpet has been pulled out from underneath longs, especially those longs that were aggressive in the semiconductor space ($DJUSSC). That weighed on the NASDAQ 100 particularly hard on a relative basis, especially on Thursday and Friday. The selling in that area has continued into this morning's action. Meanwhile, what typically happens during "Opposite George" week? The laggards begin to lead. Look at the leader last week - transports ($TRAN). That group hasn't been able to get out of its own way, yet during max pain week, it becomes a leader. Those beaten-down transports that likely had net in-the-money PUT premium saw a short-term bounce. What a shocker!
Sectors
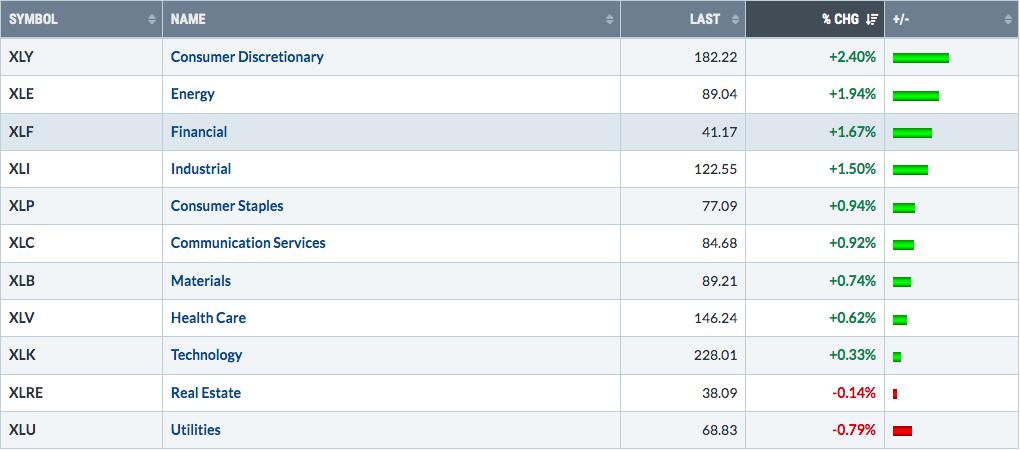
About one week ago, I talked about moving away from technology and considering a few areas that had not been participating in the recent market advance. Seasonality has favored discretionary stocks during June, so that leadership was no surprise. Energy, financials, industrials, and health care were mentioned as likely beneficiaries should money rotate away from technology. Bingo!
Top 10 Industries Last Week
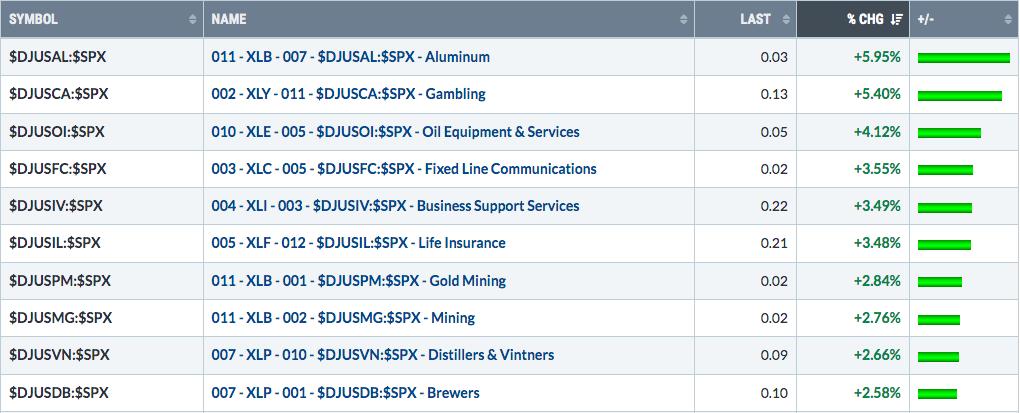
Gambling ($DJUSCA) was the 2nd best performing industry group last week and I wouldn't be at all surprised to see this strength continue into July. Seasonally, gambling tends to perform well during months of earnings kickoff - January, April, July, and October. Check out this seasonality chart of the DJUSCA, relative to the S&P 500 ($SPX):
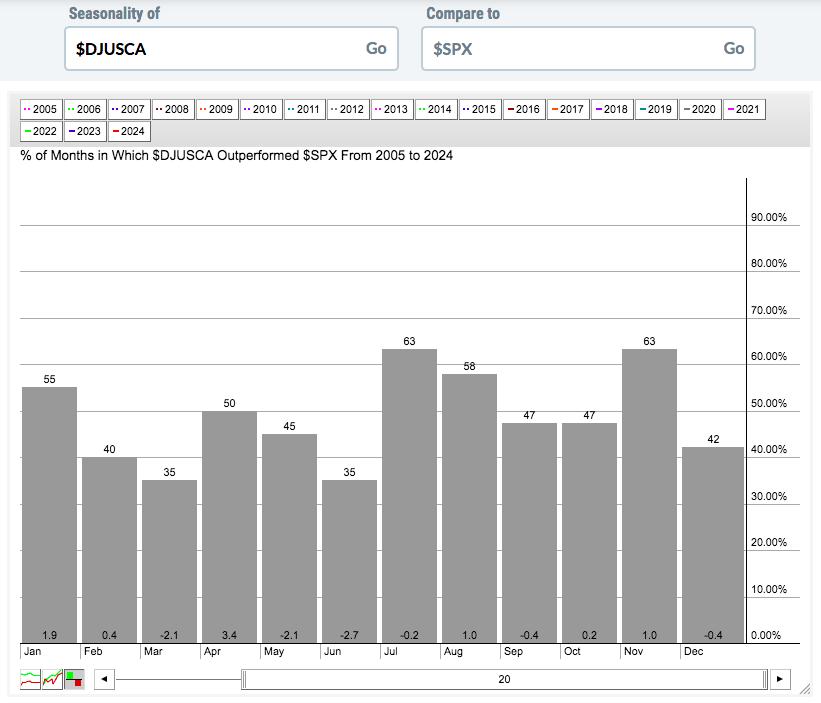
Check out this breakdown in the DJUSCA's relative performance simply by adding the average relative monthly gains and losses from each calendar month above:
- Month 1 of calendar quarters (Jan, Apr, Jul, Oct): +5.3%
- Month 2 of calendar quarters (Feb, May, Aug, Nov): +0.3%
- Month 3 of calendar quarters (Mar, Jun, Sep, Dec): -5.6%
History tells us that if we're going to see relative strength from gambling stocks, it's likely to be as earnings season begins. Among gambling stocks, Wynn Resorts (WYNN) absolutely loves these 4 "earnings kickoff months" as well. I will share the numbers in Wednesday's EB Digest newsletter, but you can pull up its seasonal chart if you'd like a sneak preview. I believe discretionary stocks are at a level to really give them a good look, which is why I have begun buying WYNN in small pieces. Las Vegas Sands (LVS) has been showing recent strength and its pullback today to test its 20-day EMA is potentially an opportunity there as well. I don't own LVS at this point, however.
Bottom 10 Industries Last Week
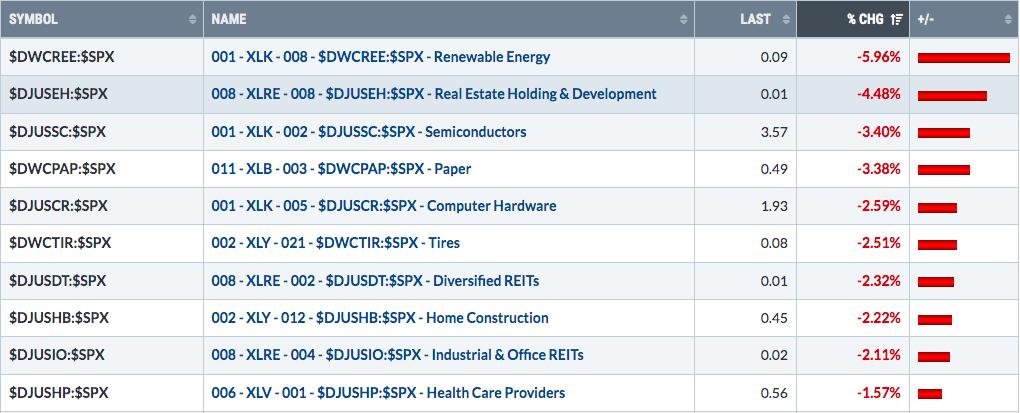
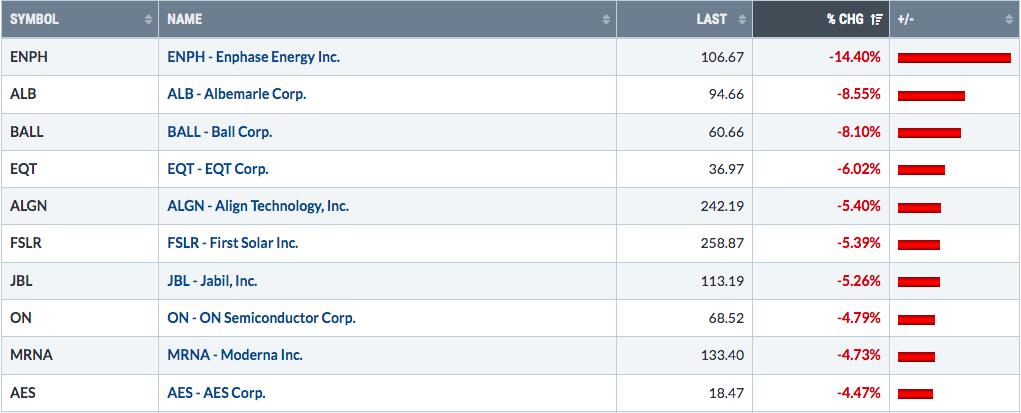
Remember how hot First Solar (FSLR) was? NVDA and QCOM? AAPL? Well, those stocks and their respective industry groups really took it on the chin during June monthly options-expiration last week. This is the other side of Opposite George week, when stocks absolutely on fire suddenly can't catch a bid. Is there anyone still left that doesn't believe market makers manipulate prices occasionally?
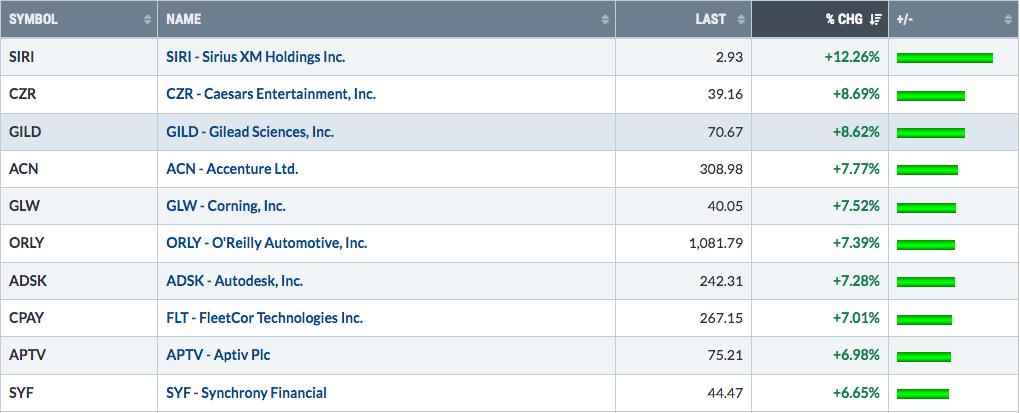
Top 10 Stocks - S&P 500/NASDAQ 100
Bottom 10 Stocks - S&P 500/NASDAQ 100
Big Picture
Here's an update of the Big Picture, 100-year chart of the S&P 500:
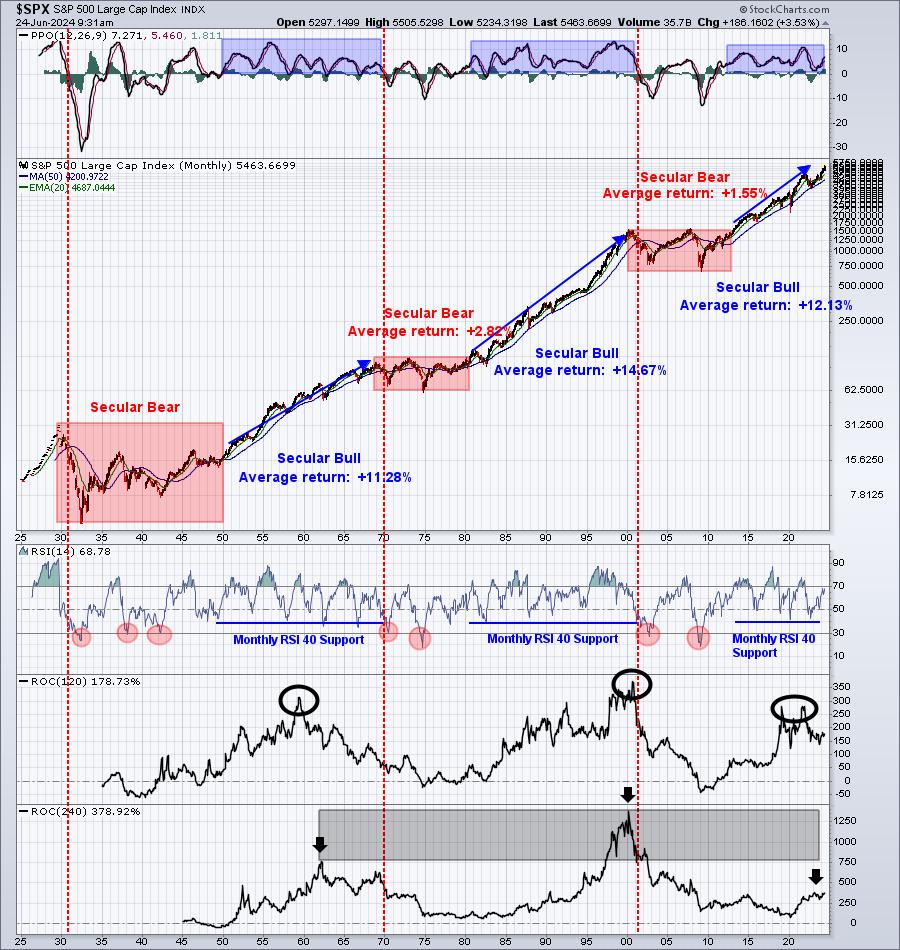
Ok, now let's forget about max pain and options expiration, because that represents a short-term market inefficiency. It has absolutely ZERO bearing on what the S&P 500 will do long-term. I remain every bit as bullish today, from a long-term perspective, as I did one week ago. We'll get past the effect of monthly options expiration and it'll be trading as usual. I wouldn't be at all surprised, however, if we see more rotation into sectors not called technology. The group has made a MAJOR move to the upside, carrying the stock market higher, and deserves a rest. It's also important to understand that one of the hallmarks of secular bull markets is the wide participation that occurs. So when a key group like technology rests, we typically see other areas grab the baton and move higher, rather than seeing the technology proceeds leave the market altogether. If I'm right about rotation and large-cap technology consolidation/weakness, then we're going to see plenty of opportunities in other sectors and asset classes. This technology consolidation could help areas that have lagged badly of late, like transports ($TRAN) and small (IWM) and mid caps (MDY).
Rotation/Intermarket Analysis
Here's the latest look at our key intraday ratios as we follow where the money is traveling on an INTRADAY basis (ignoring gaps):
QQQ:SPY
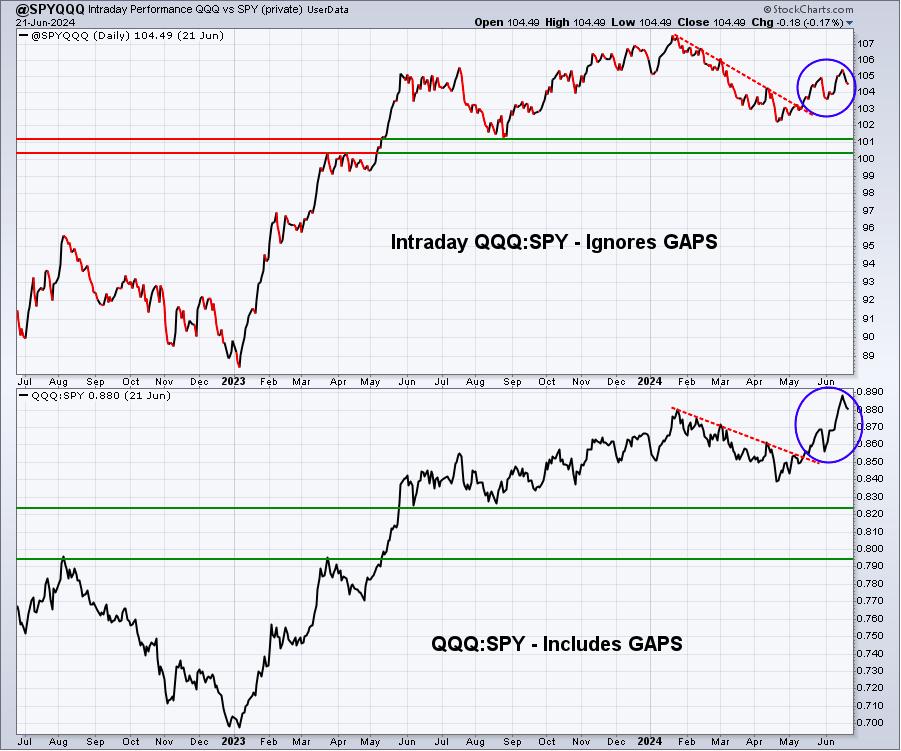
The QQQ has been outperforming the SPY, that much is clear. However, the intraday strength is not nearly as strong as the close to close strength and that suggests that the QQQ may not be quite as strong as we might think. If semiconductors remain weak for any extended period of time, it could play a role in the direction of this ratio.
IWM:QQQ
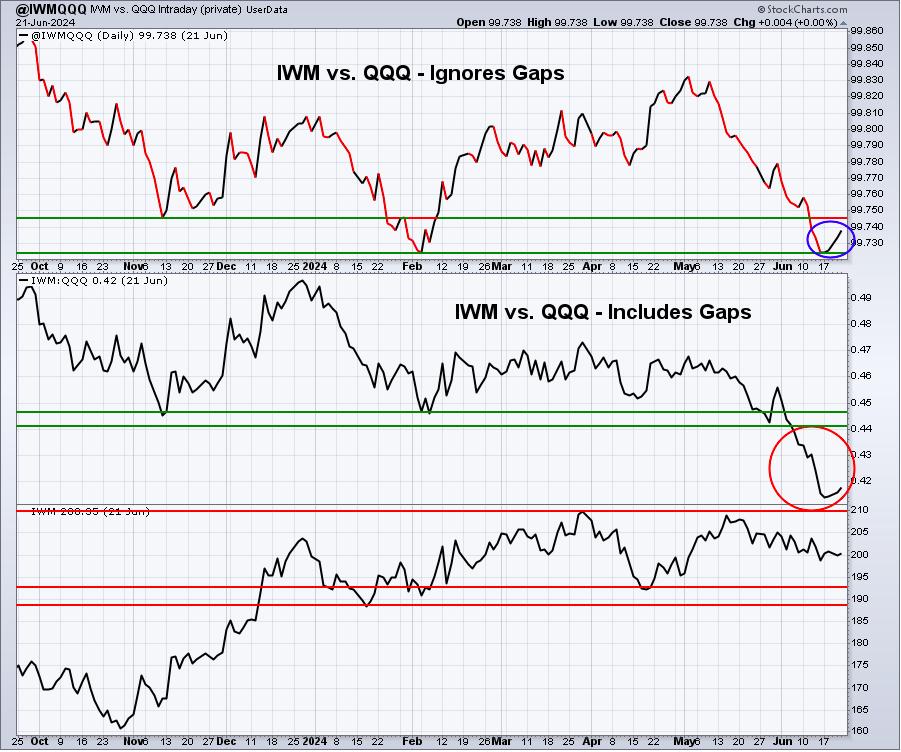
Last week, I discussed the immediate need for the intraday IWM:QQQ ratio to hold support and turn higher. Well, so far so good. The blue circle in the top panel highlights this reversal and kick save. Now small caps need follow through and, if we see rotation away from large cap tech continue, this will be the IWM's chance to rebound and challenge its absolute price resistance near 211. I'm hopeful, but won't be convinced until we see that confirmed price breakout.
XLY:XLP
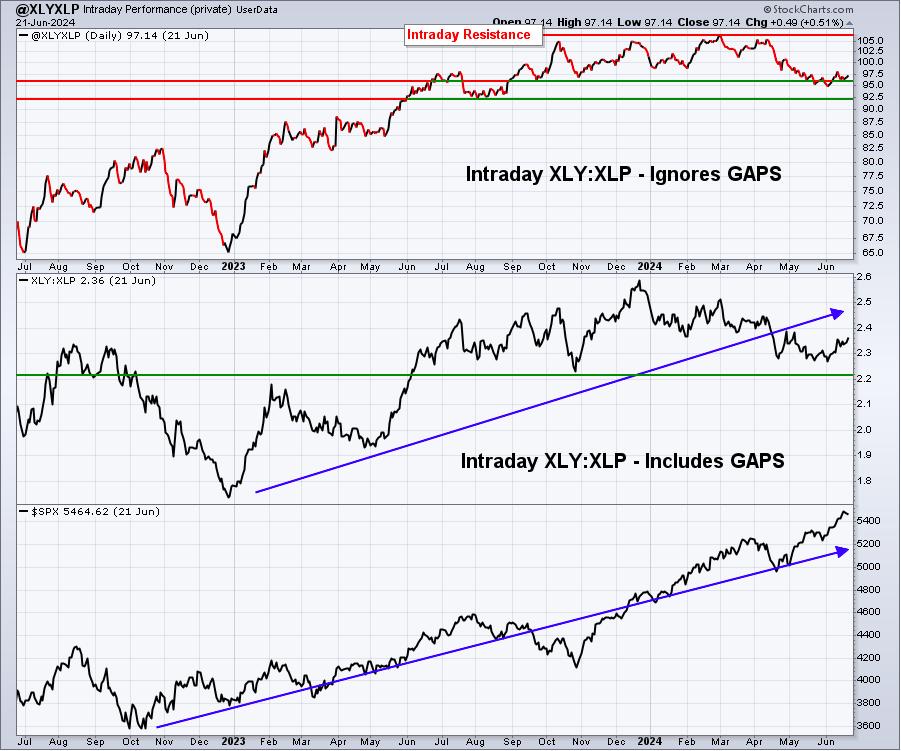
The XLY is beginning to show some life. We know from history, though, that the XLY loves June. So it'll be interesting to see if the recent relative strength vs. the XLP is sustained into July. If so, it would no doubt be a very bullish development.
Sector/Industry Analysis
I believe bullish rotation is currently taking place as our primary bull market leader, technology (XLK), potentially rests for awhile. Trust me, there are several sectors on the verge of big breakouts that could attract much more money. Here is what I'm looking at:
XLI:
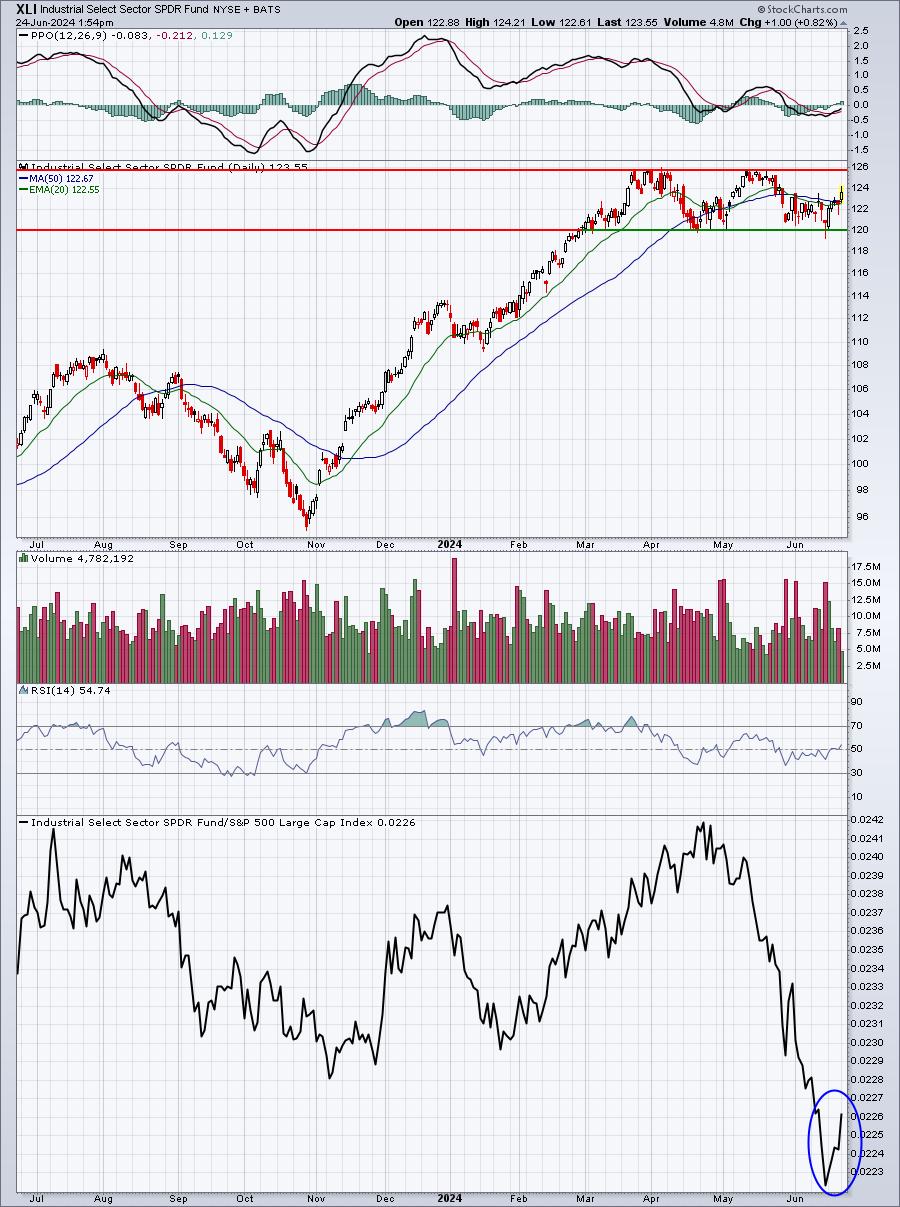
Relative strength has turned up over the past week and the XLI is in a bullish continuation pattern, rectangular consolidation after a prior uptrend. Watch for a breakout here.
XLF:
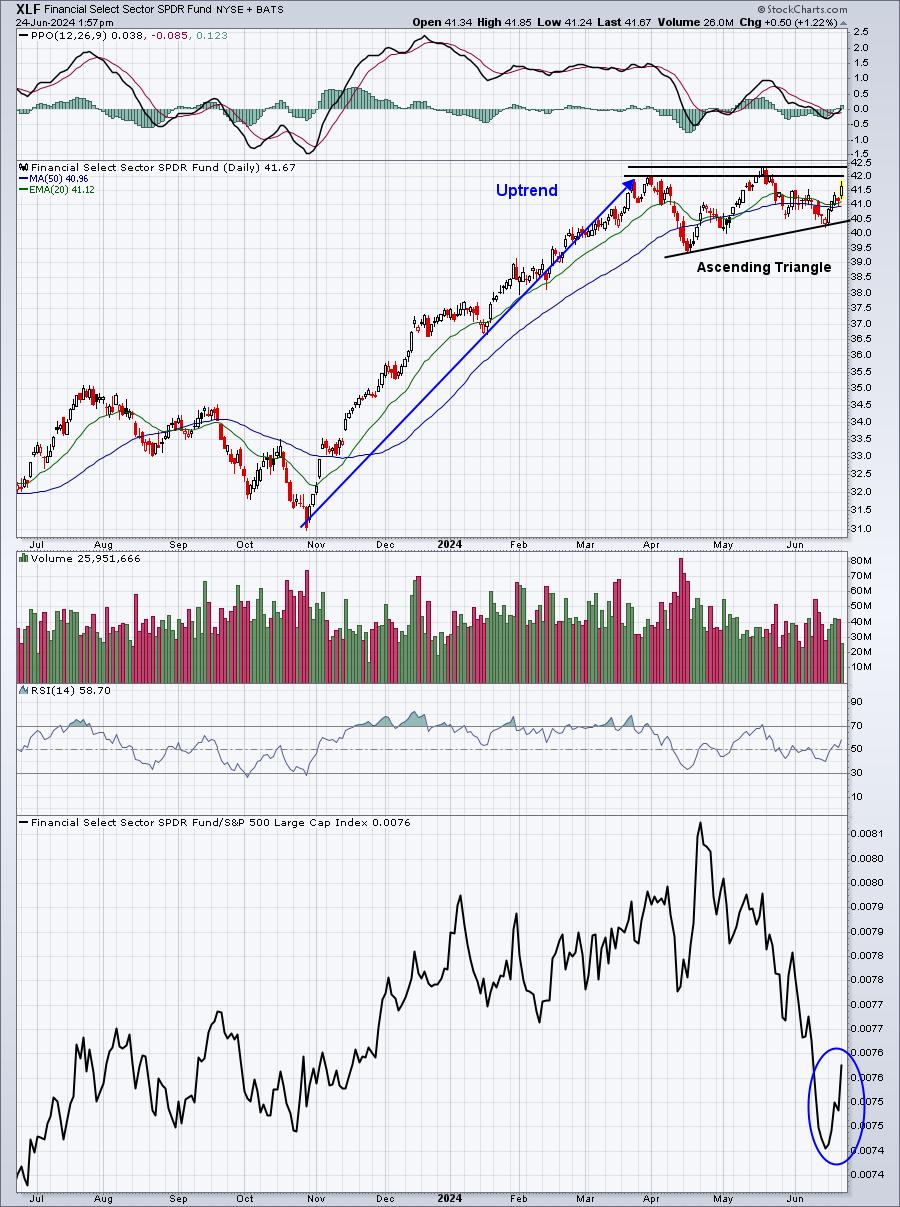
This isn't a perfect bullish ascending triangle, but its recent price action certainly resembles one.
XLV:
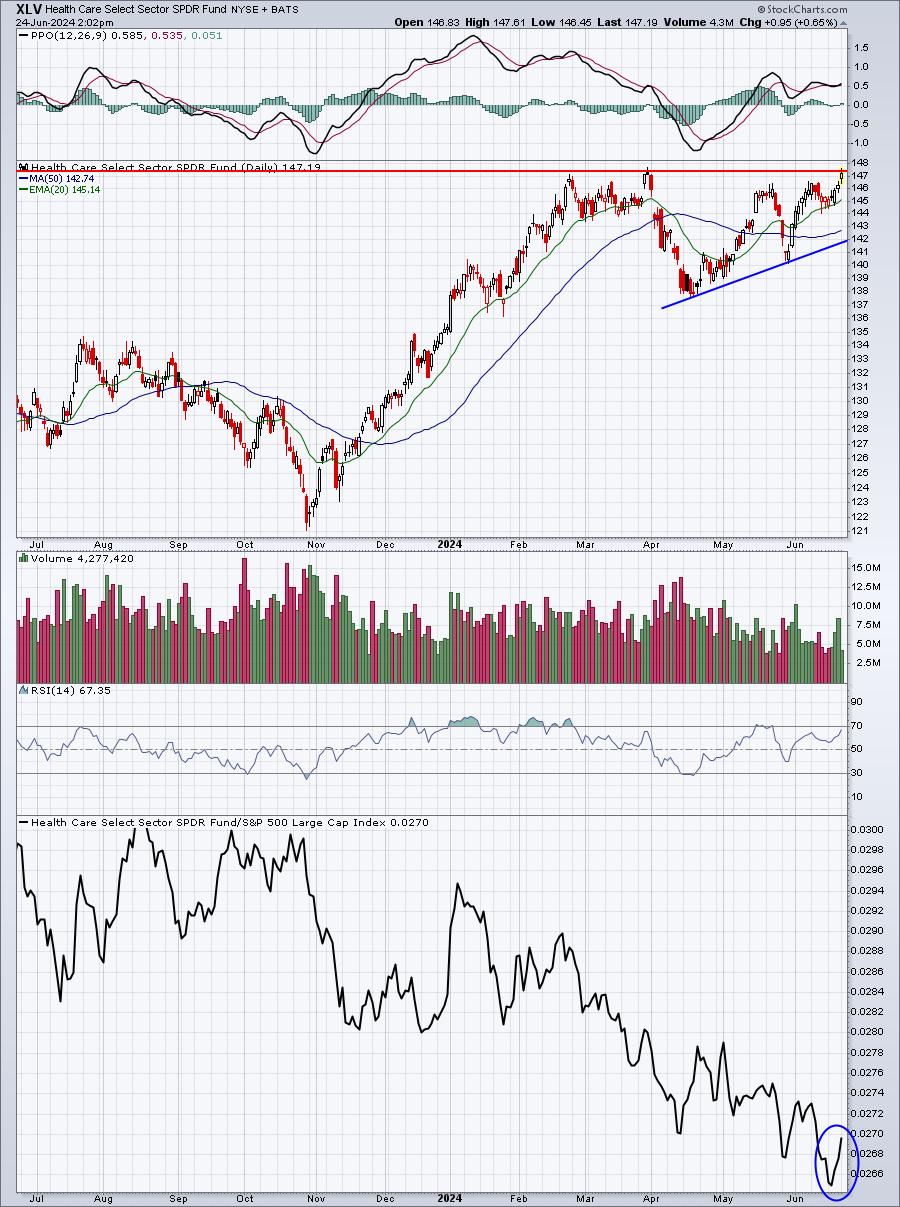
Like the other two sectors highlighted, the XLV has seen its relative strength line turn up. Biotechs ($DJUSBT) love the month of July and that seasonal strength, if it occurs in 2024, would only help this sector make the breakout above the 147.50 level.
Long-Term Trade Setup
Since beginning this Weekly Market Report in early September, I've discussed the long-term trade candidates below that I really like. Generally, these stocks have excellent long-term track records and many pay nice dividends that mostly grow every year. Only in very specific cases (exceptions) would I consider a long-term entry into a stock that has a poor or limited long-term track record:
- JPM
- BA
- FFIV
- MA
- GS
- FDX
- AAPL
- CHRW
- JBHT
- STX
- HSY
- DIS
- MSCI
- SBUX
- KRE
- ED
- AJG
Keep in mind that our Weekly Market Reports favor those more interested in the long-term market picture. Therefore, the list of stocks above are stocks that we believe are safer (but nothing is ever 100% safe) to own with the long-term in mind. Nearly everything else we do at EarningsBeats.com favors short-term momentum trading, so I wanted to provide an explanation of what we're doing with this list.
I don't have any additions to list "long-term" list at this time.
Looking Ahead
Upcoming Earnings:
Outside of the 3 large technology companies listed below, there is little happening in terms of earnings. I've identified what I believe are key companies that will report this week, with their respective market caps in parenthesis. This is NOT a list of ALL companies reporting this week, so please be sure to check for earnings of any companies that you own or add. Any companies in BOLD represent stocks in one of our Portfolios:
- Monday: None
- Tuesday: FDX ($62 billion), CCL ($18 billion)
- Wednesday: MU ($160 billion), PAYX ($45 billion), GIS ($38 billion)
- Thursday: NKE ($144 billion), MKC ($18 billion)
- Friday: None
Key Economic Reports:
- Monday: None
- Tuesday: April Case Shiller home price index, April FHFA house price index, June consumer confidence
- Wednesday: May new home sales
- Thursday: Initial jobless claims, May durable goods, Q1 GDP (final estimate), May pending home sales
- Friday: May personal income & spending, May PCE price index, June Chicago PMI, June consumer sentiment
Historical Data
I'm a true stock market historian. I am absolutely PASSIONATE about studying stock market history to provide us more clues about likely stock market direction and potential sectors/industries/stocks to trade. While I don't use history as a primary indicator, I'm always very aware of it as a secondary indicator. I love it when history lines up with my technical signals, providing me much more confidence to make particular trades.
Below you'll find the next two weeks of historical data and tendencies across the 3 key indices that I follow most closely:
S&P 500 (since 1950)
- Jun 24: -40.77%
- Jun 25: -16.94%
- Jun 26: -76.61%
- Jun 27: -0.31%
- Jun 28: +44.31%
- Jun 29: +6.42%
- Jun 30: +34.34%
- Jul 1: +72.87%
- Jul 2: +14.01%
- Jul 3: +75.99%
- Jul 4: Holiday - market closed
- Jul 5: +37.05%
- Jul 6: +22.32%
- Jul 7: +17.62%
NASDAQ (since 1971)
- Jun 24: -29.82%
- Jun 25: -20.44%
- Jun 26: -43.93%
- Jun 27: -4.06%
- Jun 28: +88.56%
- Jun 29: +51.99%
- Jun 30: +73.30%
- Jul 1: +59.12%
- Jul 2: -54.43%
- Jul 3: +39.88%
- Jul 4: Holiday - market closed
- Jul 5: -0.11%
- Jul 6: -10.79%
- Jul 7: +60.19%
Russell 2000 (since 1987)
- Jun 24: -130.91%
- Jun 25: +21.38%
- Jun 26: -9.18%
- Jun 27: +37.98%
- Jun 28: +122.51%
- Jun 29: +66.61%
- Jun 30: +99.14%
- Jul 1: +40.88%
- Jul 2: -119.74%
- Jul 3: +45.08%
- Jul 4: Holiday - market closed
- Jul 5: +0.47%
- Jul 6: -76.61%
- Jul 7: +43.95%
The S&P 500 data dates back to 1950, while the NASDAQ and Russell 2000 information date back to 1971 and 1987, respectively.
Final Thoughts
We are still feeling the effects of June monthly options expiration and max pain. But that impact will disintegrate over the next couple days. I don't look for technology and its primary driver, semiconductors, to perform poorly going forward. I just don't believe the group will lead again for a while. This will provide opportunities in other areas of the market that we've mostly avoided. Lots of money rotating will likely benefit transports ($TRAN), which we saw last week. I expect it to continue, though obviously it's no guarantee.
Here are a few things to consider in the week ahead:
- Max Pain. The impact has already been obvious. NVIDIA Corp (NVDA) fell from near 141 on Thursday's open to its current price of 118.94. That's 22 bucks, or 15%, in 48 hours! QCOM was above 230 on Tuesday. Today, it's trading at just under 204. Micron Technology (MU), which reports its quarterly results this week, was 157 at the opening bell on Thursday. It's now below 140. Broadcom (AVGO) has fallen from over 1840 to 1610. And the list of beaten-down semiconductors goes on and on. We'll likely see a bounce in these stocks at some point soon, but I would not be looking for a sudden return to recent highs.
- Inflation. The Fed watches the PCE price index closely and we'll get the latest reading on Friday before the market opens.
- Earnings. Micron Technology (MU) is the largest market cap company to report this week. It'll be interesting to see how the stock market reacts to it. I won't be surprised to see a nice report, but do traders use any gap higher as another opportunity to sell that strength? If so, it'll be further proof that we need to stay away from the group as it could very well be fully valued.
- Rotation. I cannot emphasize this enough. Secular bull markets are known for their resiliency. When one leader falls, another leads. This rotation sustains bull markets. Watch for areas like discretionary, industrials, financials, energy, and health care to pick up the pieces if technology falters.
- History. The end of June until July 17th tends to be bullish for U.S. equities. Therefore, I'm not looking for a big tumble in stocks, at least not yet. I believe we could see that later in August and throughout September. For now, I'll remain long, but I'll be looking mostly outside of technology for opportunities.
- Perspective. Don't confuse short-term max pain related weakness with a bigger problem long-term. I remain as convinced as ever that we'll continue to enjoy new all-time highs in 2024 and 2025. But we shouldn't ignore the impact of rotation that'll lead us higher.
Feedback
If you'd like to share your thoughts on our Weekly Market Report, positive or negative, you can reach us at "[email protected]".
Happy trading!
Tom