
EB Weekly Market Report - Monday, July 1, 2024
ChartLists
Over the weekend, the following ChartLists were updated:
- Strong Earnings (SECL)
- Strong Future Earnings (SFECL)
- Raised Guidance (RGCL)
The links on our website will be updated later this afternoon, so you should be good to download the updated ChartLists in a few hours.
There will be almost zero earnings reports of significance this week, so our key ChartLists will not be updated again until next Friday. Fresh data just came out this weekend for short interest, so I'll be updating our Short Squeeze ChartList (SSCL) over the next couple days and will let you know when it's ready to go.
July Seasonality Report
I am working on this report now and should be able to send it out later today or tomorrow. I'll also be providing a July Seasonality ChartList (SEASCL) with 20 top July stocks and annotations.
Technology and consumer discretionary tend to perform best in July and I know TSLA loves July, along with both June and August - at least in terms of average monthly performance.
Weekly Market Recap
Major Indices
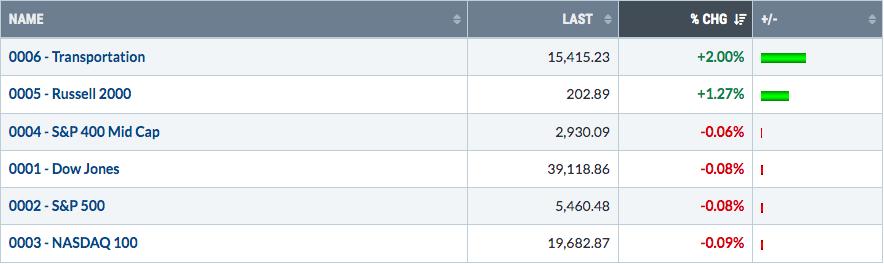
The transports ($TRAN) led the above key indices on a relative basis for the 2nd consecutive week. Watch this group very, very closely. The long-term remains in an uptrend, but most traders only have a short-term memory. So they believe the transports cannot lead the stock market higher. Well, sorry to disappoint, but yes they can. And they have. In fact, historically, transports and the S&P 500 ($SPX) have a very strong positive correlation. Check this out:
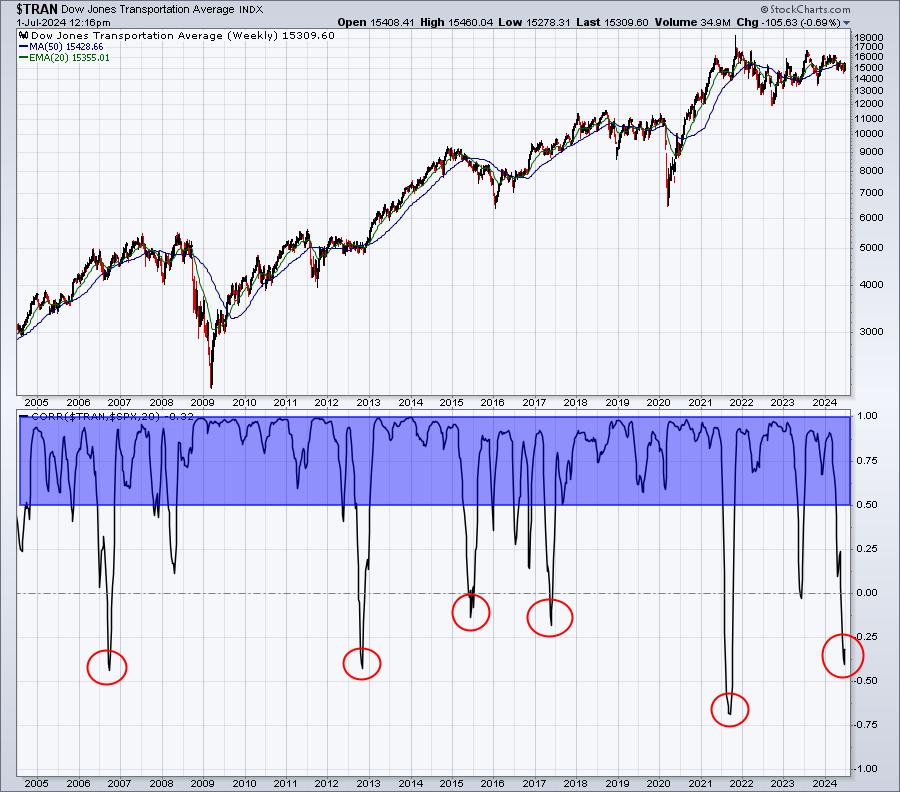
Transports and the S&P 500 generally travel in tandem with one another. That's what the blue-shaded area tells us. Correlation is nearly always positive and mostly above +0.50. These two don't just normally travel kind of similar, but they honestly go hand-in-hand for the most part. We've only seen correlation turn negative 6 times in 2 decades (red circles). So our conclusion about transports should be that what they've been doing is COMPLETELY OUT OF CHARACTER. The current relative weakness is what traders should be taking advantage of RIGHT NOW. If you're a long-term INCOME investor (meaning that income is more important than capital appreciate), you should be taking advantage of long-term transportation winners that are struggling currently. I'm adding a transportation stock this week to our long-term portfolio. See the Long-Term Trade Setups section below.
Sectors
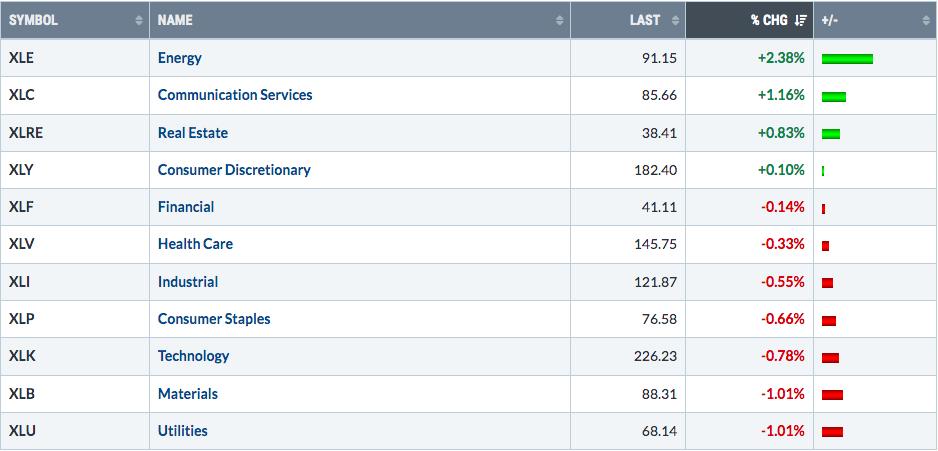
I wouldn't call energy (XLE) the best place to invest right now, but it's not the worst either. We've seen a down channel break back to the upside and the XLE is now trending up and resides above its now-rising 20-day EMA. Until that configuration changes, the bulls are in charge short-term and they showed that character change with last week's gains and relative leadership.
Remember the relative strength in utilities (XLU) and how many traders misinterpreted that to mean the market was turning defensive? It was nothing more than smoke and mirrors. Want to see the sector leaderboard for the last month? Check this out:
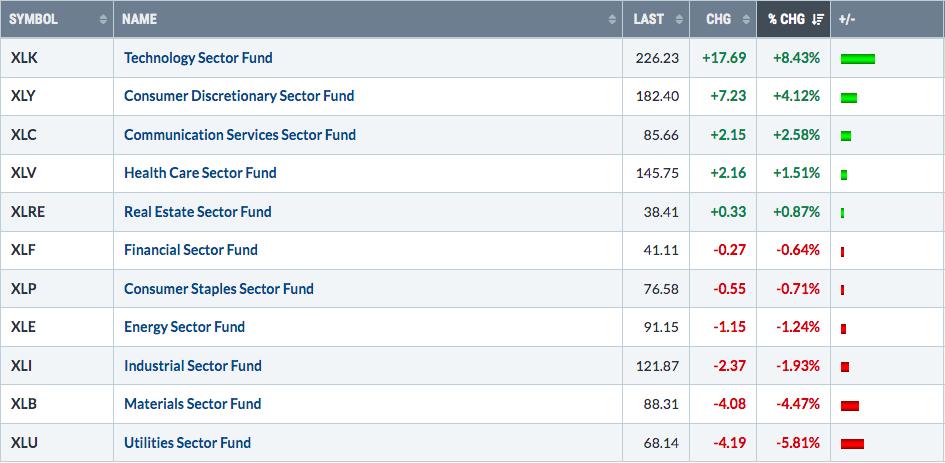
Well, that story didn't work out well for the bears, so they're off trying to conjure up some other reason now why we're about to see an ugly bear market ahead. STOP listening to all the PERMA-BEARS out there. Unknowingly, they eat away at the truth and our psyche. Tune them OUT! Yes, we will see pullbacks from time to time, it's inevitable. But I'm seeing ZERO signs that we're about to see the market come tumbling down. I'll stick with my signals every time.
Top 10 Industries Last Week
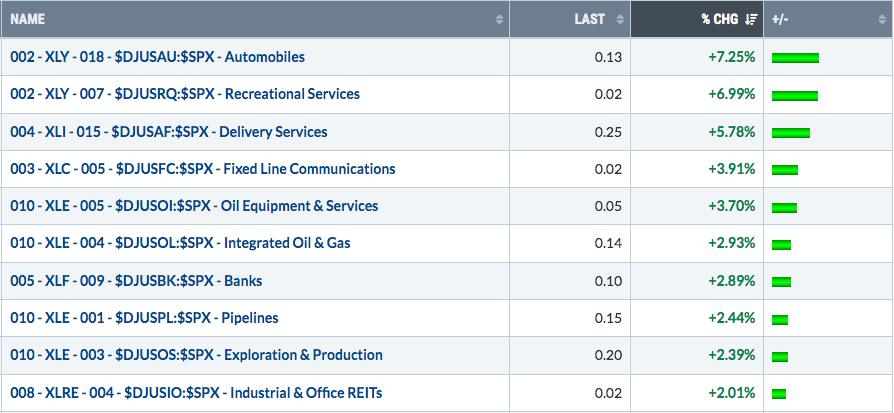
Many folks have given up on Tesla (TSLA) and the autos ($DJUSAU). That's a big mistake, in my opinion. Test your memory. Think back to the pandemic low. The DJUSAU hit a low of 126.13 on March 16, 2020. From there, autos EXPLODED higher to a high of 1503.75 on November 1st, 2021. Everyone LOVED autos back then. If anyone suggested that autos might lose 70% over the next 14 months, they'd have been run off the planet. That's how emotions and sentiment change everyone's rationale. Now fast forward to April 22, 2024, when autos hit their 2024 low of 547.20. Everyone hated autos. I actually saw an analyst put a price target of $1 on TSLA. Since April, autos have jumped more than 200 points, or roughly 40% and might just be getting started. The baton that semiconductors ($DJUSSC) have been waiting to pass along may have just been passed to autos and other areas of the market (software, internet, broadline retail, to name a few).
Bottom 10 Industries Last Week
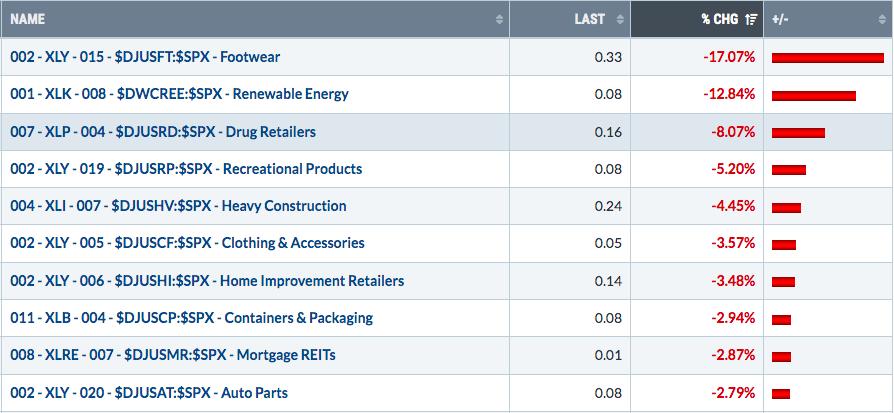
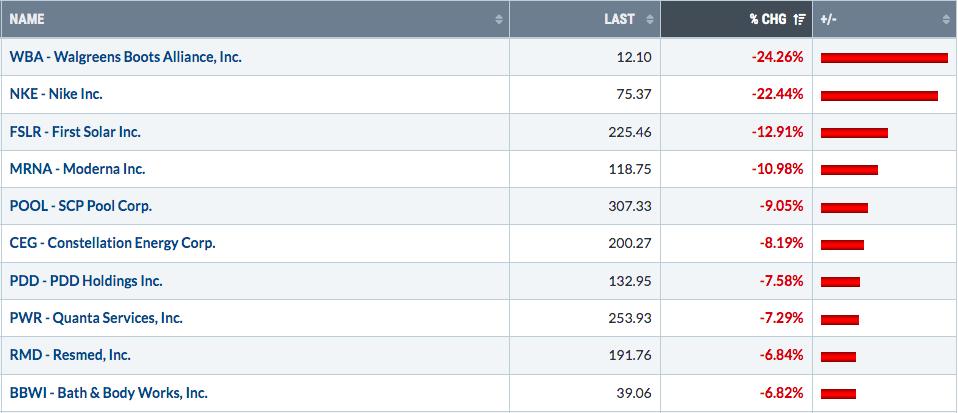
Nike's (NKE) earnings report last week was a total disaster and crushed the footwear index ($DJUSFT). It wasn't so much last quarter's results, though, as its quarterly EPS easily surpassed estimates, $1.01 vs. $0.85. And revenues, though they came up short, were only off by 2% or so. It was their guidance that stunk up the joint. While many companies are posting great results and raising guidance, NKE is struggling. Its competition right now is eating its lunch as NKE cut its future sales guidance.
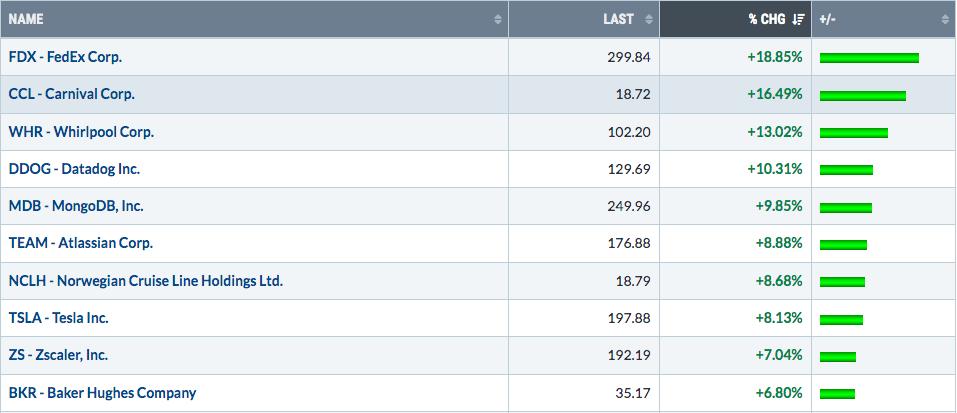
Top 10 Stocks - S&P 500/NASDAQ 100
Bottom 10 Stocks - S&P 500/NASDAQ 100
Big Picture
Here's an update of the Big Picture, 100-year chart of the S&P 500:
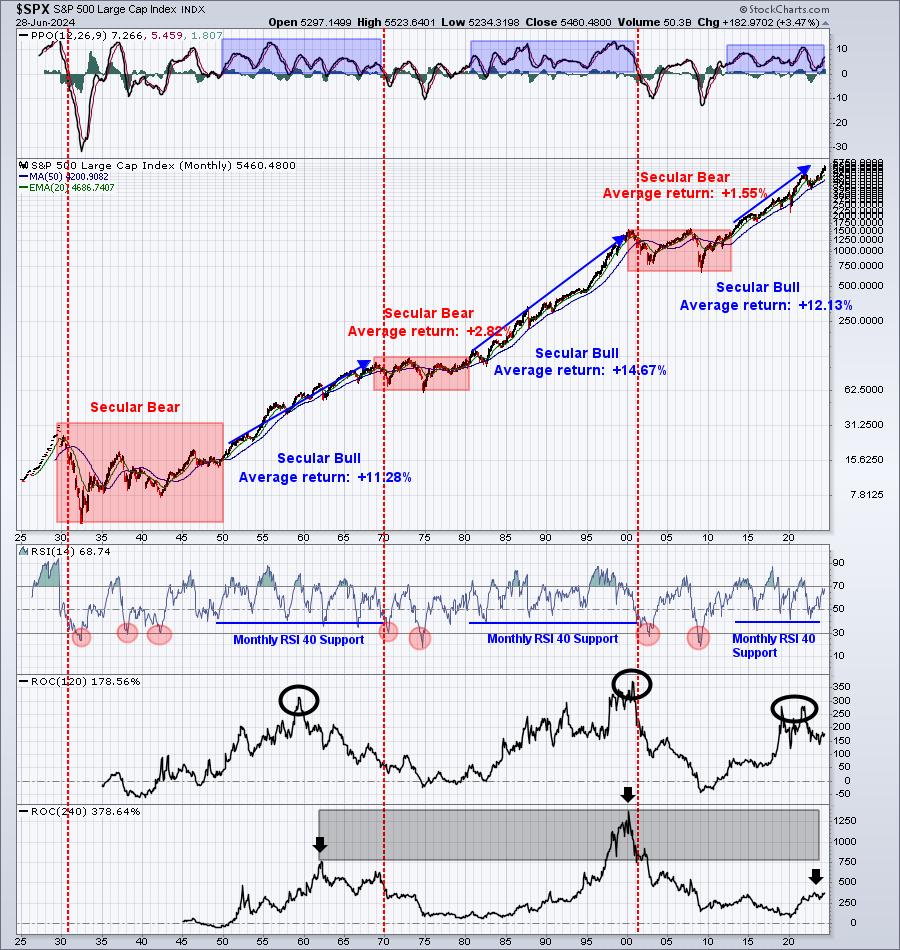
Semiconductors ($DJUSSC), which have carried much of the secular bull market load, has fallen well off its recent high, and yet the S&P 500 pushed to another all-time high on Friday morning, due mostly to rotation to areas that had been underperforming. This is CLASSIC bull market behavior, where old leaders falter and new leaders emerge to keep the S&P 500 in a long-term uptrend. The alternative would be money not rotating and completely leaving the stock market. That has NOT happened and is a bullish development.
Rotation/Intermarket Analysis
Here's the latest look at our key intraday ratios as we follow where the money is traveling on an INTRADAY basis (ignoring gaps):
QQQ:SPY
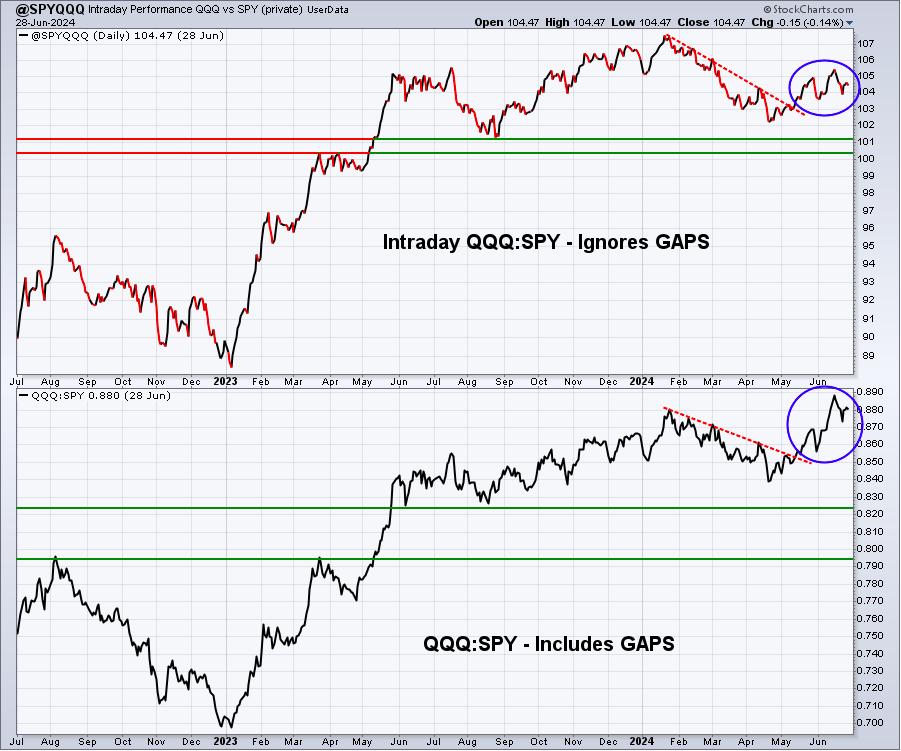
The lower panel is moving up much faster than the upper panel. A big reason why is that the QQQ is gapping UP more than the SPY. Actual trading throughout the day has still been solid for the QQQ vs. the SPY, but we have not seen this intraday ratio move to a new high. In fact, we have a long way to go. This is consistent with intraday rotation towards the more-value-oriented S&P 500. That doesn't mean the bull market is ending. Rather, I simply view it as the increasing likelihood that semiconductors could feel more short-term pain than many might believe right now.
IWM:QQQ
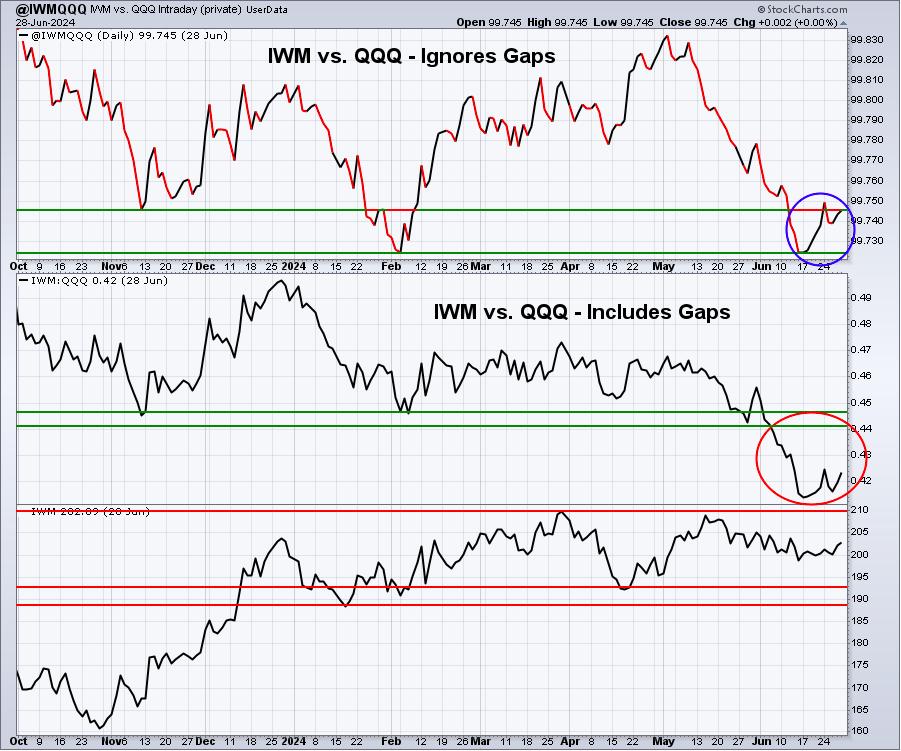
This intraday ratio is the opposite of the QQQ:SPY. Here we're seeing small caps do better on a relative intraday basis. It's a signal that small caps could be poised for leadership ahead, but we still need to see price confirmation. That would start with a closing breakout above 211 on the IWM. Until then, it's fair to remain skeptical the small caps.
XLY:XLP
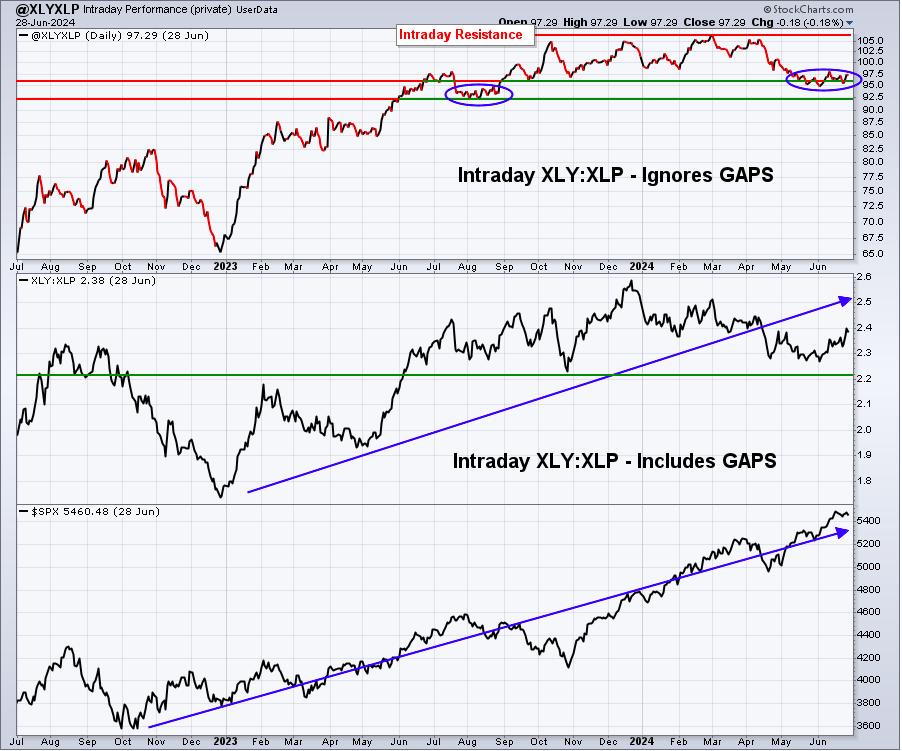
Consumer discretionary, right on cue, began showing relative strength in June. The relative intraday hesitation over the past 5-6 weeks looks quite similar to what we saw during a 5-6 week period in July/August 2023. We know what happened in September 2023 after the last period. The IWM intraday rotation SURGED to the upside. Will it happen again? We'll find out in July.
Dollar, Commodities, and Inflation
The U.S. Dollar ($USD) has been on the move higher, which is what I've been expecting to see. It's the primary reason why I do NOT like gold ($GOLD). It's also what happens when the global markets say that inflation is OVER. Inflation erodes the dollar. If currency traders believed inflation would rise again and that the worst was not behind us, they'd SELL the dollar hand over fist. That is NOT happening and it's ONE major reason why I keep saying inflation risks are basically nil.
Remember this chart?
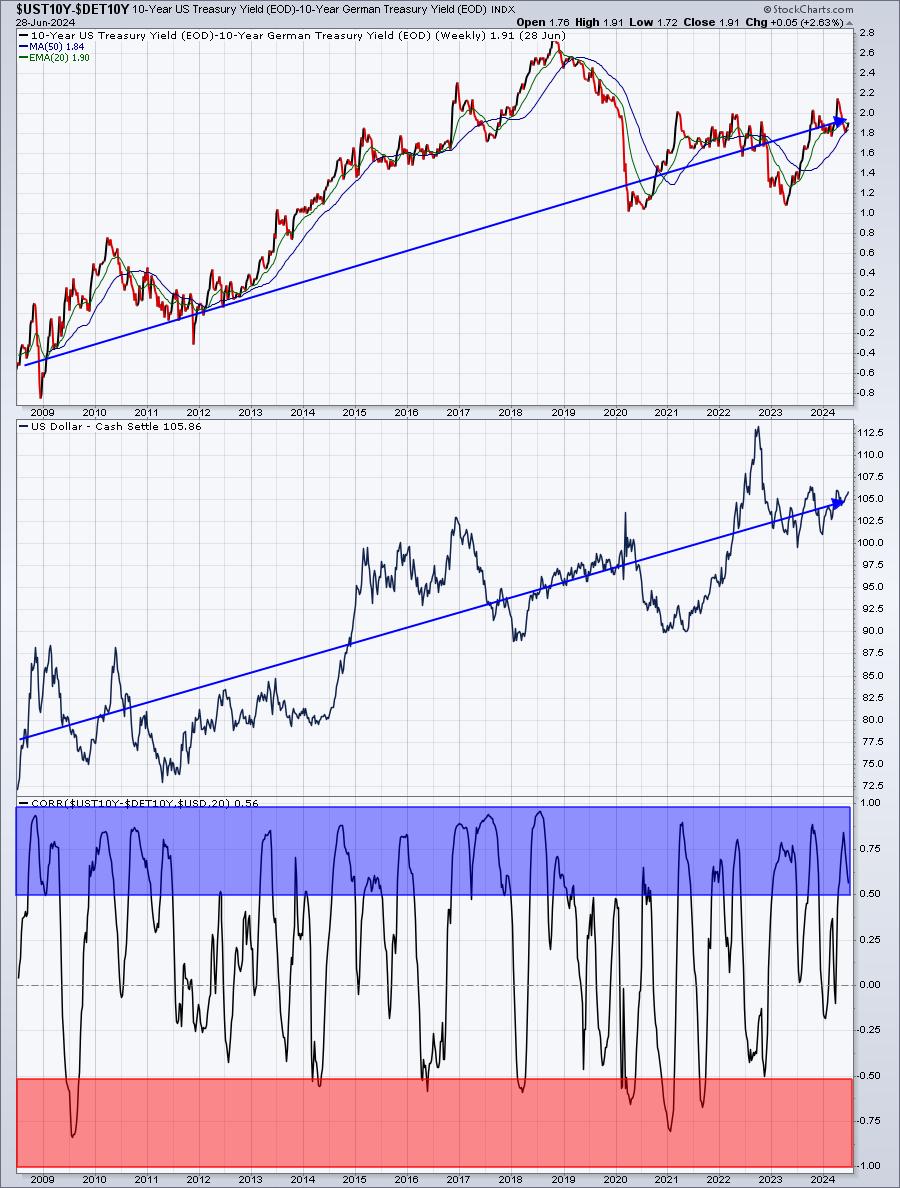
This highlights the difference in 10-year yields between the U.S. and Germany. I believe it's an effective predictor of dollar movement and direction. If our yields rise vs. Germany, one possible and likely reason for it is that bond markets believe the U.S. economy is stronger than Germany's. If our economy is seen as the stronger economy, then we should see that reflected in a stronger currency.
I believe the trend is higher in both the relative yield chart (top panel) and the U.S. Dollar Index (middle panel). The significance here is that when we're in a rising dollar environment, commodities (especially gold) is a HORRIBLE place to park your money. Check out this long-term chart of the dollar vs. the relative strength of commodities and gold:
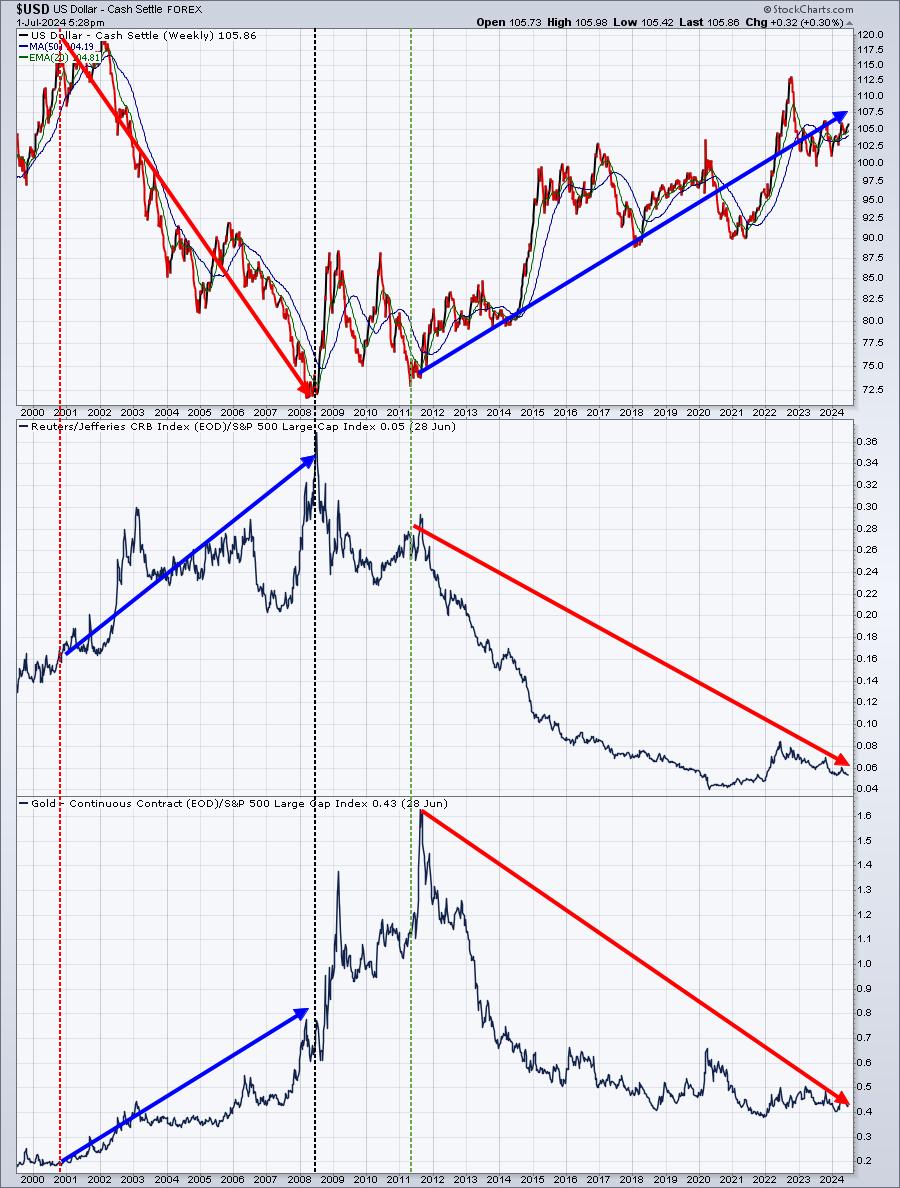
Here are my conclusions:
- The strong dollar suggests the inflation trade is DEAD
- The strong dollar also suggests that commodities, gold, XLE, and XLB will mostly be challenging
- The U.S. and German bond market relationship suggests the dollar will continue to climb
Long-Term Trade Setup
Since beginning this Weekly Market Report in early September, I've discussed the long-term trade candidates below that I really like. Generally, these stocks have excellent long-term track records and many pay nice dividends that mostly grow every year. Only in very specific cases (exceptions) would I consider a long-term entry into a stock that has a poor or limited long-term track record:
- JPM
- BA
- FFIV
- MA
- GS
- FDX
- AAPL
- CHRW
- JBHT
- STX
- HSY
- DIS
- MSCI
- SBUX
- KRE
- ED
- AJG
Keep in mind that our Weekly Market Reports favor those more interested in the long-term market picture. Therefore, the list of stocks above are stocks that we believe are safer (but nothing is ever 100% safe) to own with the long-term in mind. Nearly everything else we do at EarningsBeats.com favors short-term momentum trading, so I wanted to provide an explanation of what we're doing with this list.
I am adding a transportation stock to this list as I believe the current weakness in transports is presenting a great long-term opportunity. There are plenty of transports to choose from, but I'm going to stick with a railroad here:
NSC:
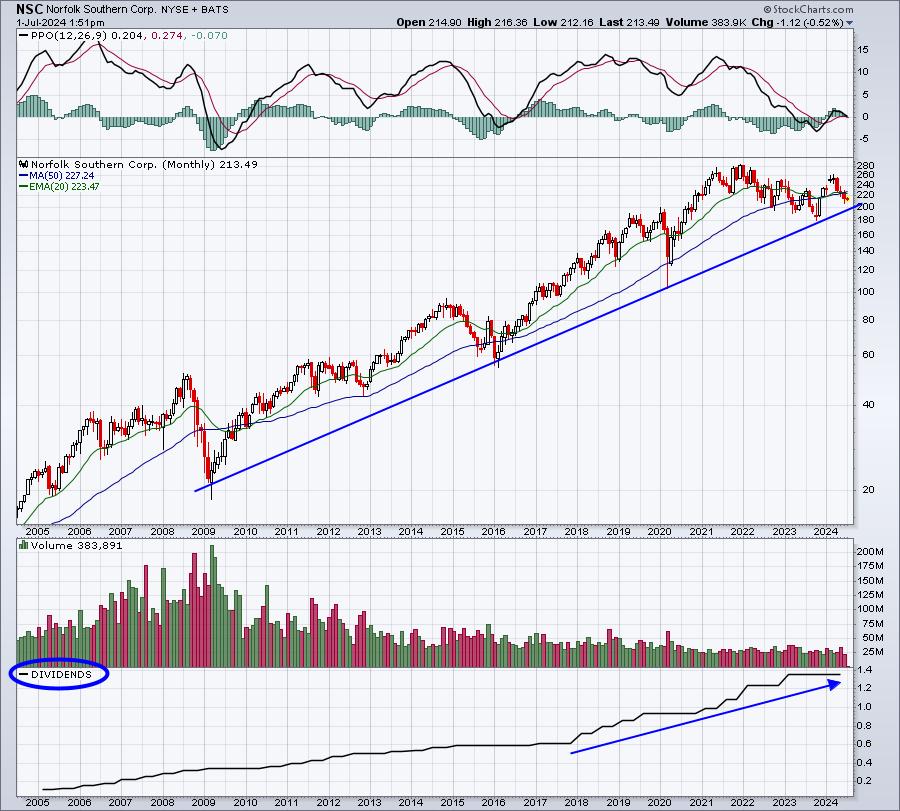
NSC has pulled back a bit more than the other railroads, but it has a history of steadily increasing its quarterly dividend and its current yield of 2.52% is much higher than most of its competitors. Actually, if you look closely, you'll see that NSC's dividend growth has really picked up the past 6 years or so. If I was torn between capital appreciation AND income, then I might choose CSX as the better option. It's consistently outperformed NSC over the past two decades. So it simply depends on if you're willing to give up some current income to take a shot that CSX will generate more capital appreciation.
Looking Ahead
Upcoming Earnings:
There is little happening this week in terms of earnings. This is NOT a list of ALL companies reporting this week, so please be sure to check for earnings of any companies that you own or add. Any companies in BOLD represent stocks in one of our Portfolios:
- Monday: None
- Tuesday: None
- Wednesday: STZ ($47 billion)
- Thursday: None
- Friday: None
Key Economic Reports:
- Monday: June PMI manufacturing, June ISM manufacturing, May construction spending
- Tuesday: May JOLTS
- Wednesday: June ADP employment report, initial jobless claims, June PMI composite, May factory orders, June ISM services
- Thursday: Holiday - Market Closed
- Friday: June nonfarm payrolls
Historical Data
I'm a true stock market historian. I am absolutely PASSIONATE about studying stock market history to provide us more clues about likely stock market direction and potential sectors/industries/stocks to trade. While I don't use history as a primary indicator, I'm always very aware of it as a secondary indicator. I love it when history lines up with my technical signals, providing me much more confidence to make particular trades.
Below you'll find the next two weeks of historical data and tendencies across the 3 key indices that I follow most closely:
S&P 500 (since 1950)
- Jul 1: +72.87%
- Jul 2: +14.01%
- Jul 3: +75.99%
- Jul 4: Holiday - market closed
- Jul 5: +37.05%
- Jul 6: +22.32%
- Jul 7: +17.62%
- Jul 8: +9.86%
- Jul 9: +49.73%
- Jul 10: -21.87%
- Jul 11: +17.67%
- Jul 12: +34.91%
- Jul 13: -5.67%
- Jul 14: +60.75%
NASDAQ (since 1971)
- Jul 1: +59.12%
- Jul 2: -54.43%
- Jul 3: +39.88%
- Jul 4: Holiday - market closed
- Jul 5: -0.11%
- Jul 6: -10.79%
- Jul 7: +60.19%
- Jul 8: -12.27%
- Jul 9: +87.83%
- Jul 10: -36.79%
- Jul 11: +24.47%
- Jul 12: +127.49%
- Jul 13: +61.52%
- Jul 14: +72.46%
Russell 2000 (since 1987)
- Jul 1: +40.88%
- Jul 2: -119.74%
- Jul 3: +45.08%
- Jul 4: Holiday - market closed
- Jul 5: +0.47%
- Jul 6: -76.61%
- Jul 7: +43.95%
- Jul 8: +32.76%
- Jul 9: +37.96%
- Jul 10: -29.19%
- Jul 11: -5.21%
- Jul 12: +82.21%
- Jul 13: +63.13%
- Jul 14: -1.06%
The S&P 500 data dates back to 1950, while the NASDAQ and Russell 2000 information date back to 1971 and 1987, respectively.
Final Thoughts
Time will tell, but I believe the weakness we've seen recently in semiconductors is likely to continue for awhile. A rebound to potentially form a double top (or at least to recover much of the short-term losses) is a definite possibility, but the higher the rebound, the more the risk grows in owning stocks in this space. It won't be until we see a breakout above the bearish engulfing candle that printed a little over a week ago that I'd be convinced the semiconductor rally isn't over. If I'm right, however, the weakness to be felt in that area will help to fuel other key areas to leadership roles.
Here are a few things to consider in the week ahead:
- Magnificent 7. There is no doubt that NVDA losses would provide head winds for this elite group of 7 behemoth large cap stocks. But I can honestly see significant strength in other names like AAPL, MSFT, AMZN, META, GOOGL, and TSLA to easily offset NVDA's relative weakness. Many traders have watched NVDA rip to the upside and cannot fathom the possibility that this chip juggernaut might struggle for awhile, but it happens folks. There was a period when no one thought TSLA could struggle, yet look at what's happened the past few years. TSLA remains 50% off its November 2021 high. I don't see NVDA falling for an extended period, but could it struggle for a few months? Absolutely.
- Interest Rates. The 10-year treasury yield ($TNX) has been downtrending, but late last week (and today) we've seen rates climb again. If the TNX can close above its 50-day SMA, a trip back to 4.60%, or even possibly 4.70%, could happen. While earnings are very calm and quiet this week, we do have significant economic reports this week, including Friday's nonfarm payrolls, that could have a big impact on rates.
- Earnings. As I mentioned, earnings will be nearly non-existent this week, but many stocks do make large pre-earnings runs to the upside ahead of its quarterly reports. TSLA has a history of doing it and we're seeing a very strong push to the upside in TSLA over the past few weeks.
- Rotation. I cannot emphasize this enough. Secular bull markets are known for their resiliency. When one leader falls, another leads. This rotation sustains bull markets. If semiconductors do struggle over the next few weeks to few months, I fully expect to see other areas pick up the slack. I still like both software ($DJUSSW) and computer hardware ($DJUSCR) in technology, plus many areas that are improving in consumer discretionary (XLY). The two leaders, AMZN and TSLA, both look like they're poised to make pre-earnings runs over the next 3-4 weeks.
- Volatility Index ($VIX). The VIX is back below 13 and that's always very good news for U.S. equities. A low VIX means low expectations for volatility, which, in turn, usually means higher prices for stocks. This is a signal from market makers - and I take those seriously.
- History. The end of June until July 17th tends to be bullish for U.S. equities. Therefore, I'm not looking for a big tumble in stocks, at least not yet. I believe we could see that later in August and throughout September. For now, I'll remain long, but I'll be looking mostly outside of semiconductors for opportunities.
Feedback
If you'd like to share your thoughts on our Weekly Market Report, positive or negative, you can reach us at "[email protected]".
Happy trading!
Tom