
EB Weekly Market Report - Monday, July 8, 2024
ChartLists
None of our regular ChartLists were updated this week as there was little in the way of earnings reports last week. However, we did update two Upcoming Earnings ChartLists for this Thursday and Friday, when we'll begin to see Q2 earnings reports released. Most notably, the large banks will be reporting on Friday to include JP Morgan (JPM), Citigroup (C), and Wells Fargo (WFC).
Weekly Market Recap
Major Indices
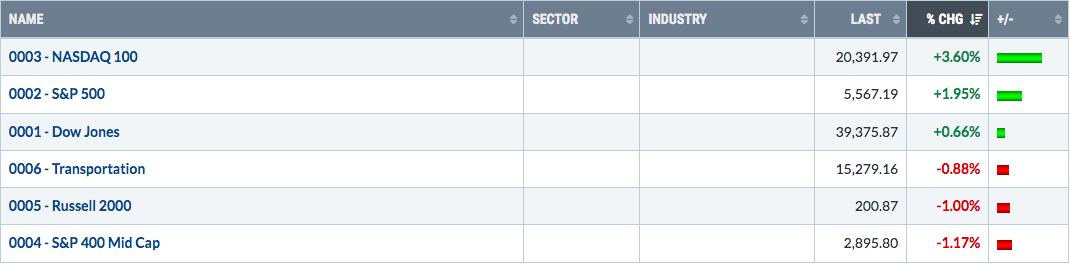
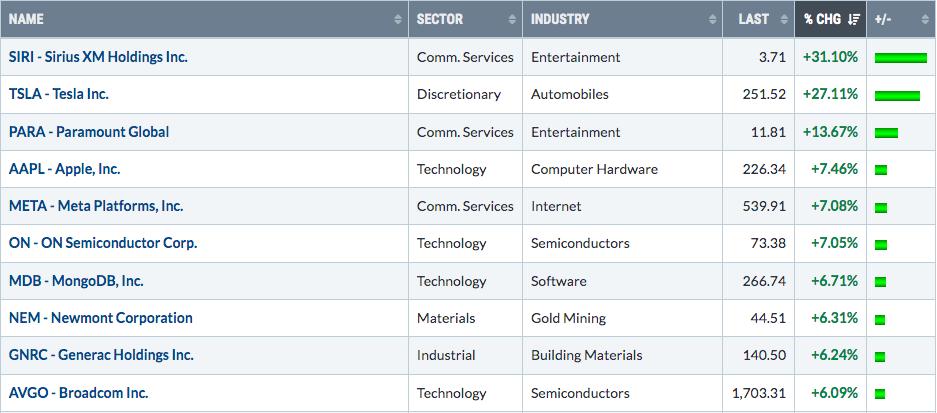
The NASDAQ 100 clearly was in the driver's seat last week as money continued to pour into semiconductors ($DJUSSC). But the DJUSSC wasn't the only source of relative strength. In fact, the DJUSSC barely edged out the benchmark S&P 500 (+2.72% vs. +1.95%). Instead, computer hardware ($DJUSCR, +6.85%) and software ($DJUSSW, +3.74%) provided leadership. Tesla (TSLA, +27.11%) definitely did its part for the NASDAQ 100. Throw in broadline retailers ($DJUSRB, +3.26%) and internet ($DJUSNS, +5.38%) and it was easy to see why the NASDAQ 100 led.
Sectors
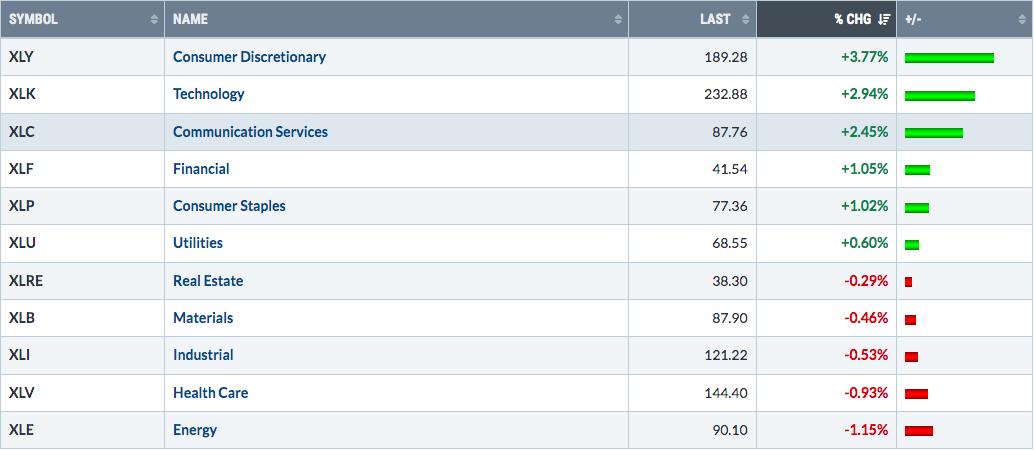
I understand the concept of market breadth and why so many technicians are concerned about it, but to me, it's nothing more than a secondary indicator. Technicians have been calling market tops for the past 12-18 months, citing breadth issues. Yet stocks continue to rise. One thing that most technicians are ignoring is that most stocks continue to move higher, they're just not moving higher as fast as the large cap names. Call me crazy, but I'd rather see the large cap names outperforming, as owner of both the QQQ and SPY. After all, both of these track the two key indices, and they are both MARKET-CAP WEIGHTED.
Other technicians try to pull the "equal-weighted" argument, saying that if we weight every company the same, then this equal-weighted rendition is badly lagging its market-cap weighted counterpart. I'm sorry, but I've never understood why equal weighting is as important or more important than market-cap weighting. It makes no sense to me. For example, why in the world would we compare Amazon.com (AMZN), with its 1.5 million employees to Etsy, Inc. (ETSY), with its 2,400 employees. Would it make someone feel better if ETSY performed extremely well and AMZN fell through the floor? Those 2400 ETSY employees might get nice bonuses, while a portion of AMZN's huge staff might be laid off. And AMZN's weak performance would certainly suggest to me that consumer spending, which makes up two-thirds of our GDP, is a problem.
Top 10 Industries Last Week
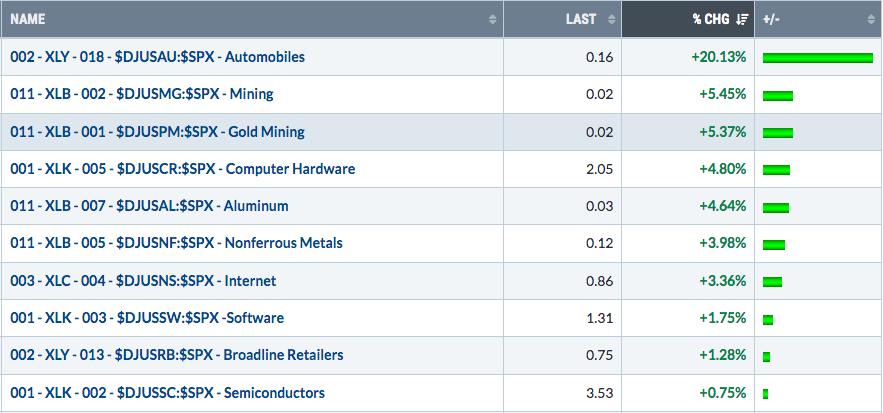
During secular bull markets, I pay little attention to topping patterns as they rarely execute. However, areas that benefited from the inflation trade MIGHT be a bit different. I still expect most areas to rise (think rising tides lift all boats), but I'd be a bit more cautious with most commodity-related industries. For example, nonferrous metals ($DJUSNF) clearly have printed a bearish head & shoulders top:
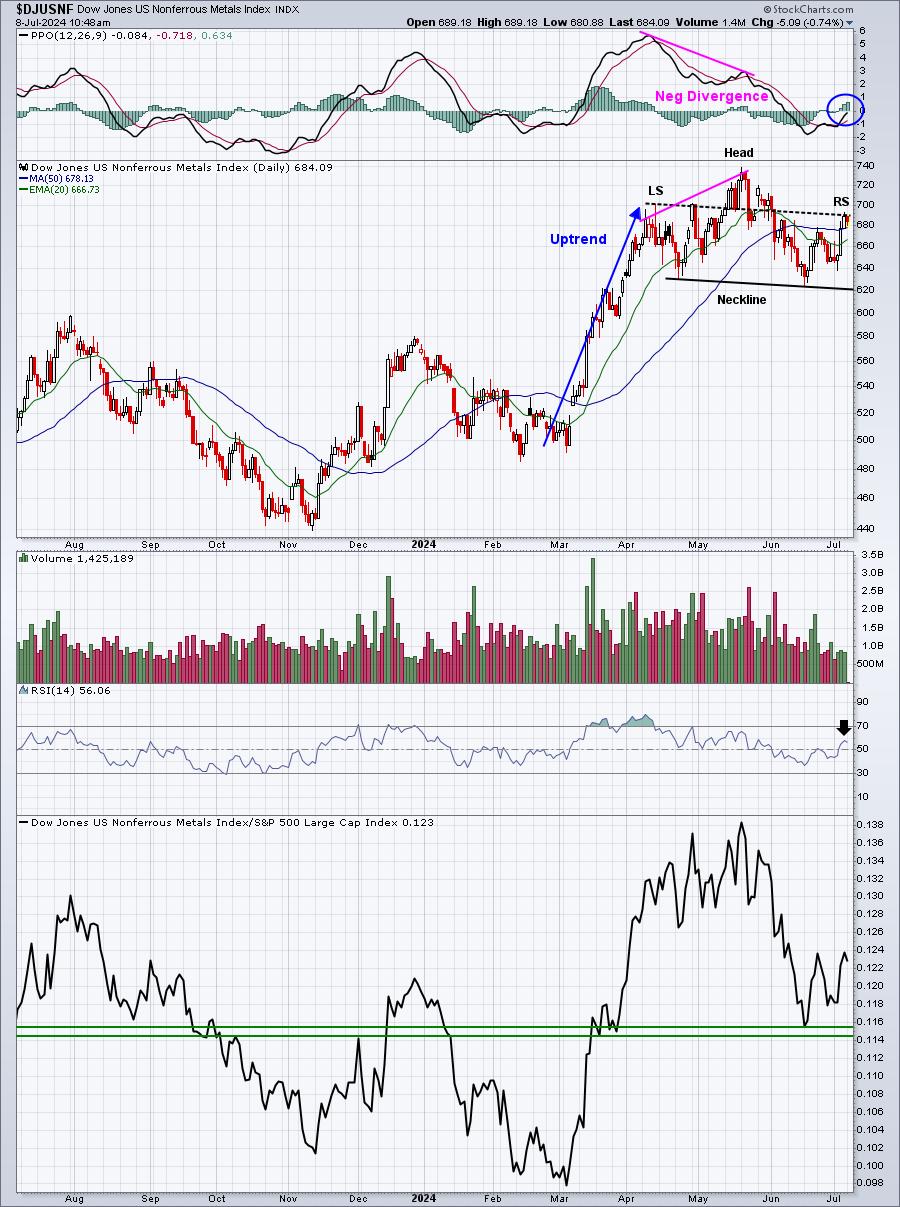
This is a CLASSIC pattern. So many negatives line up. First, we had the uptrend. You can't have a topping pattern if you have no uptrend. Check. This latest push to the upside is accompanied by very light volume, while the move lower into the right shoulder was accompanied by heavy volume. The latest strength has seen the RSI approach 60, while the PPO moves up to test the zero line from underneath. Relative strength has turned decidedly lower. At the very top, a negative divergence (slowing momentum) emerged.
The ONLY redeeming factor, in my opinion, is that Freeport McMoran (FCX) essentially makes up this nonferrous metals index and it usually performs well when copper prices rise. That was a problem for roughly 6 weeks as copper prices plummeted, but they are definitely on the rebound now:
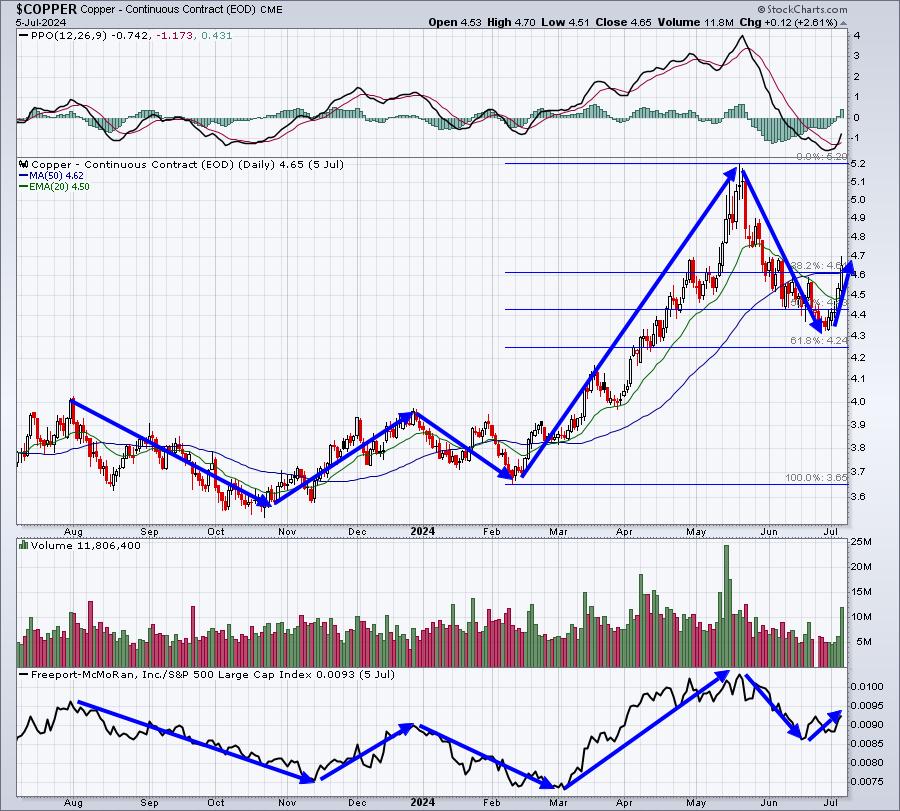
Copper prices are the one commodity whose price is very positively correlated to the global economy and also, over decades, is positively correlated to the benchmark S&P 500. I believe we're in a secular bull market that will carry equity prices higher for the next several years. If I'm correct, then it's doubtful we'll see a big drop in copper prices. That would be the primary argument to ignore the topping head & shoulders pattern on copper - at least wait for a breakdown, don't anticipate one.
Bottom 10 Industries Last Week
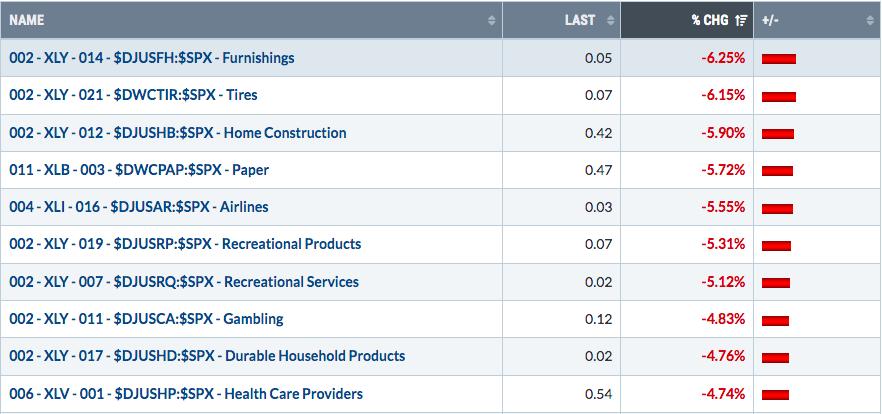
We know that the 10-year treasury yield ($TNX) is teetering, though it has been mostly trending lower since April. The falling TNX, though, hasn't had a big impact on the home construction ($DJUSHB), as this group has been downtrending despite the move lower in the TNX and, by extension, mortgage rates. Check this chart out:
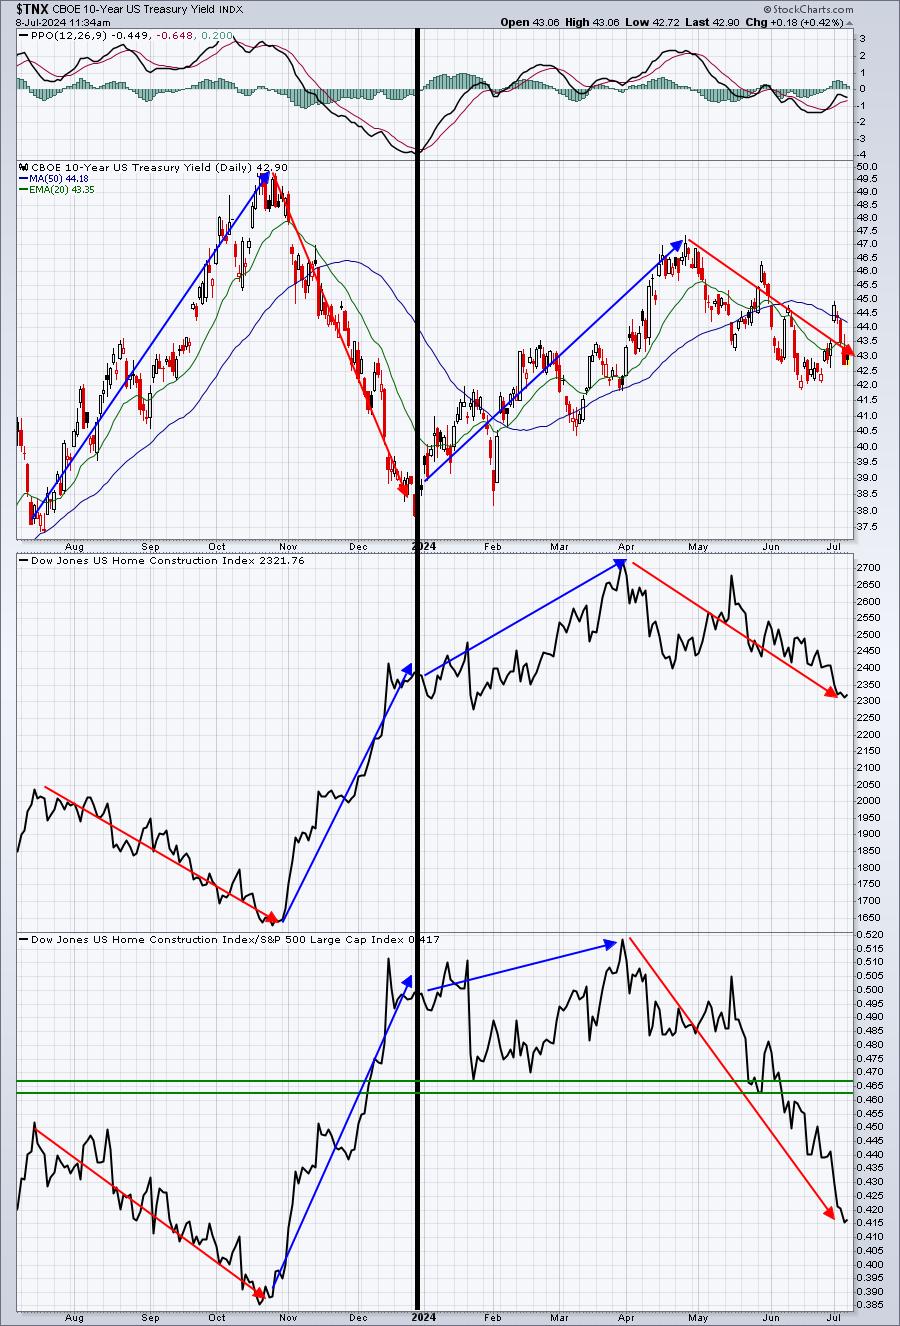
The 2nd half of 2023, the relationship here was clear and made good common sense. As rates increased, home construction stocks underperformed the benchmark S&P 500. When rates fell into Q4, home construction soared on a relative basis, right? What the heck has happened in 2024?
It seems as though home construction can't gain ground in either scenario. While I don't have the perfect answer, I do interpret this to mean that Wall Street is nervous about the economic picture moving forward, yet another signal to the Fed to LOWER RATES NOW.
Top 10 Stocks - S&P 500/NASDAQ 100
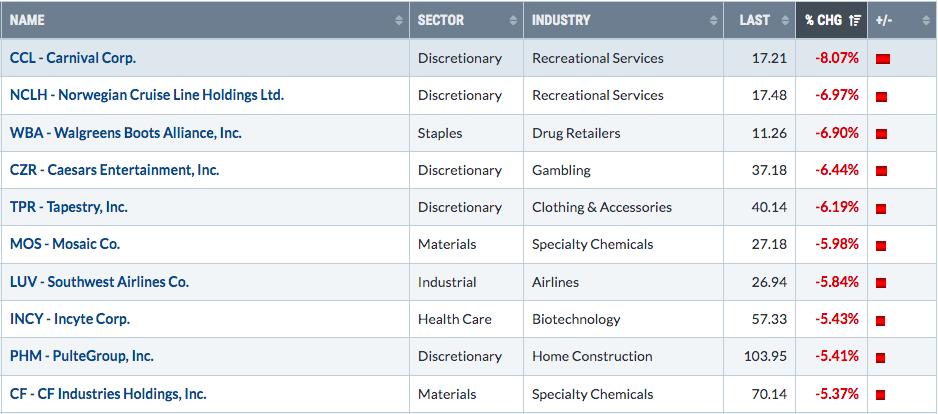
Bottom 10 Stocks - S&P 500/NASDAQ 100
Big Picture
Here's an update of the Big Picture, 100-year chart of the S&P 500:
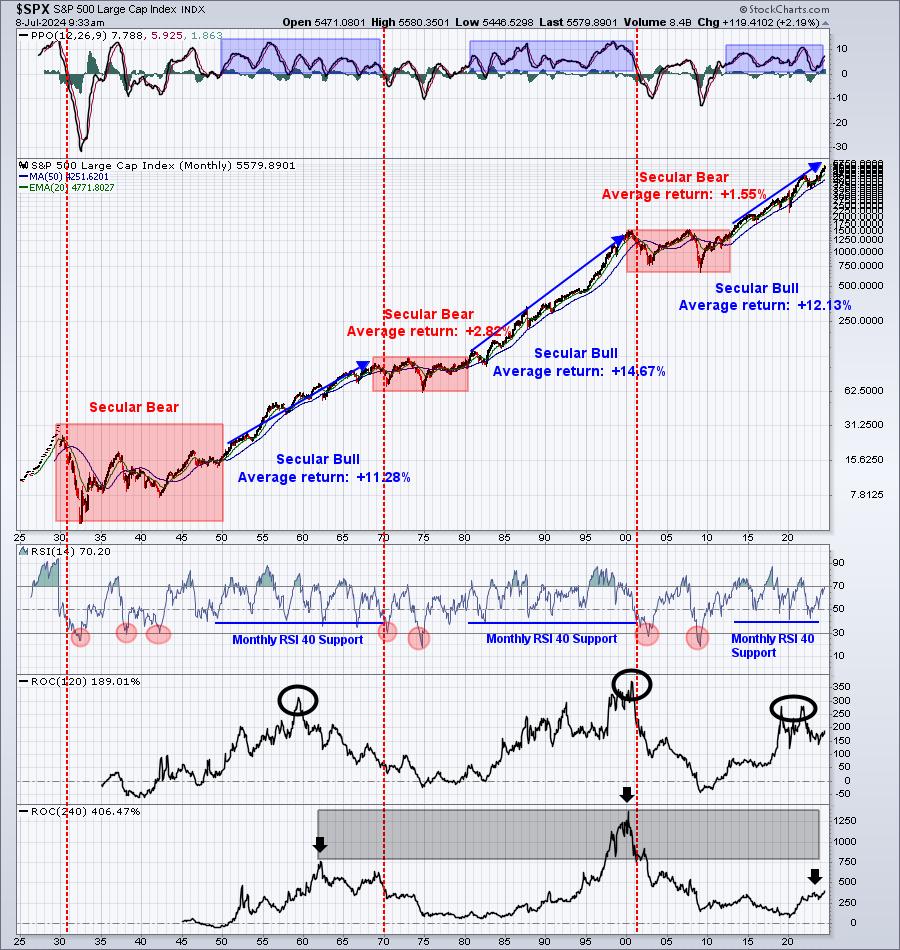
I have noticed that the bottom panel is showing a rising 240-month (20 years) rate of change on the S&P 500. When this turn happened in the late 1950s, it spurred its biggest move in this ROC indicator. The same thing happened in the late 1980s and early 1990s. These both occurred about 10 years into their respective secular bull markets and opened the door to the biggest advances during those secular bull market runs. We're currently in our 11th year of this secular bull market and we might be seeing the exact same setup. I am very bullish the balance of this decade and this turn higher would support my opinion.
Rotation/Intermarket Analysis
Here's the latest look at our key intraday ratios as we follow where the money is traveling on an INTRADAY basis (ignoring gaps):
QQQ:SPY
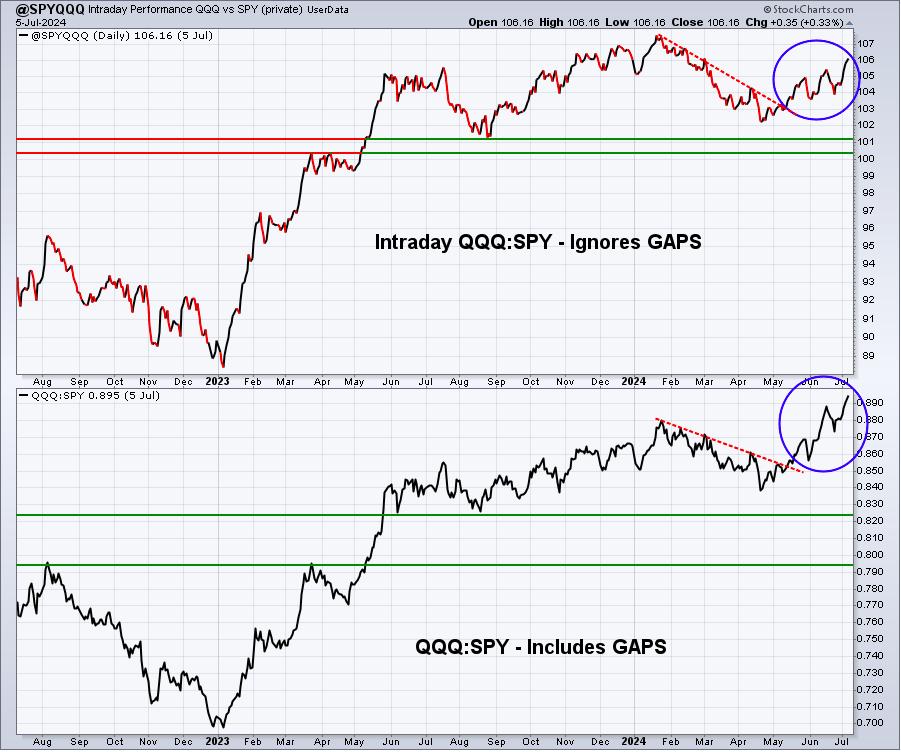
This chart can only be interpreted one way. It's VERY BULLISH. This is a "risk-on" ratio and it's telling us that traders are willing to commit lots of capital into very aggressive areas. This lines up seasonally with Q2 pre-earnings advances and also with Presidential Election cycles. Check out that section below.
IWM:QQQ
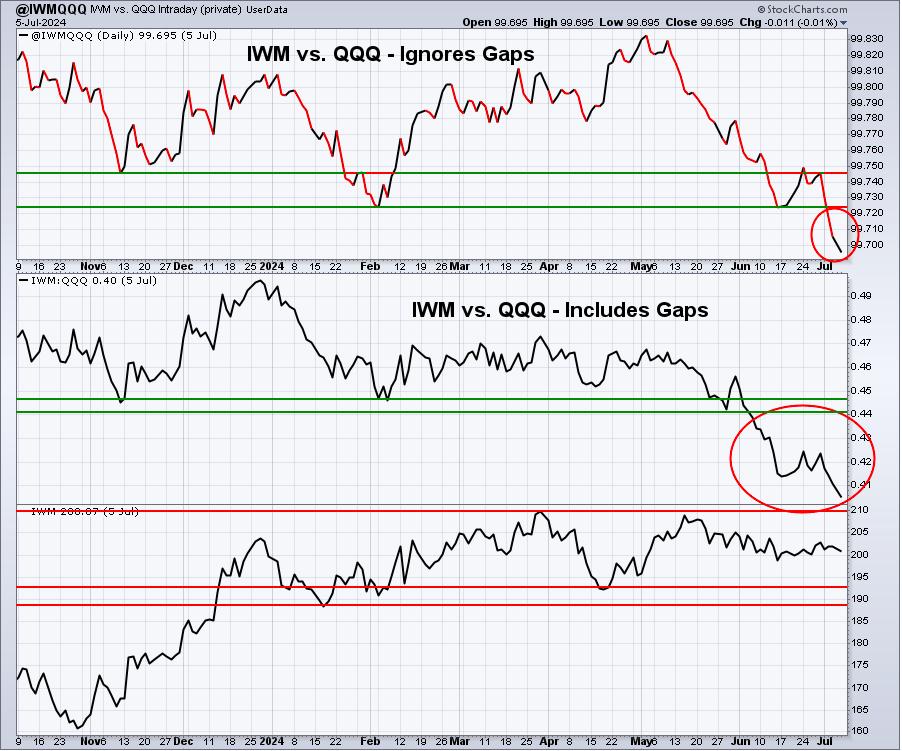
I've been discussing recently my change in attitude towards small caps, suggesting that we should wait to see an IWM breakout above 211 before expecting much in the way of relative strength - at least the probability of sustained relative strength. Given last week's IWM:QQQ relative support breakdown, I'm changing my stance on small caps altogether. The large caps remain in favor, so my trading will incorporate more short-term trades among this asset class. I haven't given up on small caps. Rather, I simply want to see absolute and relative strength before committing any additional capital to this area of the market. Last week's relative breakdown was rather emphatic.
XLY:XLP
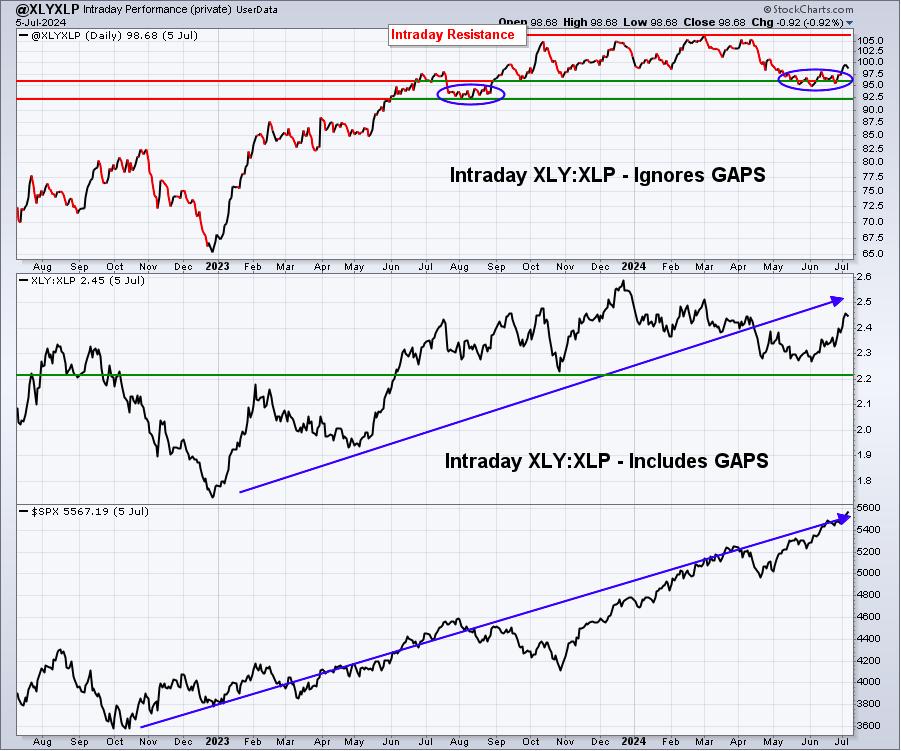
Consumer discretionary tends to perform well during the first half of summer and we're seeing it again. I've been waiting to see this ratio turn higher to support the advance in the S&P 500. We haven't seen a breakout in the XLY:XLP ratio, but it does appear that this ratio is now trending higher after its period of sideways consolidation. It looks quite similar to the sideways consolidation we saw back in August 2023, just before significant strength in the XLY.
Presidential Election Cycle
Here's a look at a User-Defined Index that I created to track how the S&P 500 typically performs during Presidential Election Years (every 4th year starting with 1952). This covers the last 18 Presidential Election years and highlights, at least historically, when we might expect advances and declines:
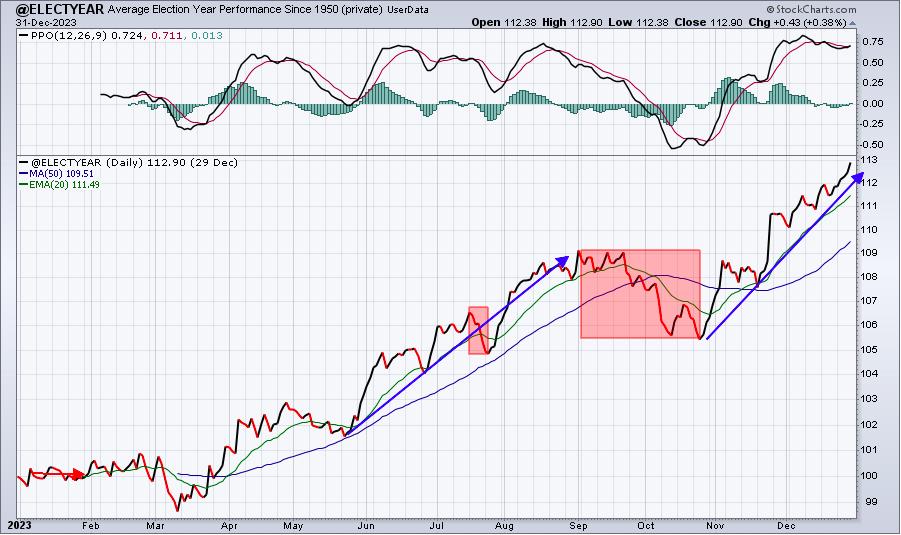
Currently, we're riding a very strong Presidential Election cycle through mid- to late-August. Their can be a hiccup in mid-July, which happens to be one of the weakest weeks of the year historically, including ALL years. Other than that, we should expect rising prices. The truly bearish period during Presidential Election years is typically found in the mid-August to late-October time frame. That's not much different than the typically bearish period in ALL years.
This is just one more reason why betting against this secular bull market advance can be extremely frustrating. There are simply too many signals right now that tell us to remain long. Maybe we'll see a bit of selling in mid-July as earnings are reported (sell the news?). Otherwise, I believe the risk remains with those shorting or sitting out the current uptrend.
Sustainability Ratios - Growth vs. Value
I am constantly following my sustainability ratios. Secular bull markets are fairly consistent in that they are fueled by rotation and aggressive leadership. I am personally of the belief that when Wall Street begins repositioning for a period of significant decline, we'll see that repositioning show up in these ratios. And not just one or two of them, but very typically ALL of them. Here are the ratios that I most closely follow:
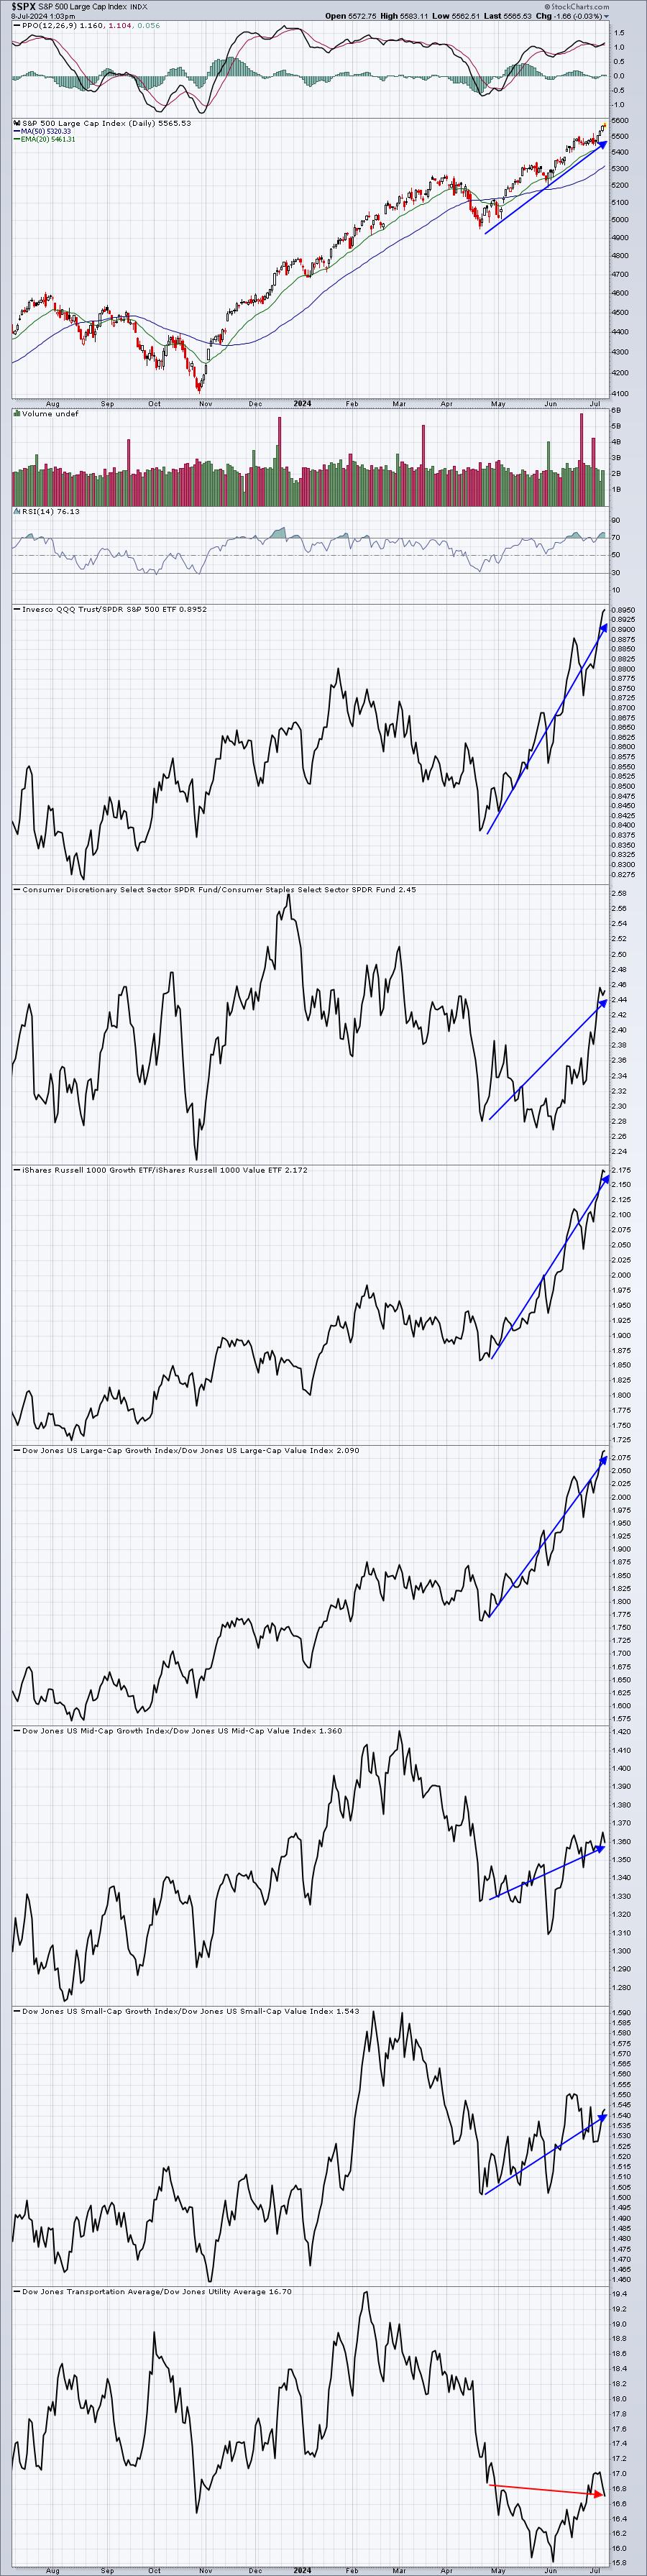
During the S&P 500's latest secular bull market rally (late-April low), all the way up to its current all-time high level, 6 of my 7 key ratios have turned up with it. In other words, money is rotating into areas that typically drive the stock market higher and higher. This is GREAT news. Are we subject to pullbacks from time to time? Sure, but don't let the talking heads sway you into thinking a deep bear market is right around the corner. I just don't see it.
Long-Term Trade Setup
Since beginning this Weekly Market Report in early September, I've discussed the long-term trade candidates below that I really like. Generally, these stocks have excellent long-term track records and many pay nice dividends that mostly grow every year. Only in very specific cases (exceptions) would I consider a long-term entry into a stock that has a poor or limited long-term track record:
- JPM
- BA
- FFIV
- MA
- GS
- FDX
- AAPL
- CHRW
- JBHT
- STX
- HSY
- DIS
- MSCI
- SBUX
- KRE
- ED
- AJG
- NSC
Keep in mind that our Weekly Market Reports favor those more interested in the long-term market picture. Therefore, the list of stocks above are stocks that we believe are safer (but nothing is ever 100% safe) to own with the long-term in mind. Nearly everything else we do at EarningsBeats.com favors short-term momentum trading, so I wanted to provide an explanation of what we're doing with this list.
No stocks are being added to our Long-Term Trade list this week.
Looking Ahead
Upcoming Earnings:
There is little happening this week in terms of earnings. This is NOT a list of ALL companies reporting this week, so please be sure to check for earnings of any companies that you own or add. Any companies in BOLD represent stocks in one of our Portfolios:
- Monday: None
- Tuesday: None
- Wednesday: None
- Thursday: PEP ($224 billion), DAL ($31 billion)
- Friday: JPM ($599 billion), WFC ($211 billion), C ($123 billion), BK ($45 billion)
Key Economic Reports:
- Monday: None
- Tuesday: None
- Wednesday: May wholesale inventories
- Thursday: June CPI, initial jobless claims
- Friday: June PPI, July consumer sentiment
Historical Data
I'm a true stock market historian. I am absolutely PASSIONATE about studying stock market history to provide us more clues about likely stock market direction and potential sectors/industries/stocks to trade. While I don't use history as a primary indicator, I'm always very aware of it as a secondary indicator. I love it when history lines up with my technical signals, providing me much more confidence to make particular trades.
Below you'll find the next two weeks of historical data and tendencies across the 3 key indices that I follow most closely:
S&P 500 (since 1950)
- Jul 8: +9.86%
- Jul 9: +49.73%
- Jul 10: -21.87%
- Jul 11: +17.67%
- Jul 12: +34.91%
- Jul 13: -5.67%
- Jul 14: +60.75%
- Jul 15: +16.81%
- Jul 16: +5.72%
- Jul 17: +21.91%
- Jul 18: -27.51%
- Jul 19: +6.25%
- Jul 20: -3.71%
- Jul 21: -29.02%
NASDAQ (since 1971)
- Jul 8: -12.27%
- Jul 9: +87.83%
- Jul 10: -36.79%
- Jul 11: +24.47%
- Jul 12: +127.49%
- Jul 13: +61.52%
- Jul 14: +72.46%
- Jul 15: +46.40%
- Jul 16: -19.01%
- Jul 17: +69.68%
- Jul 18: -53.30%
- Jul 19: -8.58%
- Jul 20: +22.38%
- Jul 21: -57.94%
Russell 2000 (since 1987)
- Jul 8: +32.76%
- Jul 9: +37.96%
- Jul 10: -29.19%
- Jul 11: -5.21%
- Jul 12: +82.21%
- Jul 13: +63.13%
- Jul 14: -1.06%
- Jul 15: +77.23%
- Jul 16: -94.94%
- Jul 17: +17.83%
- Jul 18: -34.47%
- Jul 19: +27.57%
- Jul 20: +25.11%
- Jul 21: -98.75%
The S&P 500 data dates back to 1950, while the NASDAQ and Russell 2000 information date back to 1971 and 1987, respectively.
Final Thoughts
It'll be another VERY interesting week ahead as earnings, inflation, interest rates, semiconductors, overbought conditions, breadth issues, and rotation will all be center stage.
Here are a few things to consider in the week ahead:
- Inflation. The June CPI and PPI reports will be released on Thursday and Friday. Consensus estimates on both Core CPI and Core PPI are 0.2%. Those are the numbers to watch. The good news is that May's inflation numbers were lower than expected, calming inflationary fears and rekindling talks of upcoming cuts in the fed funds rate. The bad news is that the June 2023 Core CPI reading was very low at +.19%. Given this month's estimate of +0.20%, if the number comes in at +0.2% or higher, the annual Core CPI number will move higher. Will that spook traders temporarily? Will the media spin this in a bearish way? (Duh). As a result, I do think the risks will grow for bulls as we head into the latter part of the week.
- Interest Rates. The 10-year treasury yield ($TNX) remains in a downtrend, but what happens if inflation comes in higher than expected? That's a risk the bulls will be dealing with late in the week.
- Earnings. Ready for Q2 earnings results? If not, you'd better get ready as JP Morgan (JPM), Wells Fargo (WFC), and Citigroup (C) headline the large money center banks that will report their latest results on Friday. What will Jamie Dimon say, because he clearly knows more about stock market direction than anyone (sarcasm intended). Don't get me wrong, I believe Jamie Dimon is brilliant and he's overseen tremendous shareholder value and growth over many years at the helm. I just wouldn't get my stock market advice from his as his track record in that area isn't great.
- Rotation. Rotation to date has been awesome. Semiconductors took the lead for a long time, driving both the S&P 500 and NASDAQ 100 much, much higher. As this group has cooled off, we've seen money ROTATE, not leave the market. It's rotated into autos as TSLA has skyrocketed. It's rotated into internet as GOOGL, META, and NFLX rallies highlight. It's rotated into broadline retail as AMZN recently made a big breakout. Another breakout in semiconductors and NVDA would be great, though I'd be patient with this group to see if they can actually make another closing breakout above the recent bearish engulfing candle high. I have a healthy dose of skepticism there.
- Volatility Index ($VIX). The VIX remains in the 12s for now, which is absolutely BULLISH. Don't let any bears tell you otherwise. Only until the VIX pierces the 20 level would I grow nervous about this index.
- History. We remain in a bullish period. I'll grow a bit more nervous as the summer drags on. For now, however, I'd be quite surprised if we didn't see further record highs set over the next several weeks.
Feedback
If you'd like to share your thoughts on our Weekly Market Report, positive or negative, you can reach us at "[email protected]".
Happy trading!
Tom