
EB Weekly Market Report - Monday, July 15, 2024
ChartLists
The following ChartLists have been updated and our now available for viewing or downloading from our website:
- Strong Earnings (SECL)
- Strong Future Earnings (SFECL)
- Raised Guidance (RGCL)
- 5 Upcoming Earnings for the week ending July 19th
- Upcoming Earnings Relative Strength
I will be working on updating the Strong AD (SADCL) and Bullish Trifecta (BTCL) over the next 2-3 days.
Weekly Market Recap
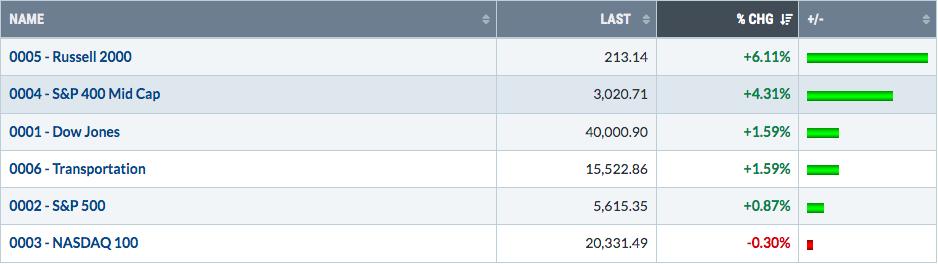
Major Indices
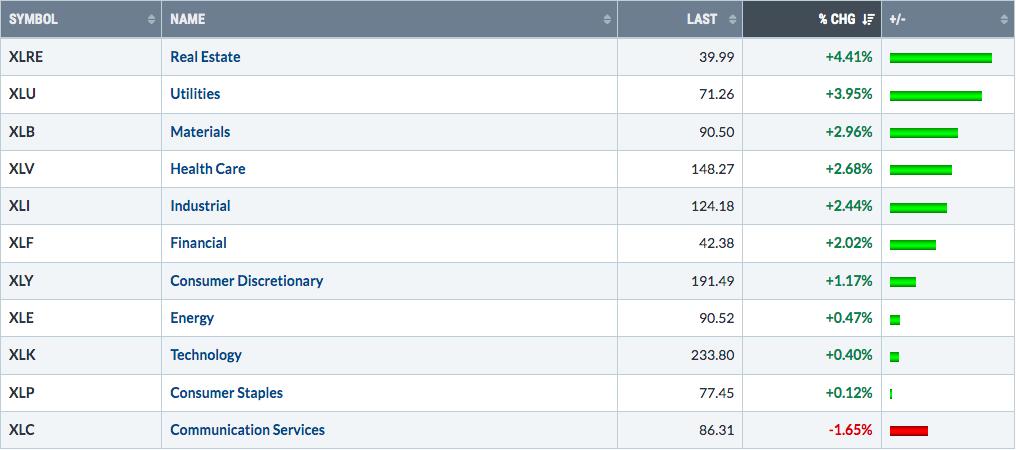
Sectors
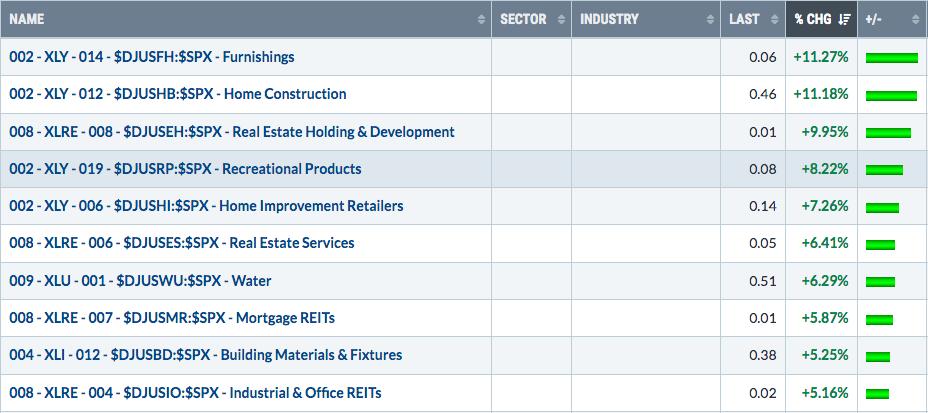
Top 10 Industries Last Week
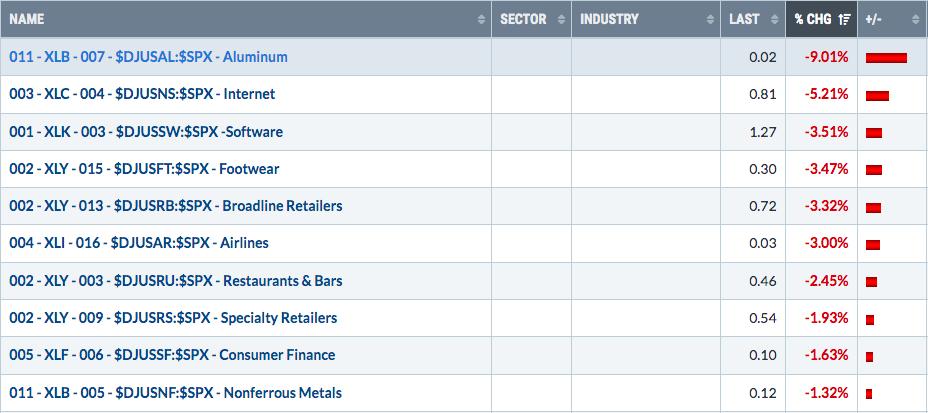
Bottom 10 Industries Last Week
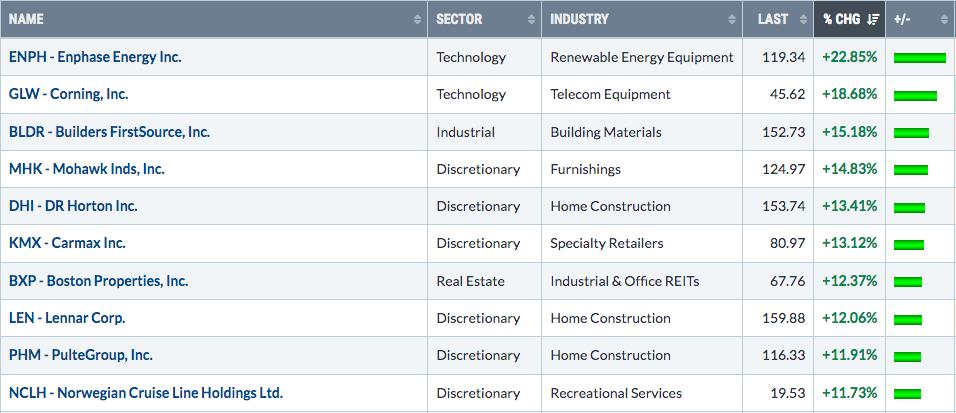
Top 10 Stocks - S&P 500/NASDAQ 100
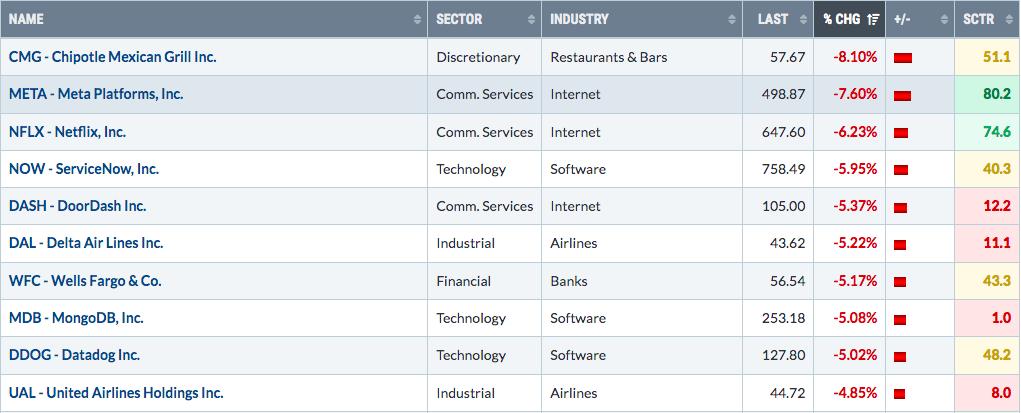
Bottom 10 Stocks - S&P 500/NASDAQ 100
Big Picture
Here's an update of the Big Picture, 100-year chart of the S&P 500:
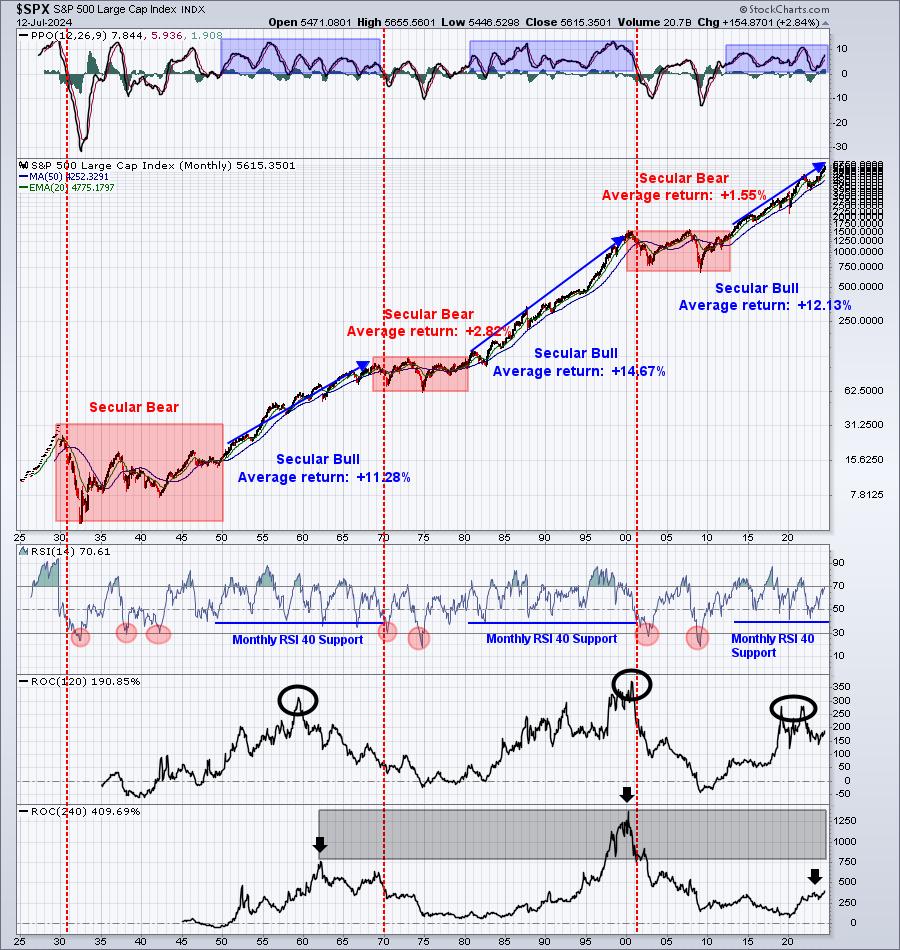
This is my "go to" chart for the long-term. It shows prices rising and the monthly PPO going along for the ride to the upside, which demonstrates long-term bullish momentum. This is the type of long-term bullishness where it rarely pays to be in cash or on the short side of the market. Yet, many traders still do it.
I remain very optimistic about the long-term of the S&P 500. Yes, I will occasionally discuss short-term issues that I'm watching, but that's all it is - SHORT-TERM issues. I'm growing increasingly annoyed with the Fed, which seemingly ignores every piece of benign inflation data. I do believe that this failure to lower interest rates could intensify short-term selling later this summer, but it does not change my longer-term call for higher prices in Q4, 2025, and beyond.
Rotation/Intermarket Analysis
Here's the latest look at our key intraday ratios as we follow where the money is traveling on an INTRADAY basis (ignoring gaps):
QQQ:SPY
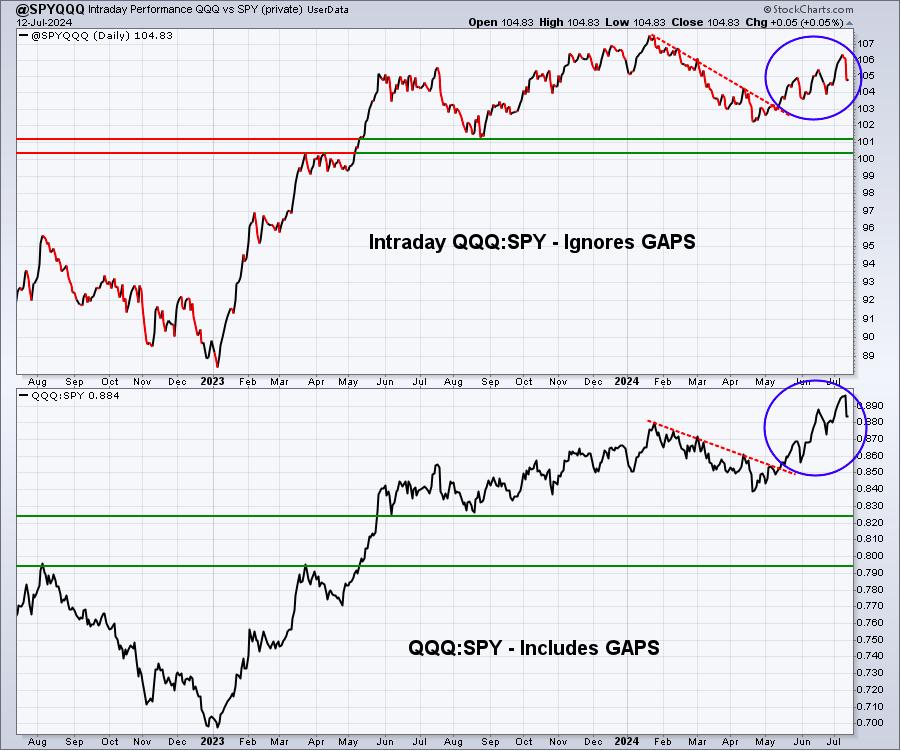
This ratio struggled last week as rotation clearly favored the more value-oriented S&P 500. The QQQ's lack of relative strength on an intraday day basis is a short-term concern as it suggests Wall Street is likely repositioning during the trading day into areas that are a bit more defensive. Both panels, however, are rising and printing higher highs and lows, a bullish signal.
IWM:QQQ
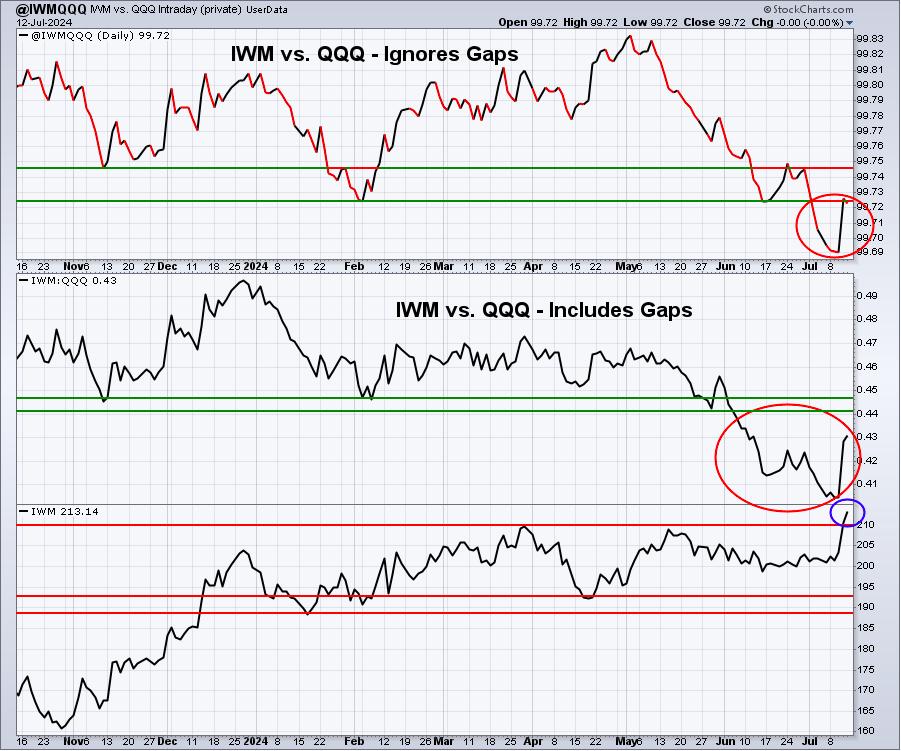
One week after I began losing faith in small cap stocks, they absolutely soared on a relative basis. Go back to the very beginning of this report and check out how the IWM performed last week, relative to the other key indices. It wasn't close. Small caps absolutely soared. I love the price breakout above the 210-211 range and believe odds increased that the IWM is now heading to 230-235, another 10% higher than where it closed on Friday. For that to happen, we'll likely need to see the IWM:QQQ ratio continue to trend higher, gaining momentum after last week's bullish performance.
XLY:XLP
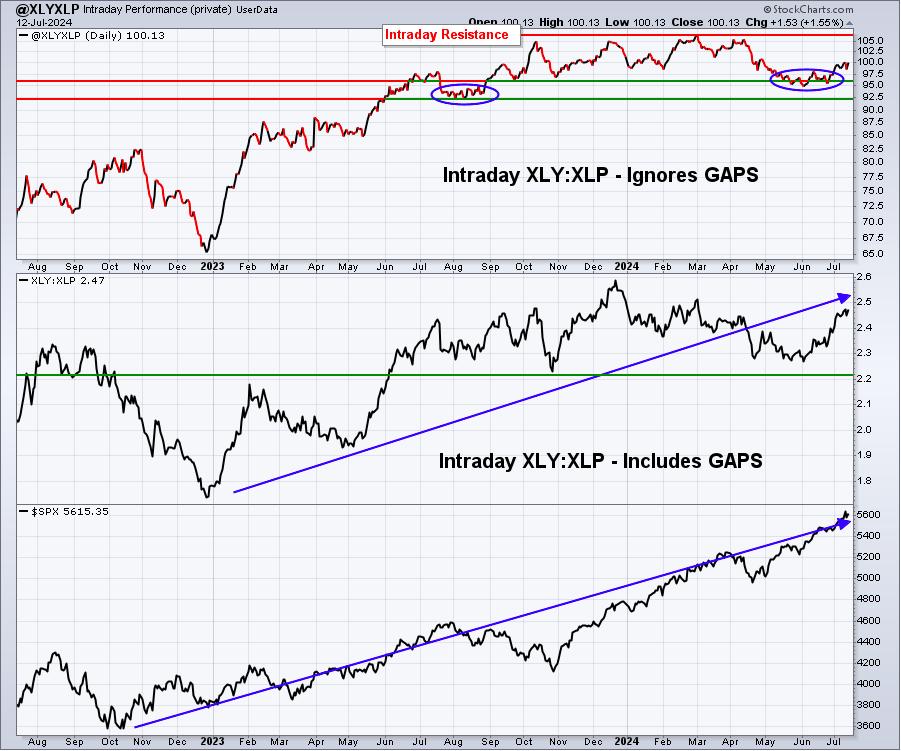
There's still more work to do on this chart, but the recent strength is an excellent sign. The XLY:XLP ratio is one of my favorite sustainability ratios, if not my favorite. I find it extremely useful to compare the direction of the XLY:XLP ratio to the S&P 500 to see if any directional move is sustainable, either higher or lower.
Sentiment
5-day SMA ($CPCE)
Our "speed boat" sentiment indicator has a very strong history of predicting short-term reversals in the stock market, though I believe excess fear does a better job of marking short-term bottoms than excess greed does of marking short-term tops. Nonetheless, I definitely see tremendous value in tracking this 5-day simple moving average (SMA) of the equity only put call ratio ($CPCE) to let me know when risks are increasing - either on the long side or the short side. We received one of those signals (topping) last week as the CPCE's 5-day SMA hit .54, which has been a historical marker for short-term market tops. The fact that it comes just before July monthly options expiration week adds a bit more short-term caution to my current market approach. Check out the signal triggered last week:
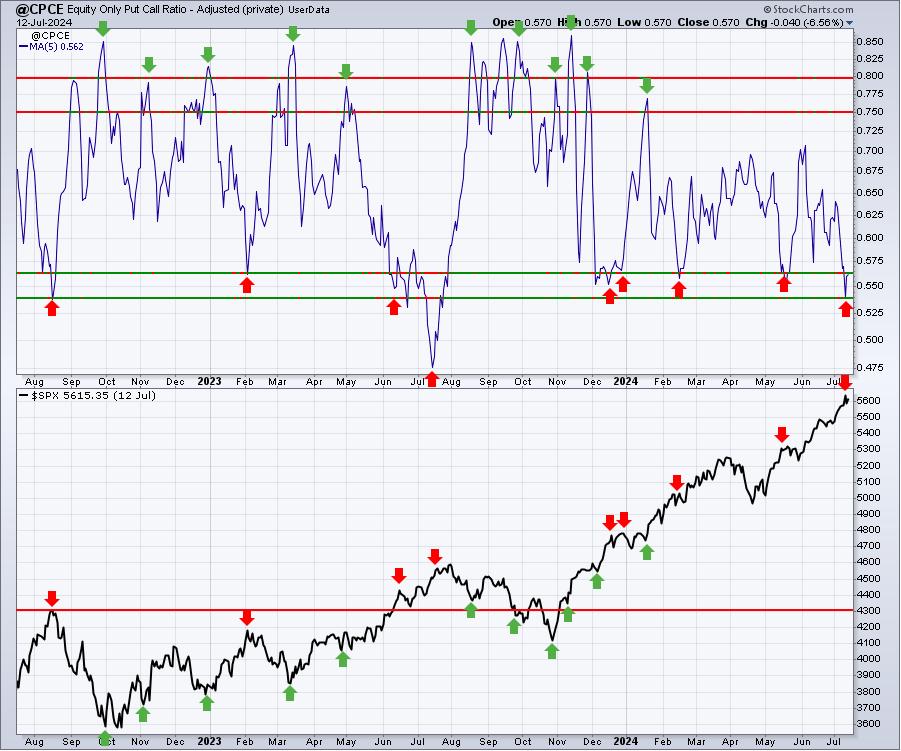
You can see the history of this signal over the past couple years and come to your own conclusions. However, we've seen a couple large drops when this 5-day SMA hits .54. We've more typically seen minor, short-term drops, and occasionally we've seen little impact at all. But, in my mind, there is NO doubt that risks are elevated as more and more traders pile into call options, especially given the magnitude of options-expiration week.
My "ocean liner" long-term sentiment signal, which is the 253-day simple moving average (SMA) of the CPCE remains in a downtrend, which historically accompanies very bullish market action. It is a BIG reason why I remain VERY BULLISH the S&P 500's long-term prospects.
Sustainability Ratios - Growth vs. Value
Last week, the key sustainability ratios that I follow were all quite strong. What a difference a week can make. I wouldn't exactly say these ratios are screaming lower, because most remain in solid uptrends. But the character of the market seemed to change last week and it's worth paying attention to this week as well:
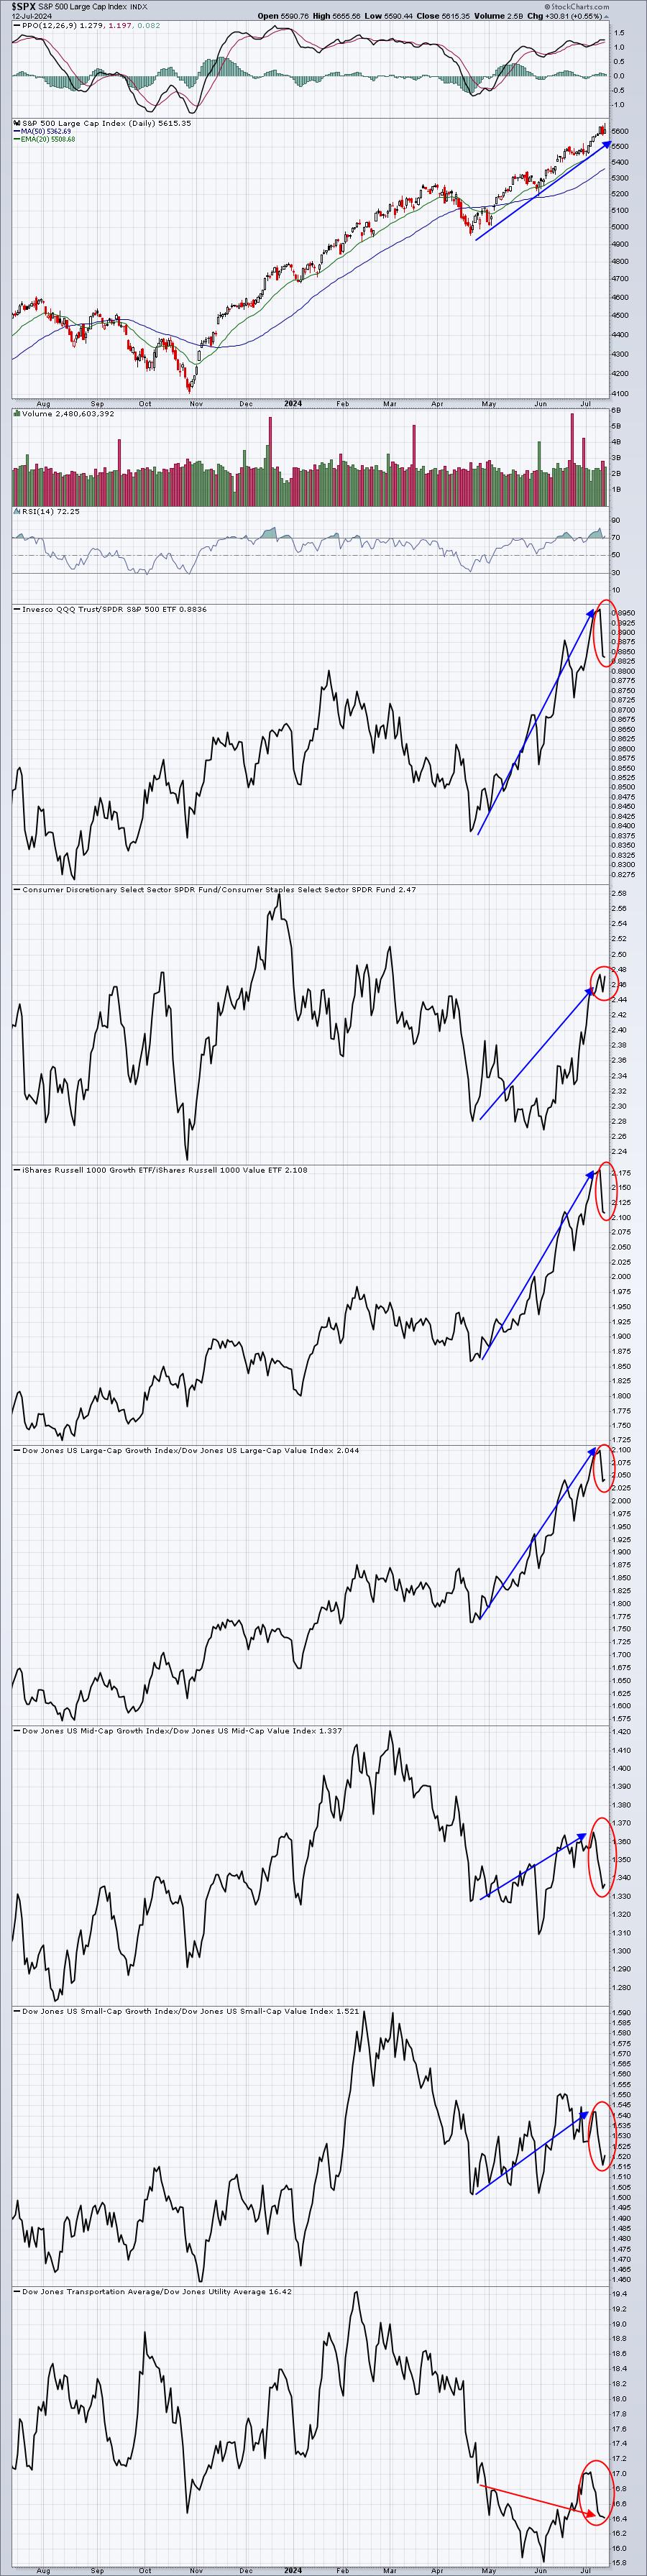
Of all of these sustainability ratios, only the XLY:XLP held up well though.
Long-Term Trade Setup
Since beginning this Weekly Market Report in early September, I've discussed the long-term trade candidates below that I really like. Generally, these stocks have excellent long-term track records and many pay nice dividends that mostly grow every year. Only in very specific cases (exceptions) would I consider a long-term entry into a stock that has a poor or limited long-term track record:
- JPM
- BA
- FFIV
- MA
- GS
- FDX
- AAPL
- CHRW
- JBHT
- STX
- HSY
- DIS
- MSCI
- SBUX
- KRE
- ED
- AJG
- NSC
Keep in mind that our Weekly Market Reports favor those more interested in the long-term market picture. Therefore, the list of stocks above are stocks that we believe are safer (but nothing is ever 100% safe) to own with the long-term in mind. Nearly everything else we do at EarningsBeats.com favors short-term momentum trading, so I wanted to provide an explanation of what we're doing with this list.
No stocks are being added to our Long-Term Trade list this week.
Looking Ahead
Upcoming Earnings:
There is little happening this week in terms of earnings. This is NOT a list of ALL companies reporting this week, so please be sure to check for earnings of any companies that you own or add. Any companies in BOLD represent stocks in one of our Portfolios:
- Monday: GS ($154 billion), BLK ($123 billion)
- Tuesday: UNH ($464 billion), BAC ($327 billion), MS ($170 billion), PNC ($67 billion)
- Wednesday: ASML ($419 billion), JNJ ($360 billion), ELV ($124 billion)
- Thursday: TSM ($957 billion), NFLX ($281 billion), ISRG (157 billion)
- Friday: AXP ($172 billion), SLB ($66 billion), TRV ($48 billion)
Key Economic Reports:
- Monday: July empire state manufacturing index
- Tuesday: June retail sales, May business inventories, July housing market index
- Wednesday: June housing starts & building permits, June industrial production & capacity utilization, beige book
- Thursday: Initial jobless claims, July Philadelphia Fed manufacturing index, June leading indicators
- Friday: None
Historical Data
I'm a true stock market historian. I am absolutely PASSIONATE about studying stock market history to provide us more clues about likely stock market direction and potential sectors/industries/stocks to trade. While I don't use history as a primary indicator, I'm always very aware of it as a secondary indicator. I love it when history lines up with my technical signals, providing me much more confidence to make particular trades.
Below you'll find the next two weeks of historical data and tendencies across the 3 key indices that I follow most closely:
S&P 500 (since 1950)
- Jul 15: +16.81%
- Jul 16: +5.72%
- Jul 17: +21.91%
- Jul 18: -27.51%
- Jul 19: +6.25%
- Jul 20: -3.71%
- Jul 21: -29.02%
- Jul 22: -15.08%
- Jul 23: -29.39%
- Jul 24: +6.94%
- Jul 25: +20.36%
- Jul 26: +25.71%
- Jul 27: +9.03%
- Jul 28: -21.72%
NASDAQ (since 1971)
- Jul 15: +46.40%
- Jul 16: -19.01%
- Jul 17: +69.68%
- Jul 18: -53.30%
- Jul 19: -8.58%
- Jul 20: +22.38%
- Jul 21: -57.94%
- Jul 22: -10.84%
- Jul 23: -94.90%
- Jul 24: -26.31%
- Jul 25: +38.83%
- Jul 26: +12.75%
- Jul 27: -16.15%
- Jul 28: -53.85%
Russell 2000 (since 1987)
- Jul 15: +77.23%
- Jul 16: -94.94%
- Jul 17: +17.83%
- Jul 18: -34.47%
- Jul 19: +27.57%
- Jul 20: +25.11%
- Jul 21: -98.75%
- Jul 22: +28.68%
- Jul 23: -87.84%
- Jul 24: -77.56%
- Jul 25: +37.68%
- Jul 26: +42.58%
- Jul 27: -61.56%
- Jul 28: +10.48%
The S&P 500 data dates back to 1950, while the NASDAQ and Russell 2000 information date back to 1971 and 1987, respectively.
Final Thoughts
It's time to welcome another earnings season! The large, money center banks kicked off earnings on Friday in rather fashionable style with key revenue and earnings beats from the likes of JPM, C, and WFC. Inflation data was quite tame and small caps (IWM), of all stocks, soared like they haven't seen in a long time, setting a new 52-week high. What do we do for an encore?
Here are a few things to consider in the week ahead:
- Earnings. We'll begin to see the release of earnings reports accelerate over the next 3-4 weeks. We'll start with many Dow Jones components and other similar stocks. Banks will definitely be in focus for another week or two. Netflix (NFLX) and American Express (AXP) are two key earnings reports that I'll be watching this week.
- Economic Reports. Every economic report will be under scrutiny. Signals are flying at the Fed to lower rates NOW. They've said they're "data-dependent". So it only makes sense to keep looking at data. Inflation last week was benign and we're continuing to move on a steady path to the Fed's 2% target for Core CPI.
- Rotation. The biggest rotation to date took place at the end of last week. There was insatiable demand for small cap stocks to close out the week. When was the last time that could be said? Will it continue? Price action and the IWM's price breakout says YES, but we know how fickle the stock market is. Let's watch it all develop.
- Monthly Options Expiration. Didn't we just have one of these? It's hard to believe it's already been a month since our last one. While our Friday Max Pain report shows that the net in-the-money call premium isn't nearly as bad as last month, we do still see max pain levels about 4-5% below current prices on the SPY and QQQ.
- History. Overall, July tends to be rather bullish, but we will have to navigate a bearish historical week beginning at the close on Wednesday, July 17th. This week ranks as the 3rd most bearish calendar period since 1950, trailing only periods in September and October.
Feedback
If you'd like to share your thoughts on our Weekly Market Report, positive or negative, you can reach us at "[email protected]".
Happy trading!
Tom