
EB Weekly Market Report - Monday, July 22, 2024
Schedule
My schedule has returned back to normal as I'm back home from traveling the past few days. I was unable to publish an EB Weekly Portfolio Report, but I will have that updated either on Friday or Saturday this week. I also want to remind everyone that a new Model ETF Portfolio was announced last week and took effect at the close on Friday, July 19th.
Upcoming Event
Please mark your calendar for Saturday, July 27th at 10:00am ET. We have a very timely event, "Why The S&P 500 May Tumble", which will incorporate both the historical Presidential Election cycle AND the current technical and economic signals that we all need to be aware of. I'm providing this now, so that we can all track possible signals that trouble is brewing later in Q3. It's a MUST ATTEND event (or check out the recording) for all members, whether you concentrate more on short-term trading or long-term investing. We truly value all of our EB members, and this event is one of many ways we try to show it.
I hope to see you there!
Weekly Market Recap
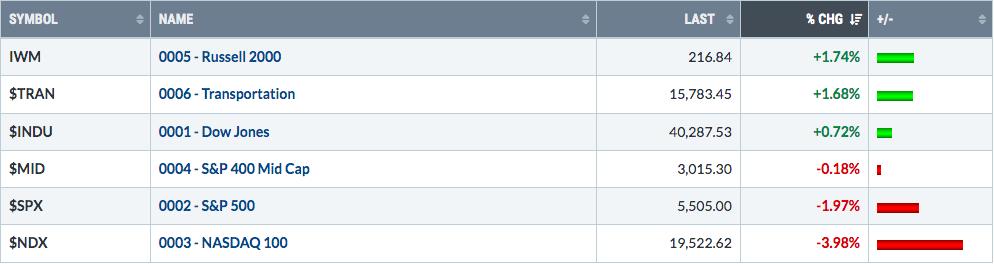
Major Indices
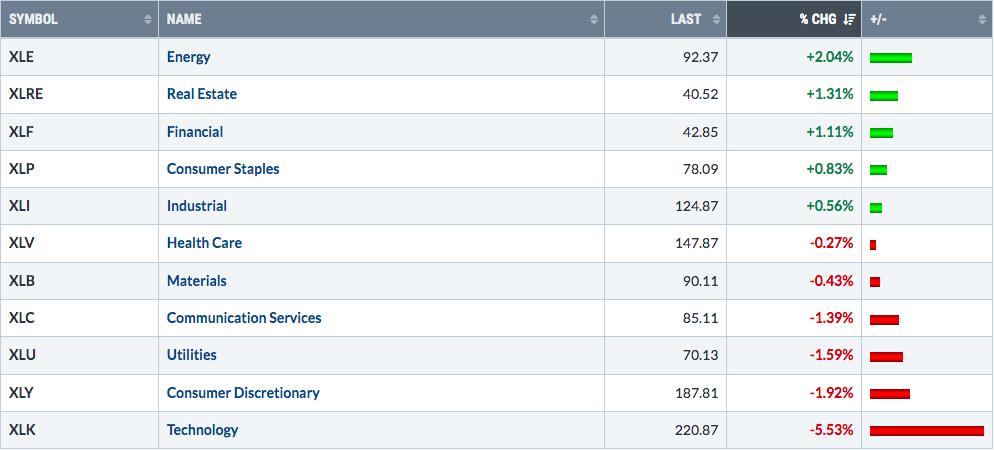
Sectors
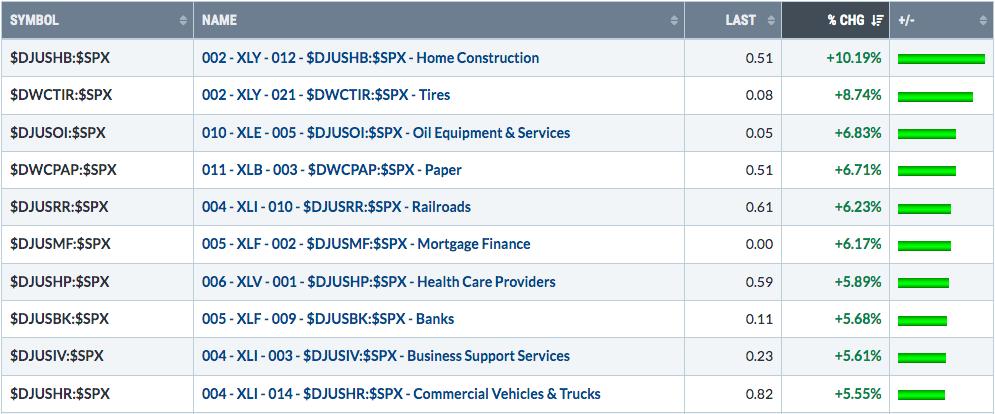
Top 10 Industries Last Week
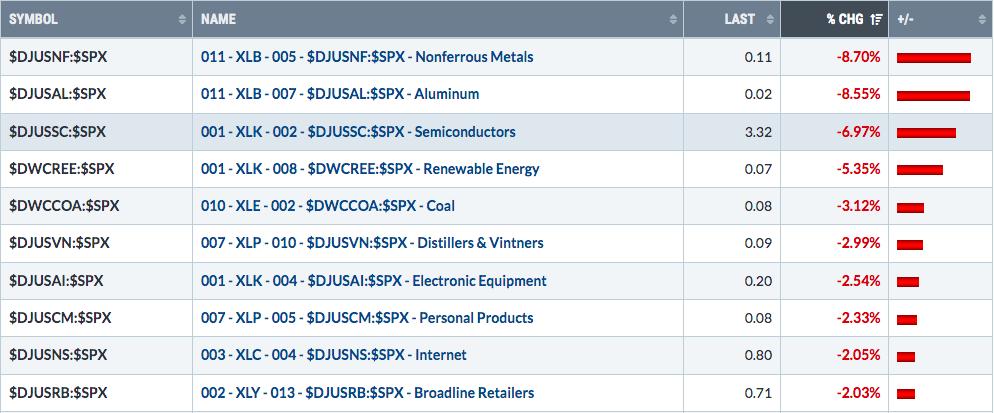
Bottom 10 Industries Last Week
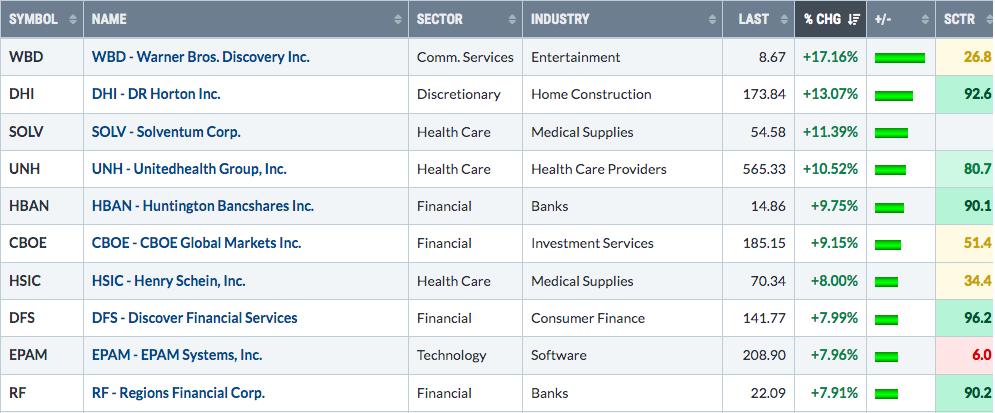
Top 10 Stocks - S&P 500/NASDAQ 100
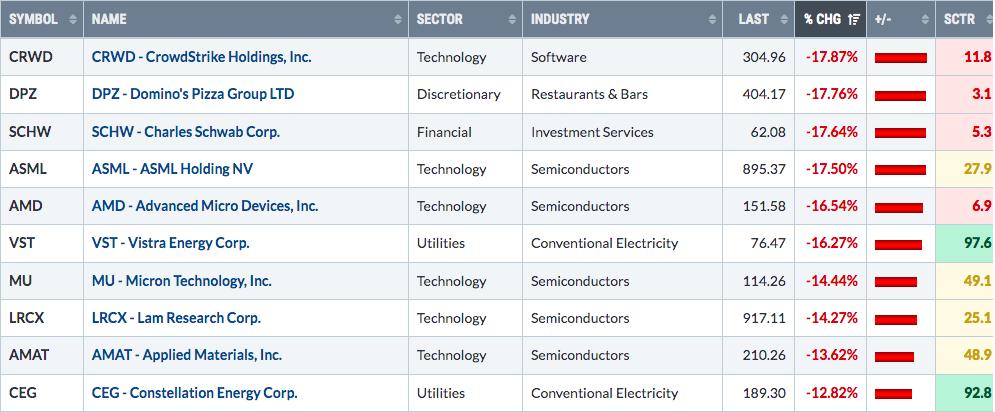
Bottom 10 Stocks - S&P 500/NASDAQ 100
Big Picture
Here's an update of the Big Picture, 100-year chart of the S&P 500:
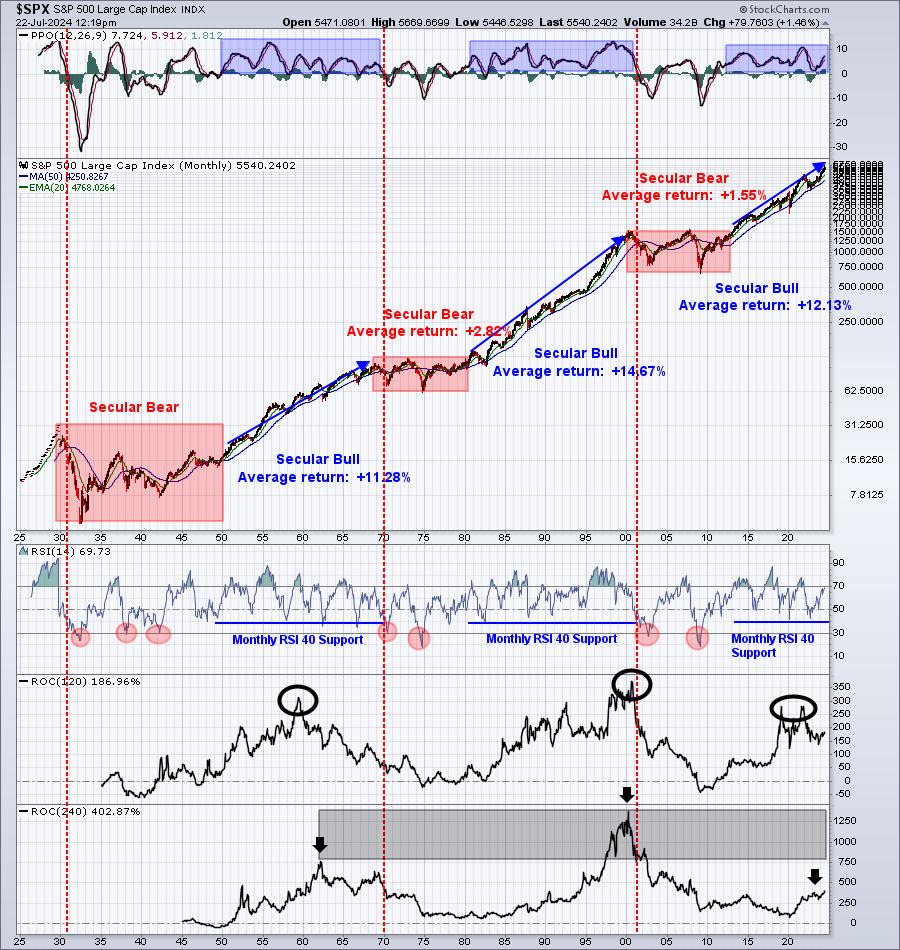
While I do believe we could witness some trouble in Q3, I think the odds of a cyclical bear market (20% drop or more) is very small, probably less than 5%. However, I believe the odds of a "correction" (10% drop or more) starting in 2024 is perhaps as high as 40-50%. In fact, last week's selling may have already kicked it off. Rather than an extended 6-9 months of weakness, I'd expect current weakness to extend no more than 3 months before a bottom is reached. I'll discuss more of these possibilities on Saturday at our event.
Rotation/Intermarket Analysis
Here's the latest look at our key intraday ratios as we follow where the money is traveling on an INTRADAY basis (ignoring gaps):
QQQ:SPY
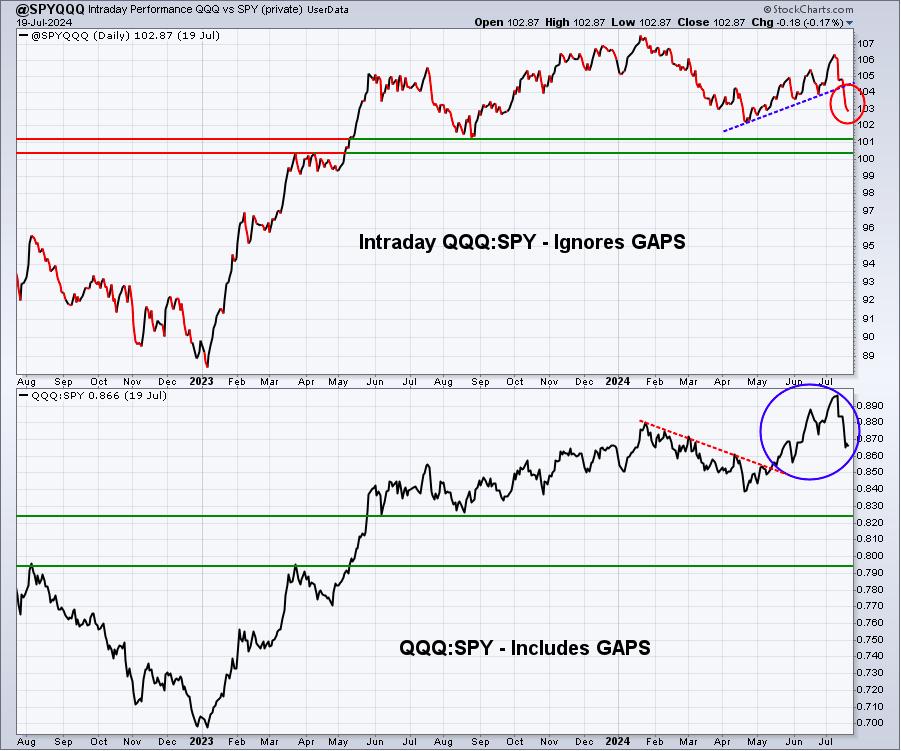
Money really rotated strongly away from the more aggressive QQQ. Keep in mind that the NAME of the chart is SPY:QQQ, but the actual numbers and chart represent the QQQ vs. the SPY (QQQ:SPY). After I named this User-Defined Index, I was unable to change it. That confuses a lot of folks when they review this chart.
The 100-101 support level is fairly important, in my view. During market weakness, we could see this ratio move towards this longer-term relative support zone, but it wouldn't be a good long-term sign if this level failed to hold as relative support.
IWM:QQQ
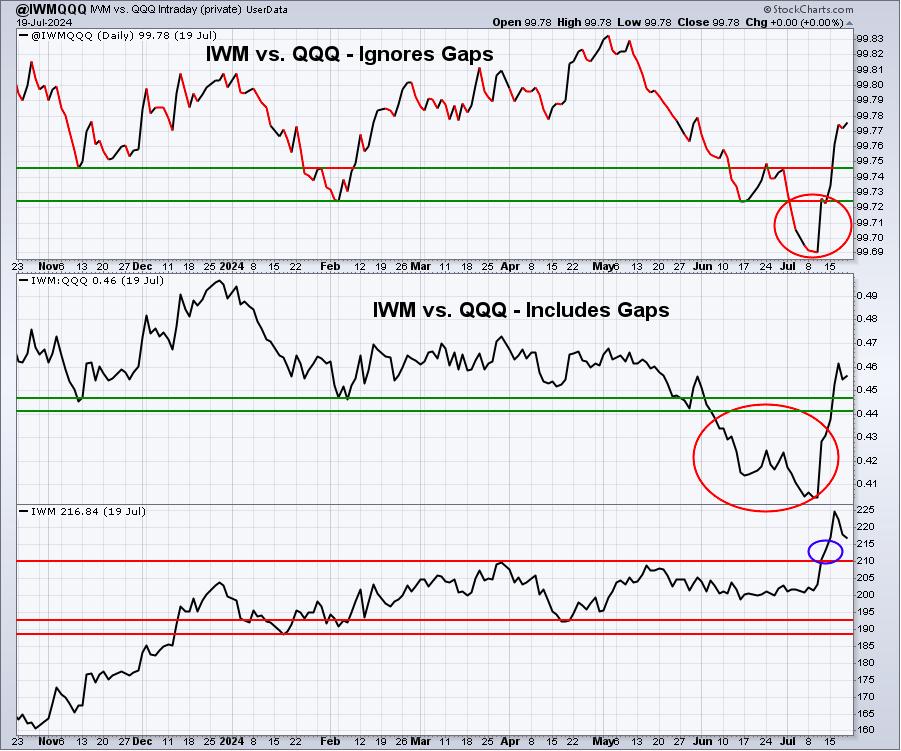
The big red circles show the big breakdown that spooked me two weeks ago. At that point, I wanted to see the IWM make the breakout at 210 or so before growing more bullish small caps. Well, that breakout happened and the IWM has seen tremendous relative strength since. At this point, the selling last week opens the door for a rebound in the IWM and new highs sooner rather than later - all in my opinion, of course.
XLY:XLP
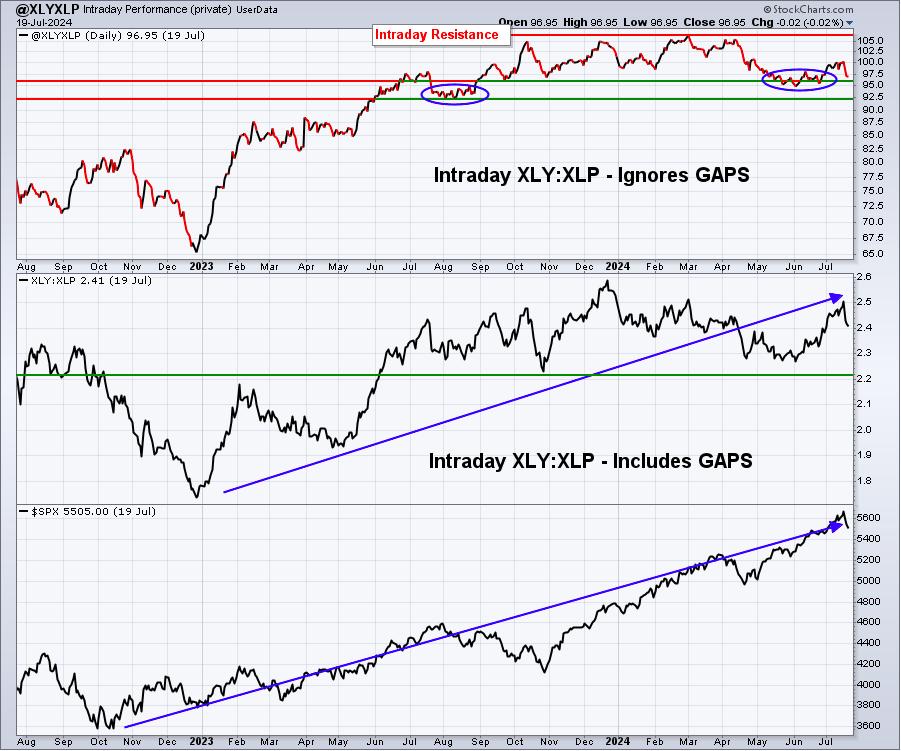
I'm still fine with this relative ratio, even though we've turned back down of late. The overall trend in the S&P 500, from a long-term perspective, is clearly higher to me. The only signal that would bother me on the XLY:XLP ratio would be a major relative support loss, which I would say is roughly the 92 level. Breaking that support doesn't mean we're heading for disaster ahead, but it would definitely be a more significant warning shot that the short-term warning signals discussed below in sentiment.
Sentiment
5-day SMA ($CPCE)
The 5-day SMA of the CPCE sent us a sell signal in the prior week and sent a repeat sell signal this past week. Check out the second move down to .54. As I mentioned last week, this is a historical marker of short-term S&P 500 tops:
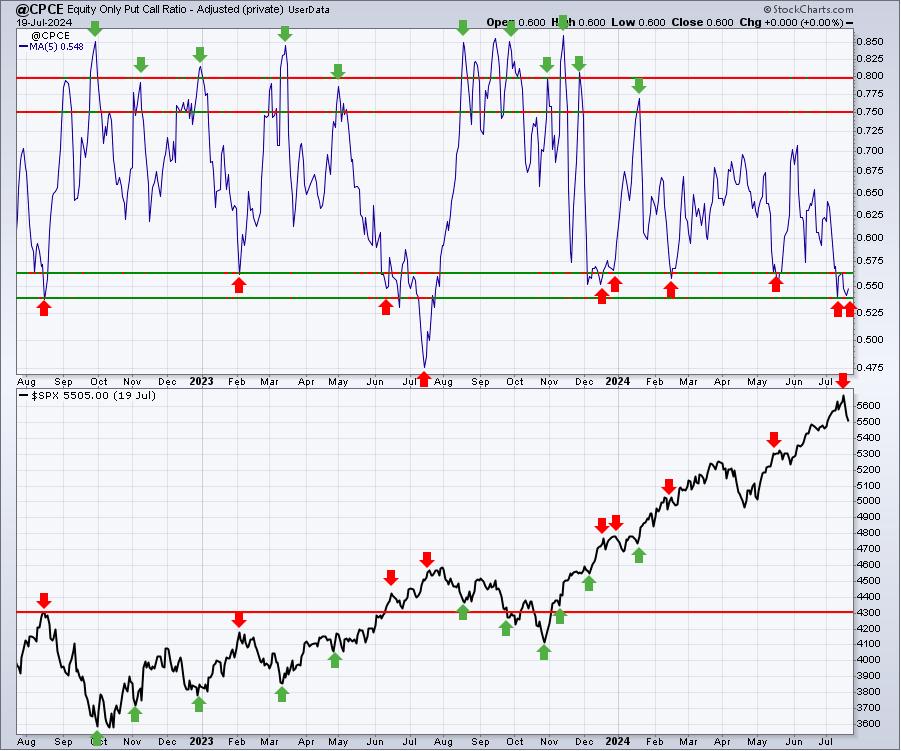
There is not a single indicator ANYWHERE that guarantees us stock market direction. I say it all the time, but I'll say it again. I DO NOT use any of my signals to provide me any sort of guarantee. I use these signals to help me evaluate risk in the stock market. I use this signal in corroboration with my many other signals, and many of them begin to reflect the same thing, I take notice. That was the case last week as we moved into a very bearish historical period (July 17th close - July 24th close), saw that July max pain suggested a potential decline, and observed a positive correlation (shown below) between the S&P 500 and the Volatility Index ($VIX), which usually is accompanied by a stock market reversal. In this case, that would be a move lower on the S&P 500, which is exactly what we saw. Throw in the semiconductor warning and top from June and risks were clearly elevated. We're also in the worst-performing calendar quarter of the year. Here is how our calendar quarters have performed over the past 75 years on the S&P 500:
- Quarter 1 (Jan, Feb, Mar): +8.57%
- Quarter 2 (Apr, May, Jun): +7.55%
- Quarter 3 (July, Aug, Sep): +2.33%
- Quarter 4 (Oct, Nov, Dec): +16.61%
This information simply tells me to lower my expectations this time of year. But when you throw in the other short-term warning signs, it's very easy for me to walk away from the market. There's always a chance the stock market ignores everything, so it's all about odds, not guarantees.
Volatility Index ($VIX)
I wanted to give everyone the visual of what the VIX-SPX correlation looks like, especially when correlation turns positive:
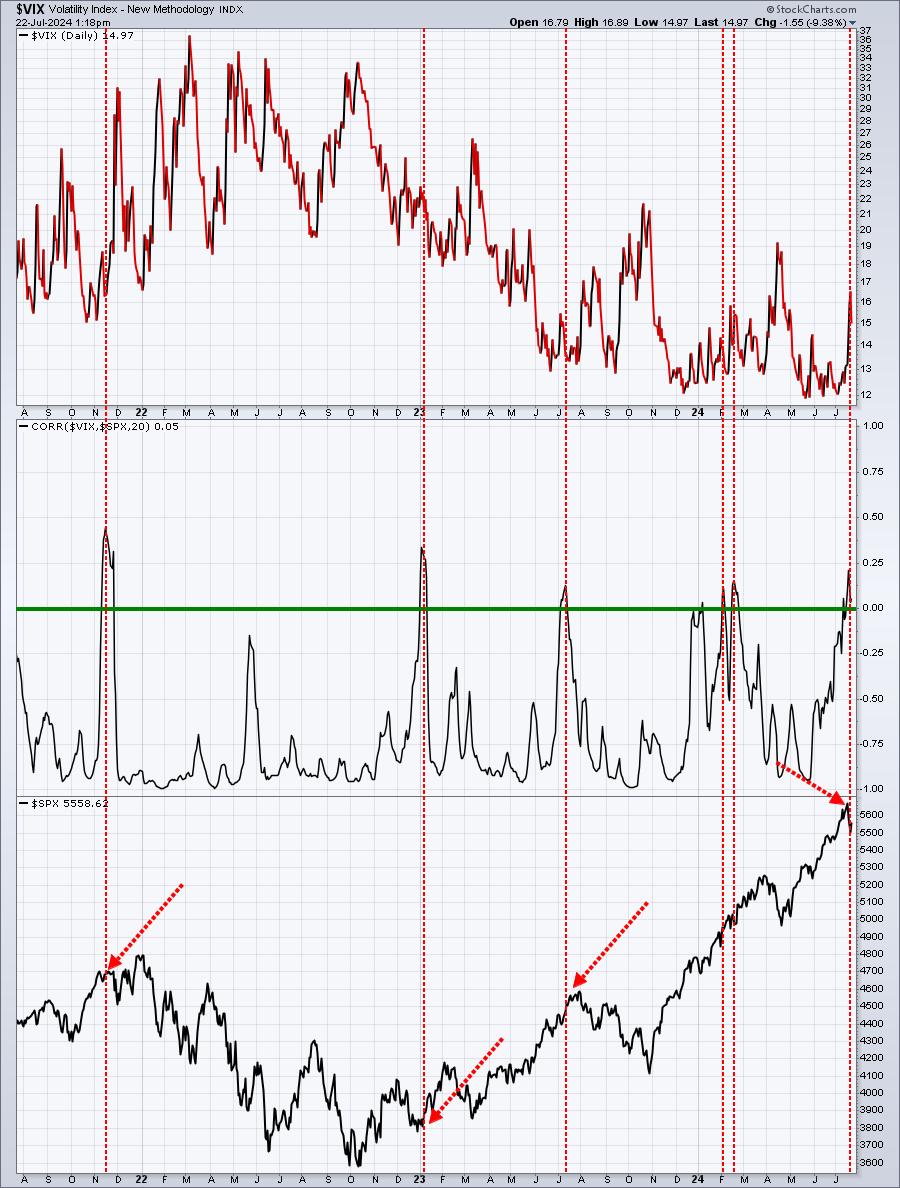
Any trip on correlation above zero is a warning signal of a potential market reversal ahead. It's unusual for the VIX and the SPX to trend in similar directions. Look at the chart above (middle panel) and you'll see that correlation is in the -0.75 to -1.00 range most of the time. A crossover into positive correlation territory is a signal that should not be ignored. Does it work every time? NO, nothing does. It's simply one other sentiment indicator that I like to watch for short-term directional changes/clues in the SPX.
The recent signals triggered almost squarely at the recent price high on the S&P 500. Whether we see weakness end or escalate remains to be seen, but I'd say this latest VIX-SPX correlation provided yet another very useful signal.
International ETFs
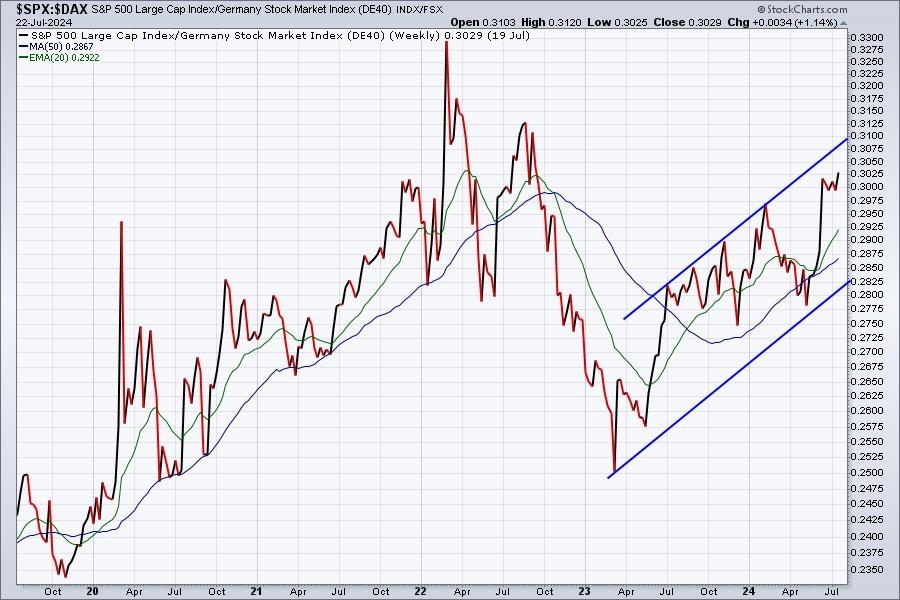
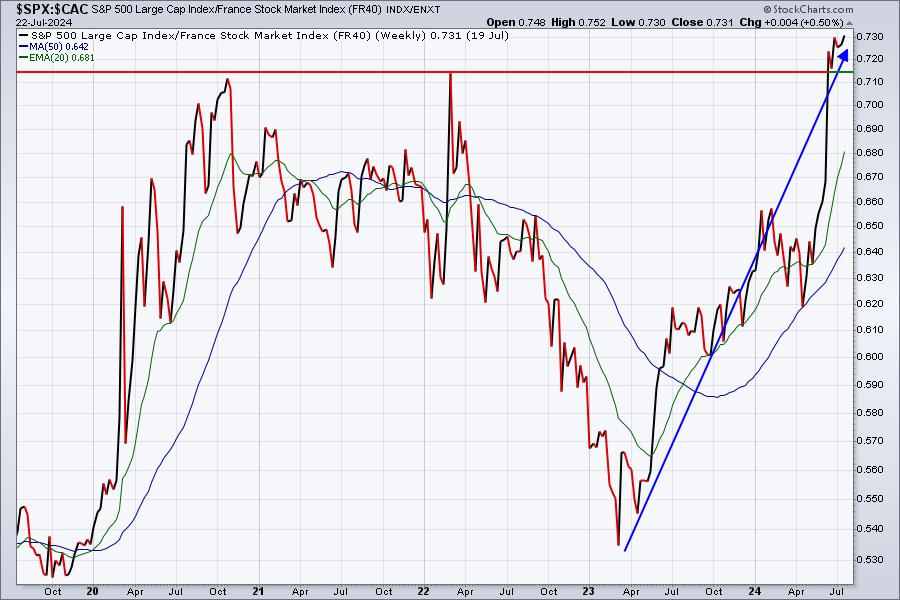
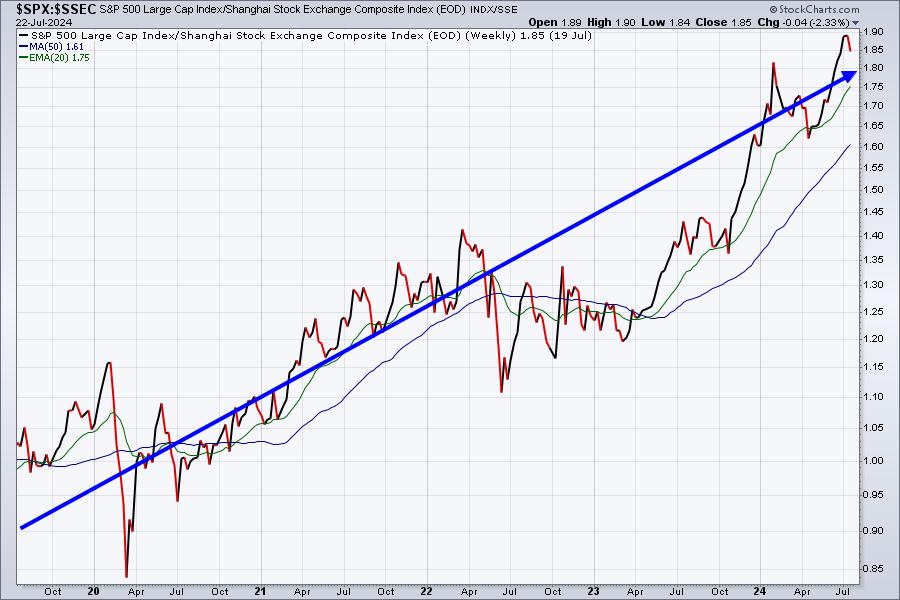
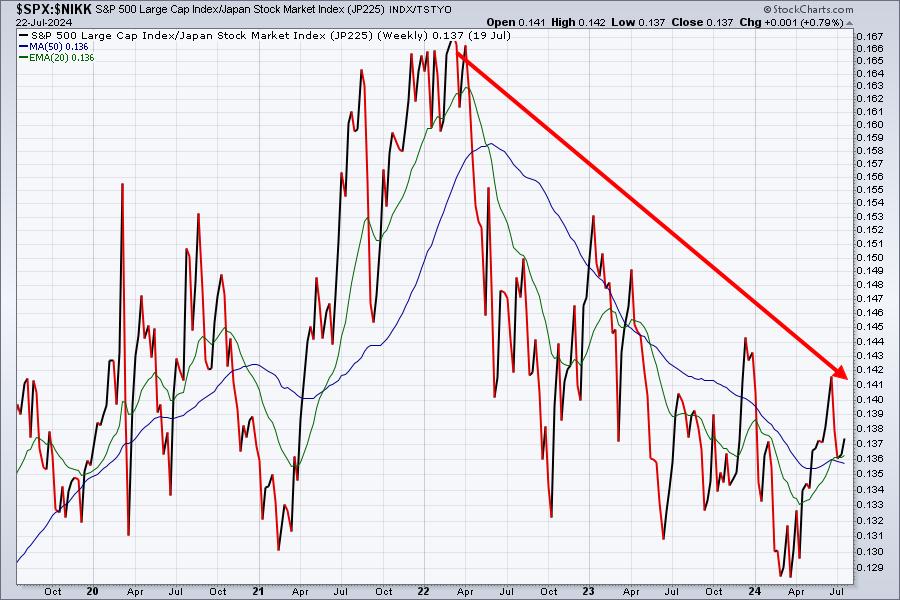
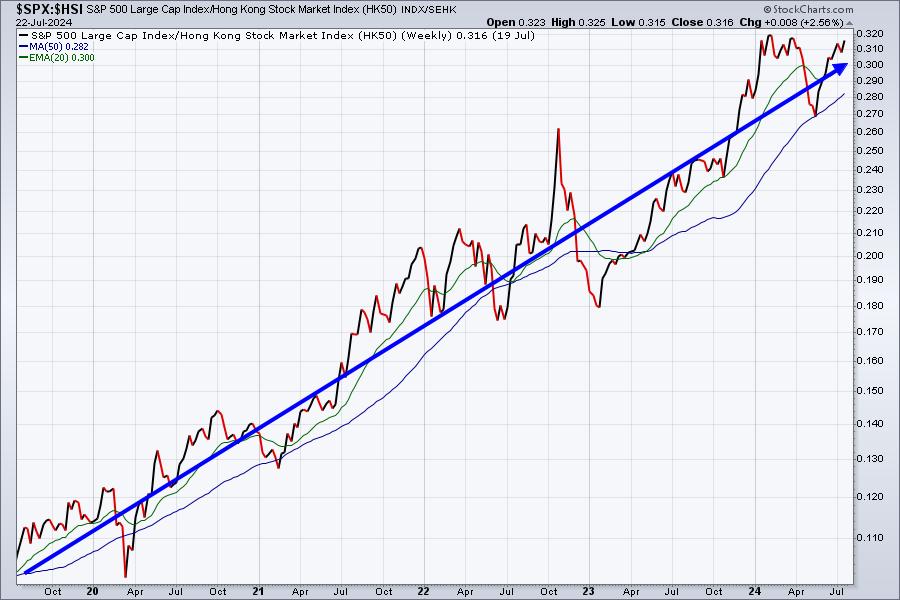
I rarely look at international ETFs, because I don't trade or invest in them. I don't consider myself to be an expert in stock market analysis outside of the U.S. The one thing I do look at, however, is the relative performance of the S&P 500 vs. other key market indices from around the world in order to gain a clearer knowledge of the bigger picture. In other words, is global money favoring the U.S.? If so, it adds to my bullishness of investing in the S&P 500. Below is a relative comparison of U.S. stocks ($SPX), relative to Germany ($DAX), France ($CAC), China ($SSEC), Japan ($NIKK), Hong Kong ($HSI), and emerging markets (EEM):
U.S. vs. Germany:
U.S. vs. France:
U.S. vs. China:
U.S. vs. Japan:
U.S. vs. Hong Kong
U.S. vs. Emerging Markets
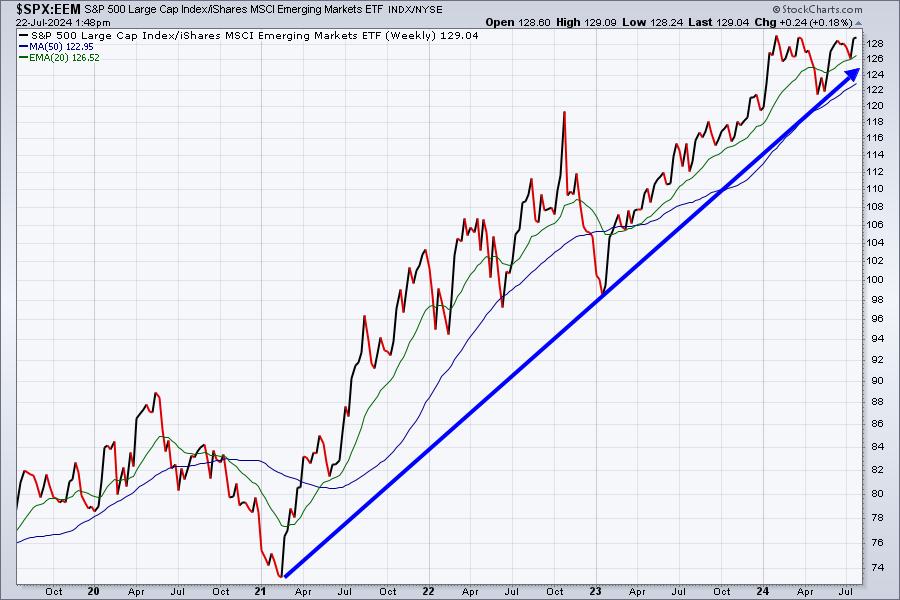
In summary, the Japan market ($NIKK) has performed exceptionally well vs. the U.S., but most markets around the world continue to trail the S&P 500 by a considerable margin. After a quick glance, I'd personally be comfortable sticking with U.S. stocks until the above ratios begin to change in a meaningful way.
Long-Term Trade Setup
Since beginning this Weekly Market Report in early September, I've discussed the long-term trade candidates below that I really like. Generally, these stocks have excellent long-term track records and many pay nice dividends that mostly grow every year. Only in very specific cases (exceptions) would I consider a long-term entry into a stock that has a poor or limited long-term track record:
- JPM
- BA
- FFIV
- MA
- GS
- FDX
- AAPL
- CHRW
- JBHT
- STX
- HSY
- DIS
- MSCI
- SBUX
- KRE
- ED
- AJG
- NSC
Keep in mind that our Weekly Market Reports favor those more interested in the long-term market picture. Therefore, the list of stocks above are stocks that we believe are safer (but nothing is ever 100% safe) to own with the long-term in mind. Nearly everything else we do at EarningsBeats.com favors short-term momentum trading, so I wanted to provide an explanation of what we're doing with this list.
No stocks are being added to our Long-Term Trade list this week.
Looking Ahead
Upcoming Earnings:
There is little happening this week in terms of earnings. This is NOT a list of ALL companies reporting this week, so please be sure to check for earnings of any companies that you own or add. Any companies in BOLD represent stocks in one of our Portfolios:
- Monday: VZ ($177 billion), CDNS ($76 billion), NXPI ($71 billion)
- Tuesday: GOOGL ($2.20 trillion), TSLA ($795 billion), V ($492 billion), TXN ($187 billion)
- Wednesday: TMO ($206 billion), IBM ($170 billion), NOW ($151 billion), KLAC ($106 billion)
- Thursday: ABBV ($302 billion), UNP ($148 billion), RTX (138 billion)
- Friday: BMY ($86 billion), CL ($81 billion), MMM ($58 billion)
Key Economic Reports:
- Monday: None
- Tuesday: June existing home sales
- Wednesday: July PMI composite, June new home sales
- Thursday: Initial jobless claims, Q2 GDP (initial estimate), June durable goods, June wholesale inventories
- Friday: June personal income & spending, July consumer sentiment
Historical Data
I'm a true stock market historian. I am absolutely PASSIONATE about studying stock market history to provide us more clues about likely stock market direction and potential sectors/industries/stocks to trade. While I don't use history as a primary indicator, I'm always very aware of it as a secondary indicator. I love it when history lines up with my technical signals, providing me much more confidence to make particular trades.
Below you'll find the next two weeks of historical data and tendencies across the 3 key indices that I follow most closely:
S&P 500 (since 1950)
- Jul 22: -15.08%
- Jul 23: -29.39%
- Jul 24: +6.94%
- Jul 25: +20.36%
- Jul 26: +25.71%
- Jul 27: +9.03%
- Jul 28: -21.72%
- Jul 29: +37.96%
- Jul 30: +64.95%
- Jul 31: +14.65%
- Aug 1: -11.35%
- Aug 2: +19.18%
- Aug 3: +21.48%
- Aug 4: -63.32%
NASDAQ (since 1971)
- Jul 22: -10.84%
- Jul 23: -94.90%
- Jul 24: -26.31%
- Jul 25: +38.83%
- Jul 26: +12.75%
- Jul 27: -16.15%
- Jul 28: -53.85%
- Jul 29: +20.62%
- Jul 30: +39.72%
- Jul 31: -4.88%
- Aug 1: -38.20%
- Aug 2: +12.76%
- Aug 3: +32.33%
- Aug 4: -86.61%
Russell 2000 (since 1987)
- Jul 22: +28.68%
- Jul 23: -87.84%
- Jul 24: -77.56%
- Jul 25: +37.68%
- Jul 26: +42.58%
- Jul 27: -61.56%
- Jul 28: +10.48%
- Jul 29: +115.62%
- Jul 30: +60.76%
- Jul 31: -30.28%
- Aug 1: -54.66%
- Aug 2: -58.51%
- Aug 3: -31.43%
- Aug 4: -108.90%
The S&P 500 data dates back to 1950, while the NASDAQ and Russell 2000 information date back to 1971 and 1987, respectively.
Final Thoughts
Earnings are continuing to accelerate this week and we have the next Fed meeting a little more than a week from now. Those are two topics that will dominate the headlines.
Here are a few things to consider in the week ahead:
- Earnings. I'm looking for companies that report better-than-expected earnings, but then potentially struggle near-term. Many of those will bounce back, presenting great trading opportunities. The really big reports this week are obvious: Alphabet (GOOGL) and Tesla (TSLA), which both report Tuesday after the closing bell.
- Economic Reports. Every economic report will remain in focus. I've seen some deterioration in key reports over the past month or two and the Fed will be addressing that, along with their own outlook for the balance of the year and into 2025.
- Interest Rates. The 10-year treasury yield ($TNX) has been up three days in a row, but I do not expect that to last. As inflation expectations are lowered, so too will be the yield on the 10-year treasury.
- Recession? This will be a Wild Card for the next few months. I believe if the Fed fails to lower rates next week, that more and more analysts will talk about the increasing odds of a recession. This could be a developing theme throughout the balance of Q3 and will be worth watching.
- History. I discussed earlier how the stock market historically performs during the 4 calendar quarters. Q3 is here and we need to lower our expectations. I've also pointed out on many occasions that the absolute worst period, historically, for the stock market is from the July 17th close through the September 26th close. I would not be surprised if we're much lower late in September, compared to where we are right now. Food for thought.
- Growth vs. Value. I point out every May that growth stocks do their best relative work vs. value stocks from May through August. We've seen tremendous outperformance in growth since then, but that relative strength faded considerably over the past two weeks. I believe we could see one more "pop" in terms of growth stocks' outperformance, but as we get closer and closer to September, I believe value stocks will be the much better performers.
Feedback
If you'd like to share your thoughts on our Weekly Market Report, positive or negative, you can reach us at "[email protected]".
Happy trading!
Tom