
EB Weekly Market Report - Monday, July 29, 2024
ChartLists Updated
I updated the following ChartLists over the weekend and they should all be available for your viewing/downloading pleasure on our website:
- Strong Earnings (SECL)
- Strong Future Earnings (SFECL)
- Raised Guidance (RGCL)
- Bullish Trifecta (BTCL)
- All Upcoming Earnings
- Upcoming Earnings - Relative Strength
In addition, we are making available our ChartList from Saturday's event and our Small Cap ChartList that comprises the Top 20 Holdings of the 9 Invesco Small Cap Sector ETFs. That's 180 charts in all. If small caps continue to lead the market higher over the next 2-3 months, or possibly longer, this will be a very handy ChartList to keep around.
I picked the Invesco Small Cap Sector ETFs, because all 9 of them have been handily outperforming their IShares large cap sector ETF counterparts since July 11th, the day that rotation into small caps began.
Weekly Market Recap
Major Indices
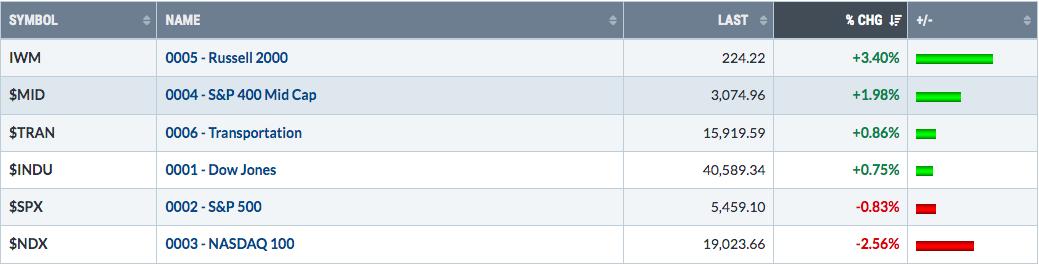
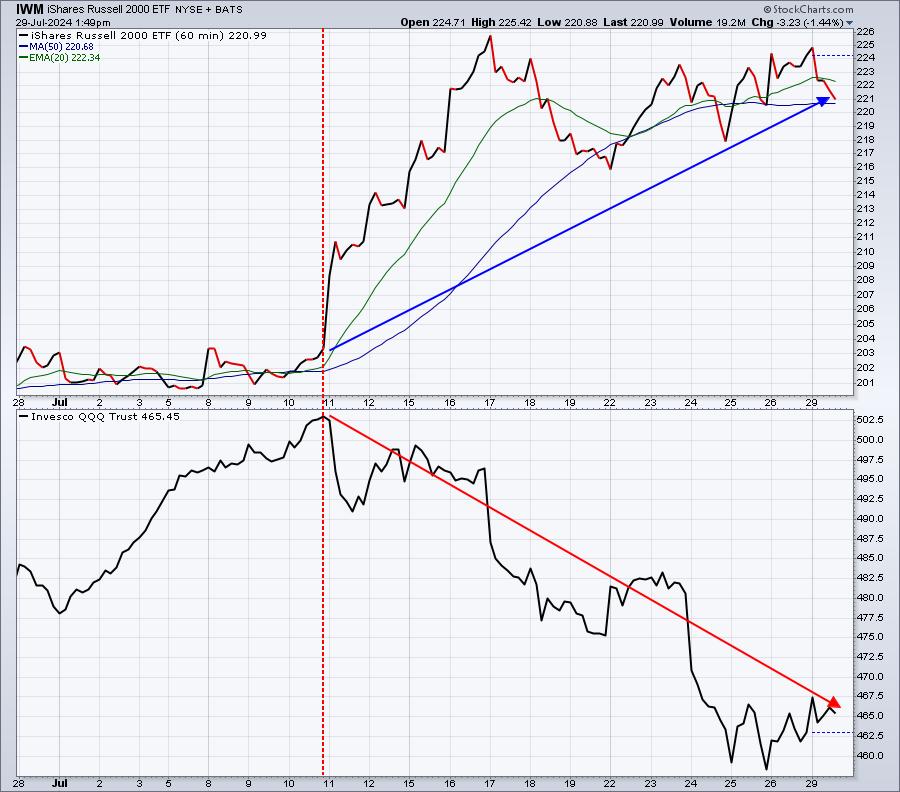
This is what I want to focus on right now. Small caps (IWM), though they're lagging thus far today, have been crushing their large cap counterparts and one hourly chart of the IWM and the QQQ (NASDAQ 100 ETF) is really the only thing you need to look at to understand the massive rotation that's taken place since the July 11th June CPI report was released:
If I use a 12-day rate of change (ROC) on an IWM:QQQ relative chart, we can see how often the small caps have outperformed like they have over the past couple weeks. Check this out:
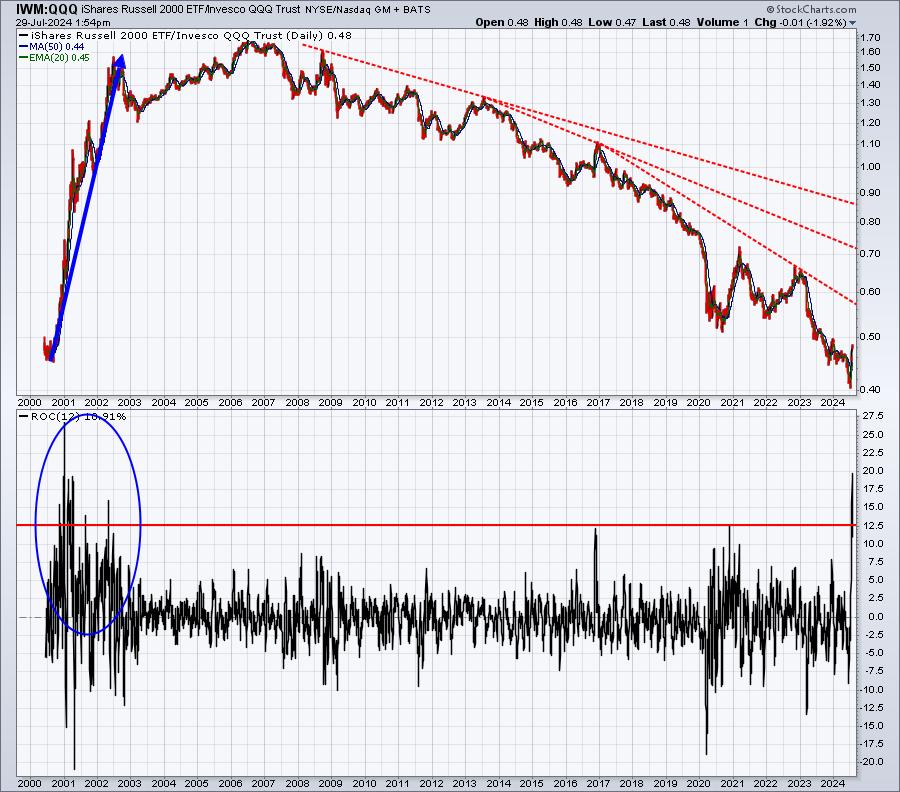
We haven't seen anything like this since the dot com bubble. At that time, rates began to fall precipitously and small caps EXPLODED higher on a relative basis. I don't know if we're going to see that or not, but you can see that small caps have been very weak on a relative basis to the QQQ for a very long time. A relative shift, even if just for a couple months to maybe a year, it would be easy to see the IWM:QQQ relative ratio surge to hit one of the three downtrend lines that I've highlighted.
Sectors
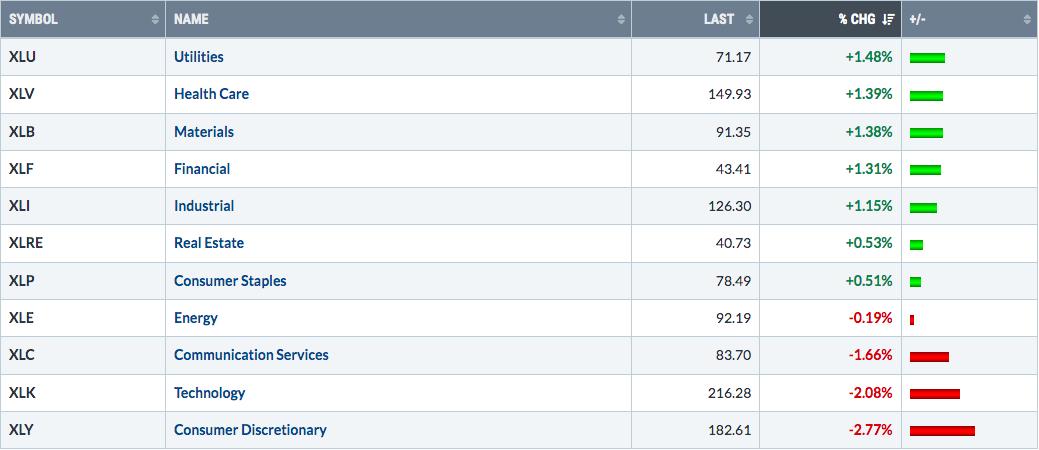
This is a clear visual of how money rotated from aggressive growth stocks to defensive value stocks. Personally, I believe this is the start of a rough few months ahead, though we'll see periods of strength.
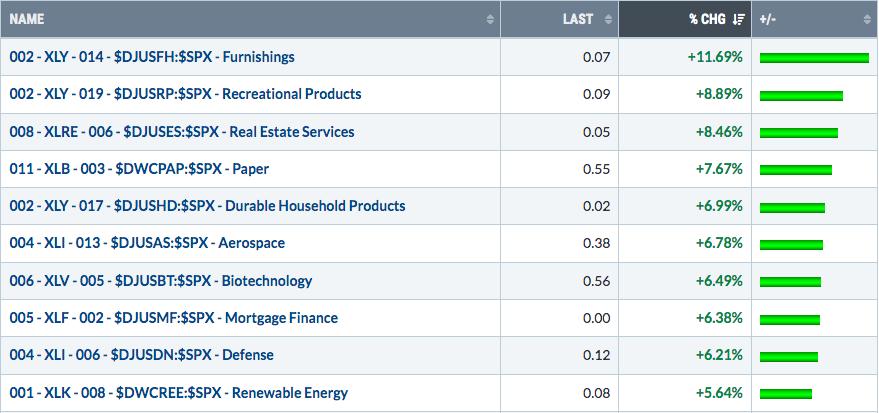
Top 10 Industries Last Week
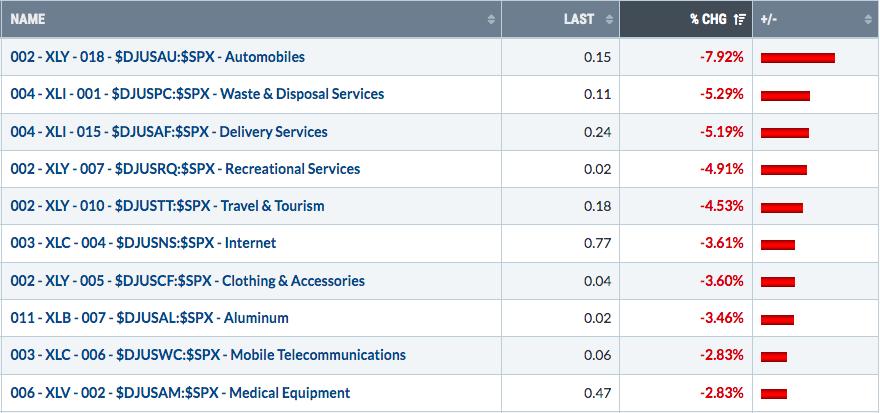
Bottom 10 Industries Last Week
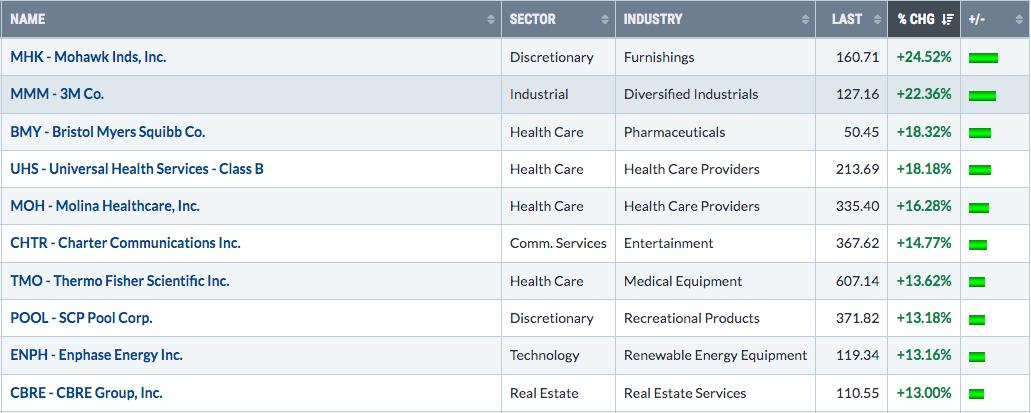
Top 10 Stocks - S&P 500/NASDAQ 100
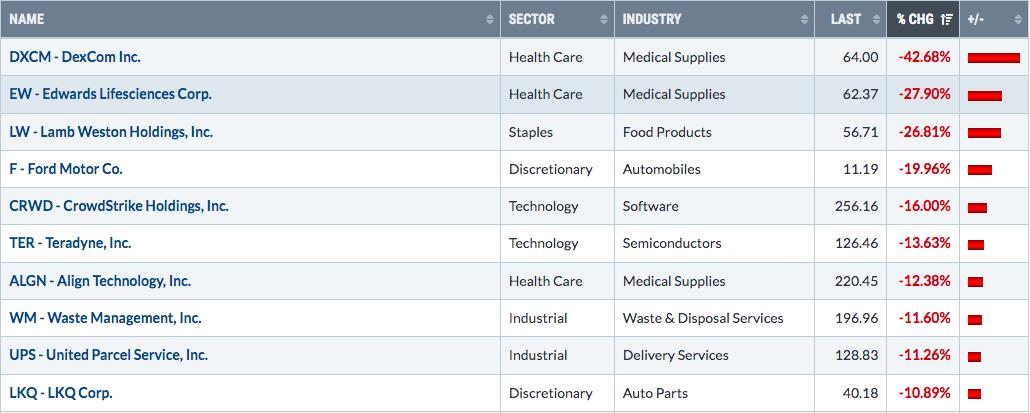
Bottom 10 Stocks - S&P 500/NASDAQ 100
Big Picture
Here's an update of the Big Picture, 100-year chart of the S&P 500:
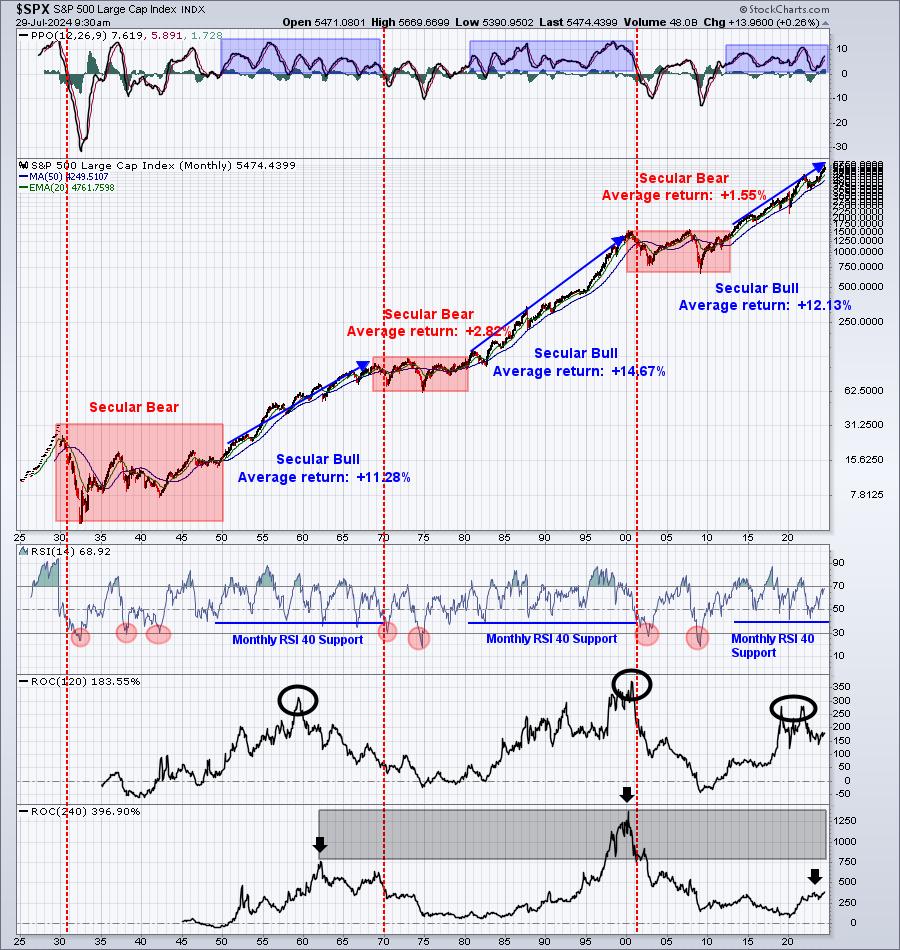
All the selling recently, especially in growth shares, is really muted on this chart, which is why I love to look at it each month. It keeps me grounded and not reaching for false conclusions. Unless, and until, the monthly PPO turns negative and the monthly RSI breaks 40 support, the secular bull market remains intact from a simple price perspective. That doesn't mean we won't see corrections and even cyclical bear markets along the way, but leaving the market altogether during the first signs of weakness is usually a HORRIBLE idea, if you're a long-term investor.
Look at this chart every week and quiet the noise out there.
Rotation/Intermarket Analysis
Here's the latest look at our key intraday ratios as we follow where the money is traveling on an INTRADAY basis (ignoring gaps):
QQQ:SPY
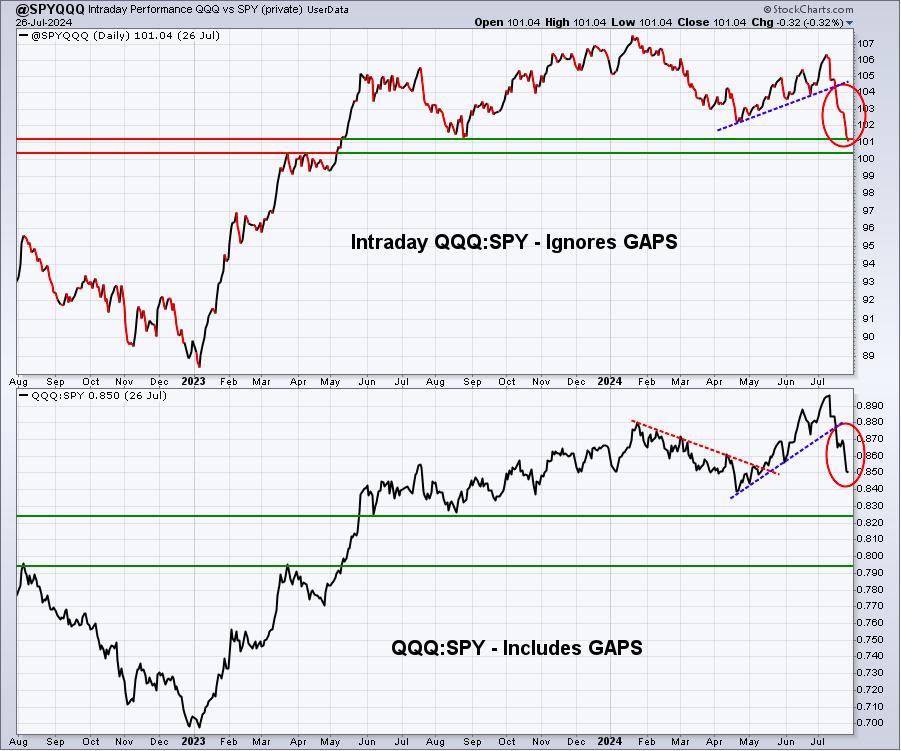
Keep in mind that the NAME of the chart is SPY:QQQ, but the actual numbers and chart represent the QQQ vs. the SPY (QQQ:SPY). After I named this User-Defined Index, I was unable to change it. That confuses a lot of folks when they review this chart. Rest assured, the actual ratio tracks how the QQQ is performing relative to the SPY.
This is another indictment of growth stocks, in my opinion. A break down below relative support levels shown could be a signal of more selling ahead.
IWM:QQQ
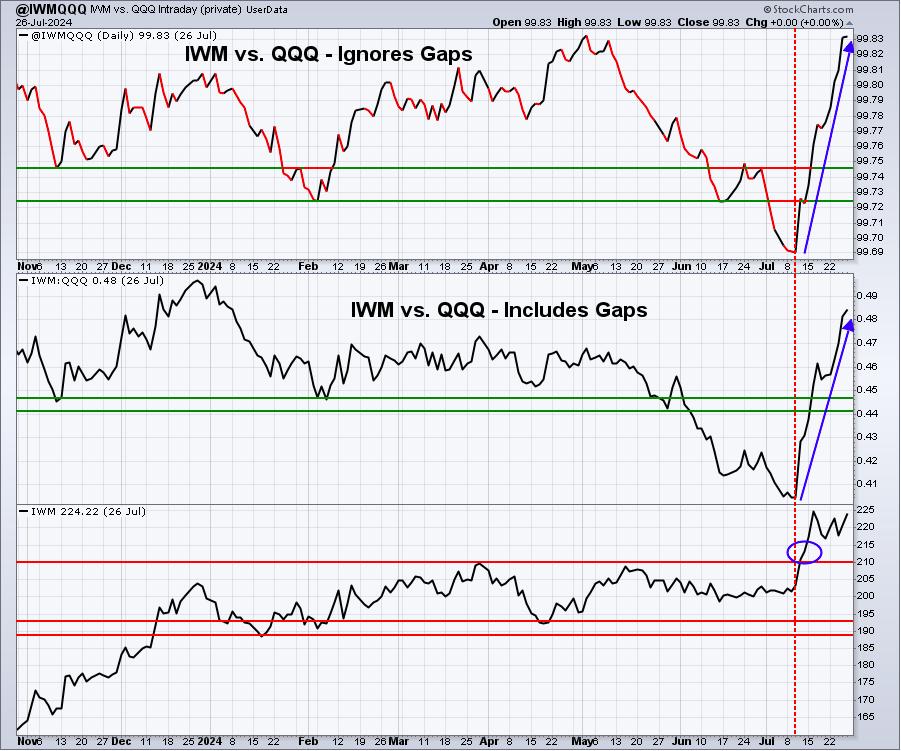
The red-dotted vertical line marks the date of the June CPI report. You an see clearly that Wall Street decided to gravitate HEAVILY towards small caps at the time of that announcement, because it marked a FINAL call for the Fed to begin lowering rates and small caps have historically embraced rate-cutting cycles.
XLY:XLP
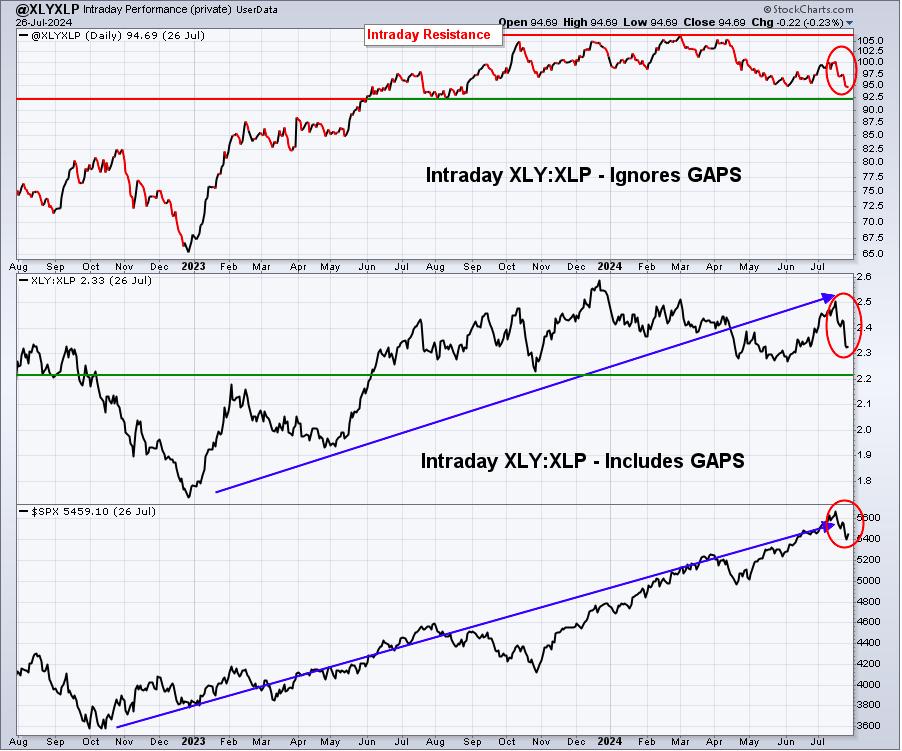
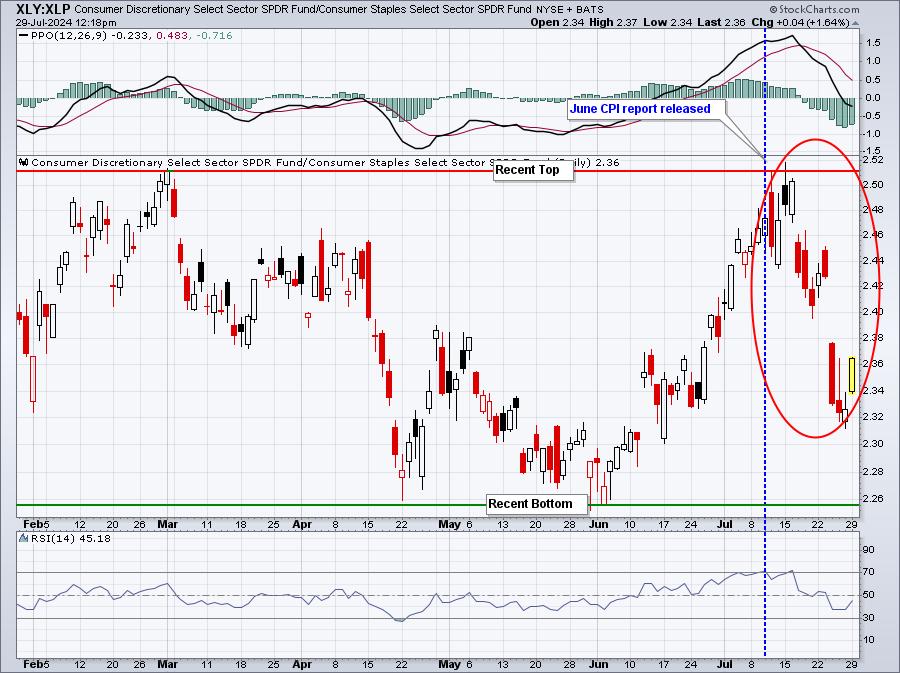
I'm still fine with this relative ratio, even though we've turned back down of late. The overall trend in the S&P 500, from a long-term perspective, is clearly higher to me. The only signal that would bother me on the XLY:XLP ratio would be a major relative support loss, which I would say is roughly the 92 level. Breaking that support doesn't mean we're heading for disaster ahead, but it would definitely be a more significant warning shot that the short-term warning signals discussed below in sentiment.
Growth vs. Value
This ratio has taken a BIG hit the past few weeks as Wall Street scrambles to exit the more aggressive growth stocks. I'm sure you've heard plenty about it. I've been discussing it, plus just about every YouTube video I see is talking about it. You have to live under a rock to not know what's been happening to the Mag 7 stocks. Interestingly, a handful of them will be reporting earnings this week, which clearly could change their short-term direction. I'd be VERY suspicious, though, if we see solid results (like with GOOGL last week) and a subsequent gap lower and/or decline. I have two favorite growth vs. value ratios that I like to follow:
XLY vs. XLP
IWF vs. IWD
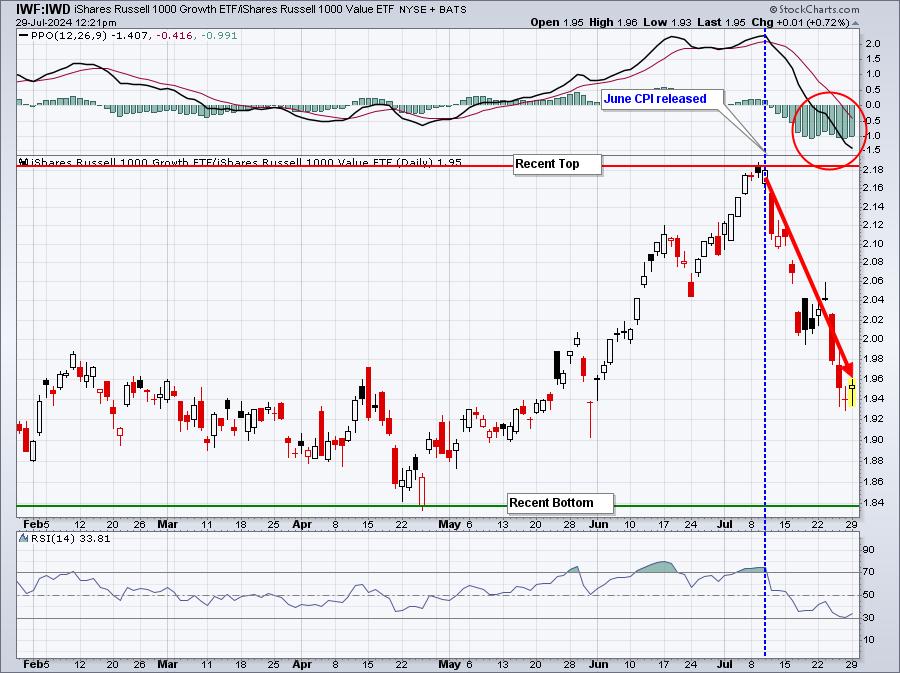
I said that we're getting a MAJOR market message that the Fed MUST begin cutting rates NOW and these 2 charts could be poster children of what I meant. When growth stocks suddenly turn about-face, it's usually a shot fired from the bears, warning it's now about the economy. The Fed needs to take this type of market behavior seriously and cut rates now. They start their 2-day meeting tomorrow morning and I believe they'll come out of it saying a cut in September is now likely, but they'll continue to monitor the data. Blah, blah, blah.
Personally, I don't know if it's enough. In fact, I believe the cuts should have already been underway. We'll find out over the next few months if the bond and stock markets believes they waited too long.
Sentiment
5-day SMA ($CPCE)
How quickly retail traders switch to the side of the enemy. It was just a couple weeks ago that equity calls were being bought "hand over fist" vs. puts. But there's nothing like a quick downtrend to completely change traders' mindsets. We're certainly not at a panicked level in terms of equity puts being bought, but we have quickly reversed that bullish narrative. Check out this updated reading:
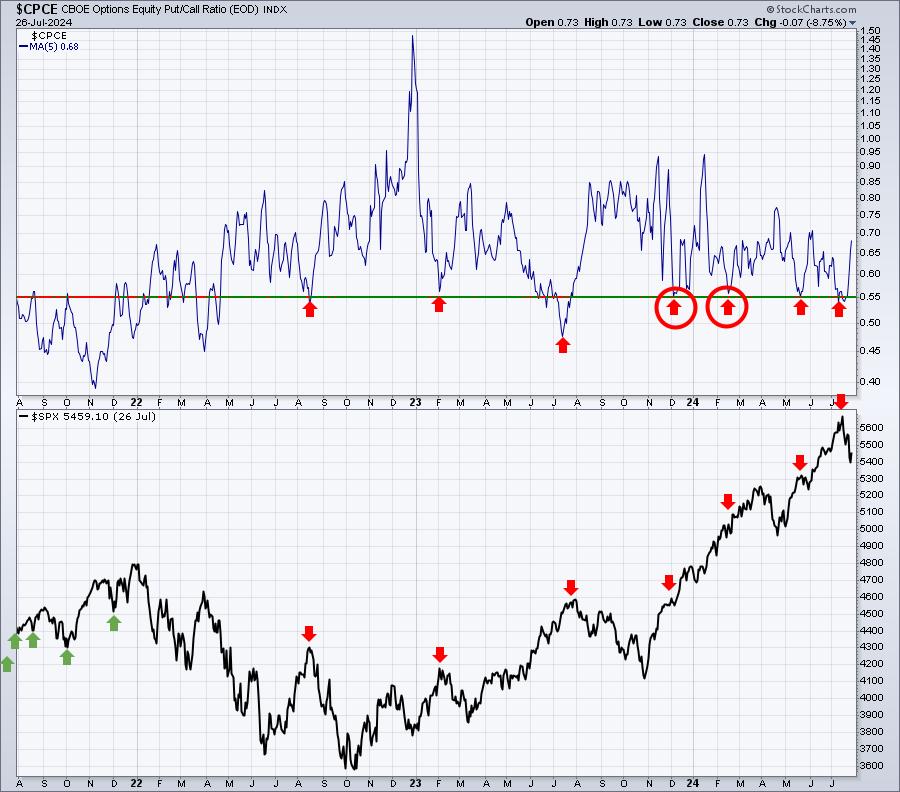
A 5-day reading that hits or surpasses the 0.75 level is generally a level where I begin to look for short-term market bottoms. So this CPCE reading is not really telling us anything just yet, other than the stock market is safer than it was two weeks ago.
Volatility Index ($VIX)
The positive correlation that I discussed the past couple weeks is no longer a problem. Correlation is now negative to the tune of -0.67. However, I do believe we'll see the VIX shoot higher over the next 2-3 months, potentially reaching a high of 20-23 when an ultimate bottom is found. Please understand that I remain 100% confident that we are in a SECULAR BULL MARKET. I'm simply concerned about the next couple months where we know we'll have political uncertainties, and potentially interest rate uncertainties, and any uncertainties can derail the stock market. Historically, we're in Q3 when many uncertainties typically arise, especially in a President Election year.
Keep your guard up.
Long-Term Trade Setup
Since beginning this Weekly Market Report in early September, I've discussed the long-term trade candidates below that I really like. Generally, these stocks have excellent long-term track records and many pay nice dividends that mostly grow every year. Only in very specific cases (exceptions) would I consider a long-term entry into a stock that has a poor or limited long-term track record:
- JPM
- BA
- FFIV
- MA
- GS
- FDX
- AAPL
- CHRW
- JBHT
- STX
- HSY
- DIS
- MSCI
- SBUX
- KRE
- ED
- AJG
- NSC
Keep in mind that our Weekly Market Reports favor those more interested in the long-term market picture. Therefore, the list of stocks above are stocks that we believe are safer (but nothing is ever 100% safe) to own with the long-term in mind. Nearly everything else we do at EarningsBeats.com favors short-term momentum trading, so I wanted to provide an explanation of what we're doing with this list.
No stocks are being added to our Long-Term Trade list this week.
Looking Ahead
Upcoming Earnings:
There is little happening this week in terms of earnings. This is NOT a list of ALL companies reporting this week, so please be sure to check for earnings of any companies that you own or add. Any companies in BOLD represent stocks in one of our Portfolios:
- Monday: MCD ($181 billion), ON ($29 billion)
- Tuesday: MSFT ($3.11 trillion), PG ($394 billion), AMD ($224 billion)
- Wednesday: META ($1.15 trillion), MA ($399 billion), QCOM ($196 billion), LRCX ($116 billion)
- Thursday: AAPL ($3.34 trillion), AMZN ($1.87 trillion), INTC (132 billion)
- Friday: XOM ($463 billion), CVX ($290 billion)
Key Economic Reports:
- Monday: None
- Tuesday: FOMC Meeting begins, May Case-Shiller home price index, May FHFA house price index, July consumer confidence, June JOLTS
- Wednesday: July ADP employment report, July Chicago PMI, June pending home sales, FOMC Announcement
- Thursday: Initial jobless claims, Q2 productivity & costs, July PMI manufacturing, July ISM manufacturing, June construction spending
- Friday: July nonfarm payrolls June factory orders
Historical Data
I'm a true stock market historian. I am absolutely PASSIONATE about studying stock market history to provide us more clues about likely stock market direction and potential sectors/industries/stocks to trade. While I don't use history as a primary indicator, I'm always very aware of it as a secondary indicator. I love it when history lines up with my technical signals, providing me much more confidence to make particular trades.
Below you'll find the next two weeks of historical data and tendencies across the 3 key indices that I follow most closely:
S&P 500 (since 1950)
- Jul 29: +37.96%
- Jul 30: +64.95%
- Jul 31: +14.65%
- Aug 1: -11.35%
- Aug 2: +19.18%
- Aug 3: +21.48%
- Aug 4: -63.32%
- Aug 5: -31.84%
- Aug 6: +3.52%
- Aug 7: +63.70%
- Aug 8: -18.26%
- Aug 9: -12.91%
- Aug 10: -34.27%
- Aug 11: +43.86%
NASDAQ (since 1971)
- Jul 29: +20.62%
- Jul 30: +39.72%
- Jul 31: -4.88%
- Aug 1: -38.20%
- Aug 2: +12.76%
- Aug 3: +32.33%
- Aug 4: -86.61%
- Aug 5: -65.57%
- Aug 6: +27.92%
- Aug 7: +76.83%
- Aug 8: -39.45%
- Aug 9: -0.67%
- Aug 10: -55.12%
- Aug 11: +29.15%
Russell 2000 (since 1987)
- Jul 29: +115.62%
- Jul 30: +60.76%
- Jul 31: -30.28%
- Aug 1: -54.66%
- Aug 2: -58.51%
- Aug 3: -31.43%
- Aug 4: -108.90%
- Aug 5: -68.50%
- Aug 6: -11.54%
- Aug 7: +79.11%
- Aug 8: -16.81%
- Aug 9: +14.42%
- Aug 10: -58.63%
- Aug 11: +27.28%
The S&P 500 data dates back to 1950, while the NASDAQ and Russell 2000 information date back to 1971 and 1987, respectively.
Final Thoughts
There's been a lot to digest the past few weeks. And it won't get any easier in the near-term as our focus shifts to large cap growth earnings reports, the Federal Reserve, and jobs.
Here are the PRIMARY things to consider in the week ahead:
- The Fed. It's very doubtful that they're cutting rates on Wednesday, even though they absolutely should. Instead, they're going to remain "calculated" in their approach, remaining adamant that they need to believe inflation is completely under control before turning on the spigot for our economy. However, the cracks in our economic foundation have already appeared and waiting too long to cut might have some rather adverse impacts on our economy and stock market.
- Earnings. How could this not be a primary thing to watch this week? AAPL, MSFT, AMZN, and META all report somewhere between Tuesday AMC (after market close) and Thursday AMC. If they report better-than-expected results and struggle to make positive headway, we're in trouble. Or I should say - THEY'RE in trouble.
- Jobs. Friday will mark our latest nonfarm payrolls report. June jobs came in better than expected. Can July surprise to the upside as well? If so, it could provide the stock market with a needed boost. Watch the unemployment rate closely though. I discussed it on Saturday and it's been slowly moving higher. Nearly every recession we've seen has started with deterioration in employment numbers. If the Fed's "goldilocks" scenario is to unfold, initial jobless claims and the unemployment rate both need to come down, minimally.
- Interest Rates. Given the decline in the 10-year treasury yield ($TNX), I'd say the bond market is screaming at the Fed that inflation is NOT the problem any longer and that they need to begin cutting rates to begin stimulating the economy. Remember, it takes several months of cutting rates before we start to see meaningful economic benefit. They (the Fed) simply cannot wait any longer.
- Recession? Talk of one will likely begin gaining steam. That uncertainty, along with the political circus we're about to embark on, is likely to be a big problem for US equities during the balance of Q3.
- History. We're in the worst calendar quarter of the year and in the midst of the worst 2+ month period of the year as well. Think of August through September, possibly October as a bridge for us. We need to try to maintain our capital as best we can until the bullish Q4 period arrives.
Feedback
If you'd like to share your thoughts on our Weekly Market Report, positive or negative, you can reach us at "[email protected]".
Happy trading!
Tom