
EB Weekly Market Report - Monday, August 5, 2024
Impromptu Event
I've received a lot of questions about the duration and depth of this selling. I can't possibly reach out to everyone that's written in to ask a personal question. I do understand the reason for the questions, however. This type of market is very unnerving. We can't discuss in detail what's going on every day throughout the day, but we do want to host an event to help you better understand what's happening right now....with some perspective to keep in mind....and what we might see as Q3 develops.
We'll send out room instructions, but we're currently anticipating the event will begin shortly after the stock market closes.
ChartLists Updated
I updated the following ChartLists over the weekend and they should all be available for your viewing/downloading pleasure on our website:
- Strong Earnings (SECL)
- Strong Future Earnings (SFECL)
- Raised Guidance (RGCL)
- Bullish Trifecta (BTCL)
- All Upcoming Earnings
- Upcoming Earnings - Relative Strength
August Seasonality Report
I have not issued a Seasonality Report for August, nor have I created a Seasonality ChartList for August. All of the current market developments have put that on hold, plus seasonality really stands little chance against a market that's trading high on emotion. I'll send out this August Seasonality Report later this week, but I'm trying to keep my finger on the pulse of the market for now. I apologize for any inconvenience.
Weekly Market Recap
Major Indices
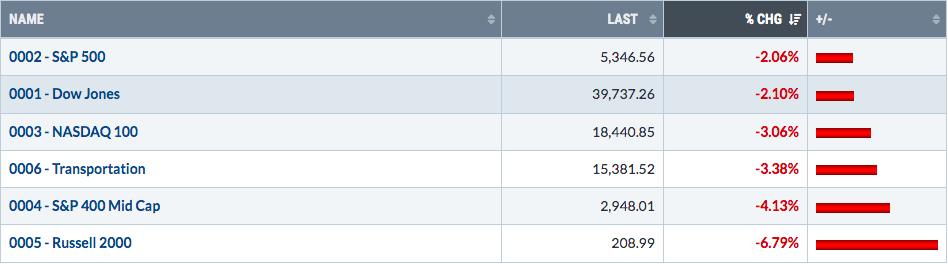
Thanks Fed! There've been a few short-term warning signs over the past few weeks, but nothing that really signaled a big drop was imminent. I believe the biggest problem was that the June CPI report, released on July 11th, gave Wall Street the "all clear" sign that a reduction in the fed funds rate was all but guaranteed. At that point, those big Wall Street firms changed their strategies, banking on this rate reduction, by pouring assets into small caps and more cyclical stocks. That Fed meeting, and the resulting policy statement, was NOT what they expected. They saw a Fed finally (!!!) acknowledge the slowdown in the economy, but then turn their back and do absolutely nothing about it, still focusing instead on inflation. That meeting, along with more bad economic news on Thursday and Friday, began the massive distribution that we saw on Thursday.
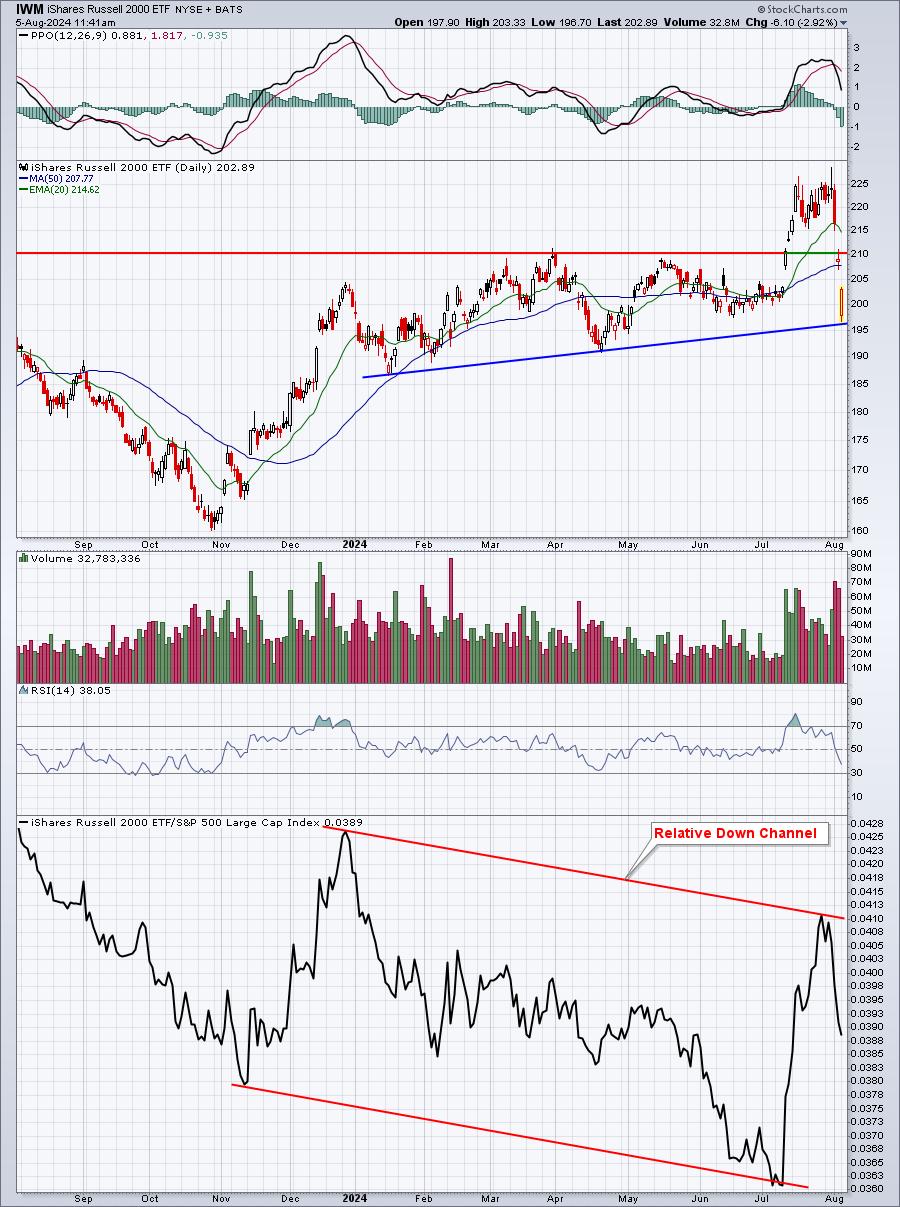
Here's a quick look at the IWM and the $MID, the two hardest hit indices from last week:
IWM:
$MID:
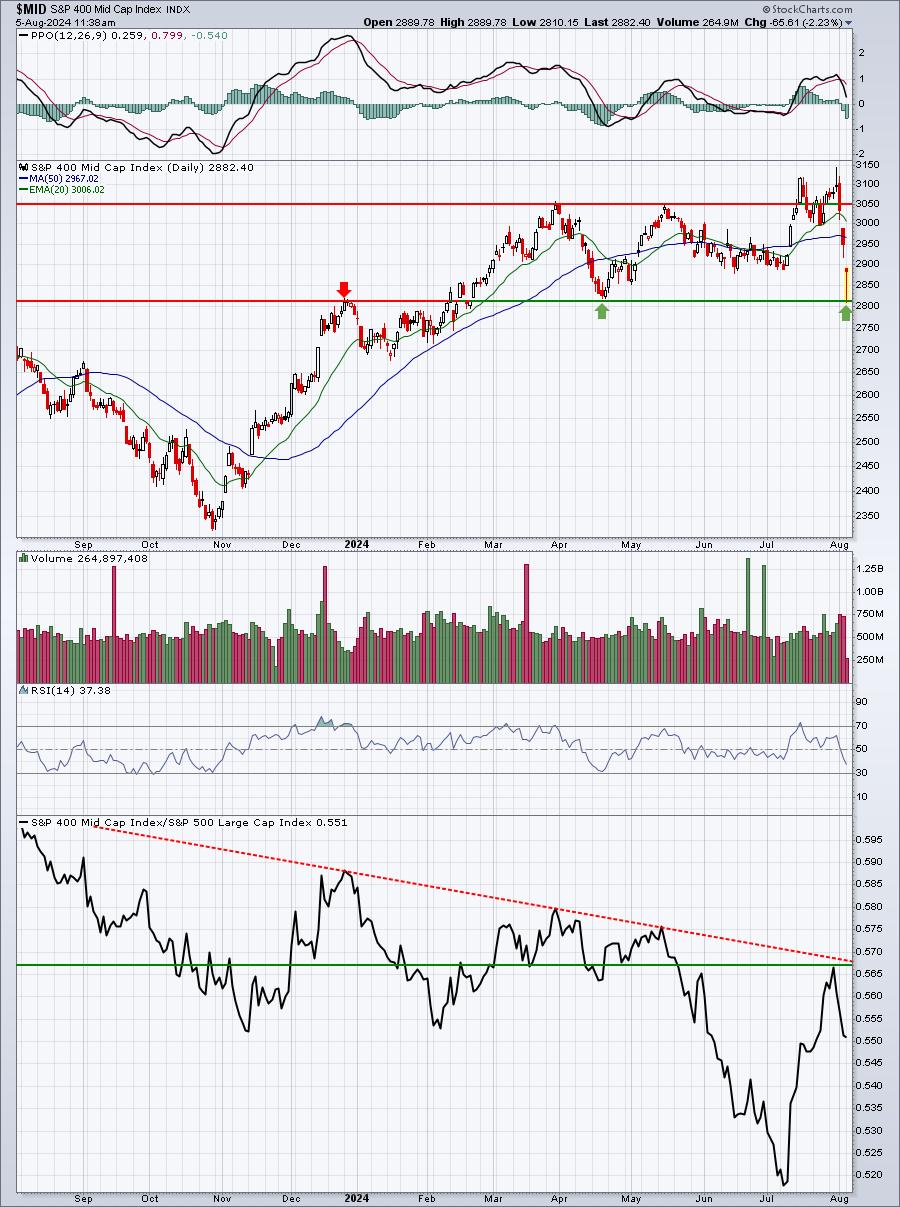
They're obviously both weak, but they're also both bouncing off key technical areas of support. Failure to hold today's low would add another level of bearishness. For now, however, the bulls are trying to regain short-term control. The relative down channels do suggest that today's absolute strength is likely to be temporary.
Sectors
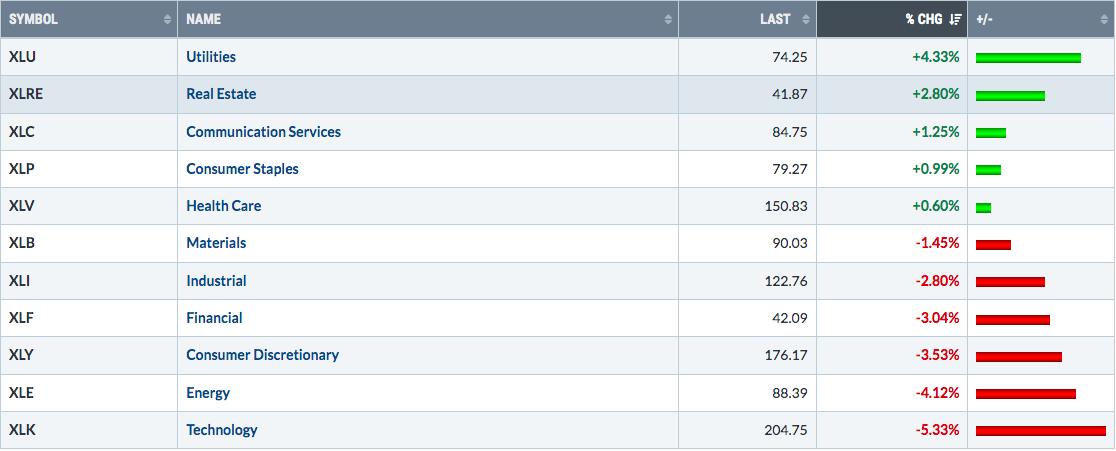
Money rotated to defensive areas of the market, as it typically does when fear rises and a big selloff begins.
Top 10 Industries Last Week
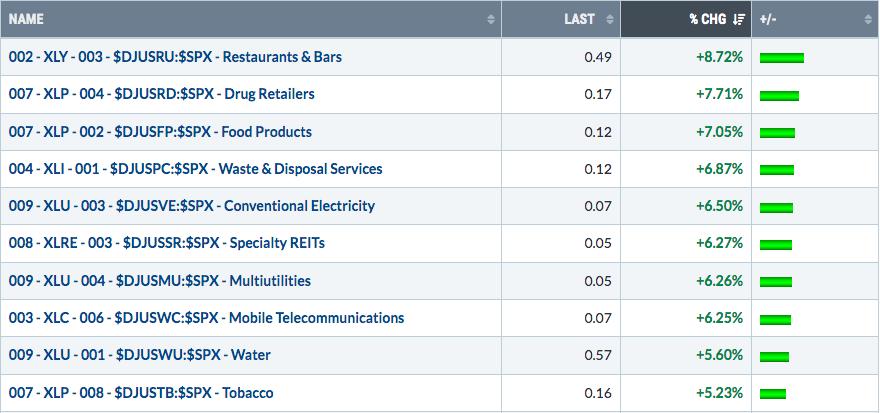
Defensive sectors ruled last week, especially into the end of the week and after the Fed announcement. The best-performing industry groups last week most certainly reflect that.
Bottom 10 Industries Last Week
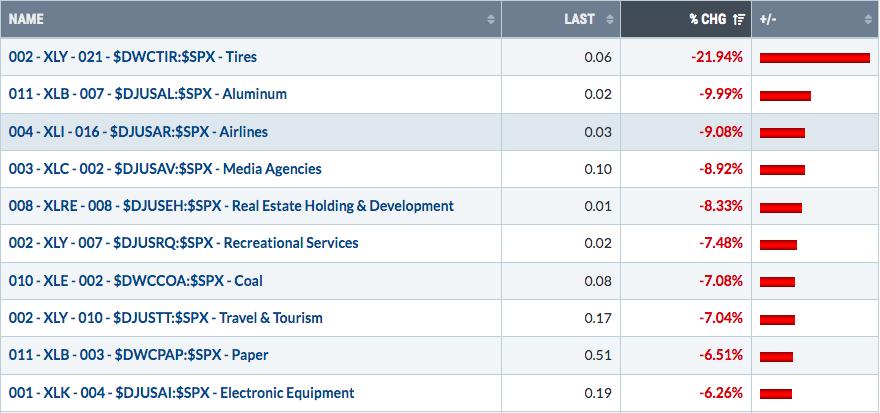
Shockingly, semiconductors ($DJUSSC) are not on this list of weakest-performing industry groups last week, but that was partly due to strength the group saw earlier in the week.
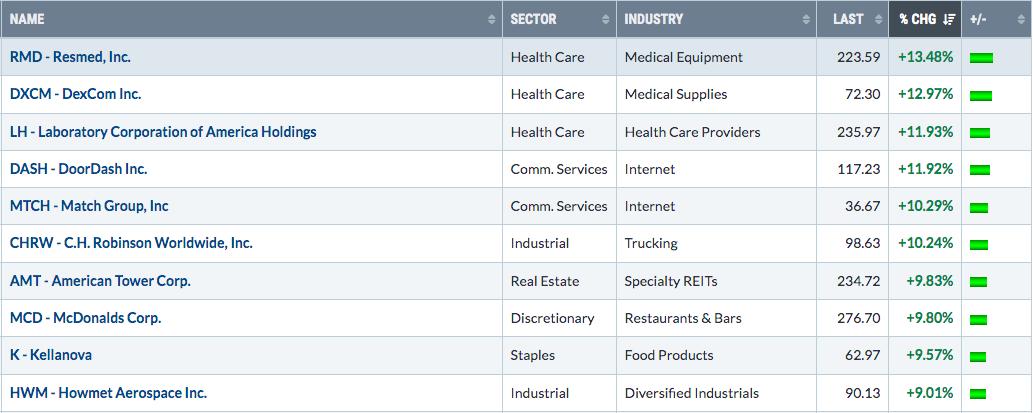
Top 10 Stocks - S&P 500/NASDAQ 100
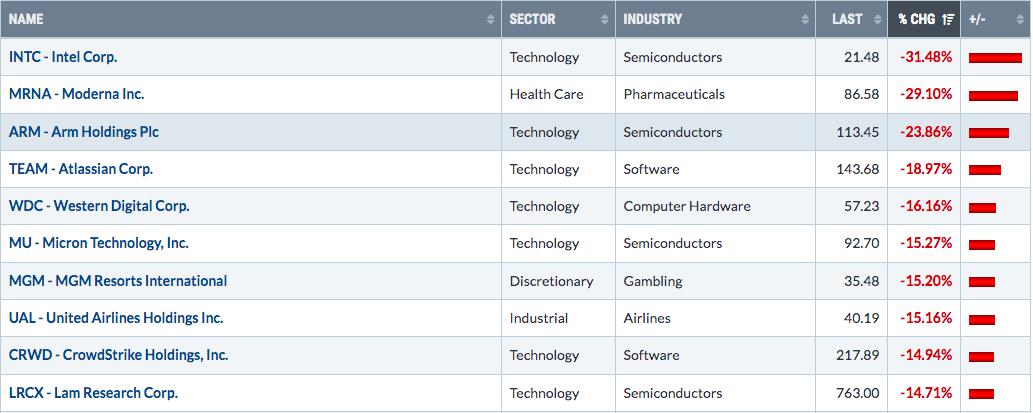
Bottom 10 Stocks - S&P 500/NASDAQ 100
Big Picture
Here's an update of the Big Picture, 100-year chart of the S&P 500:
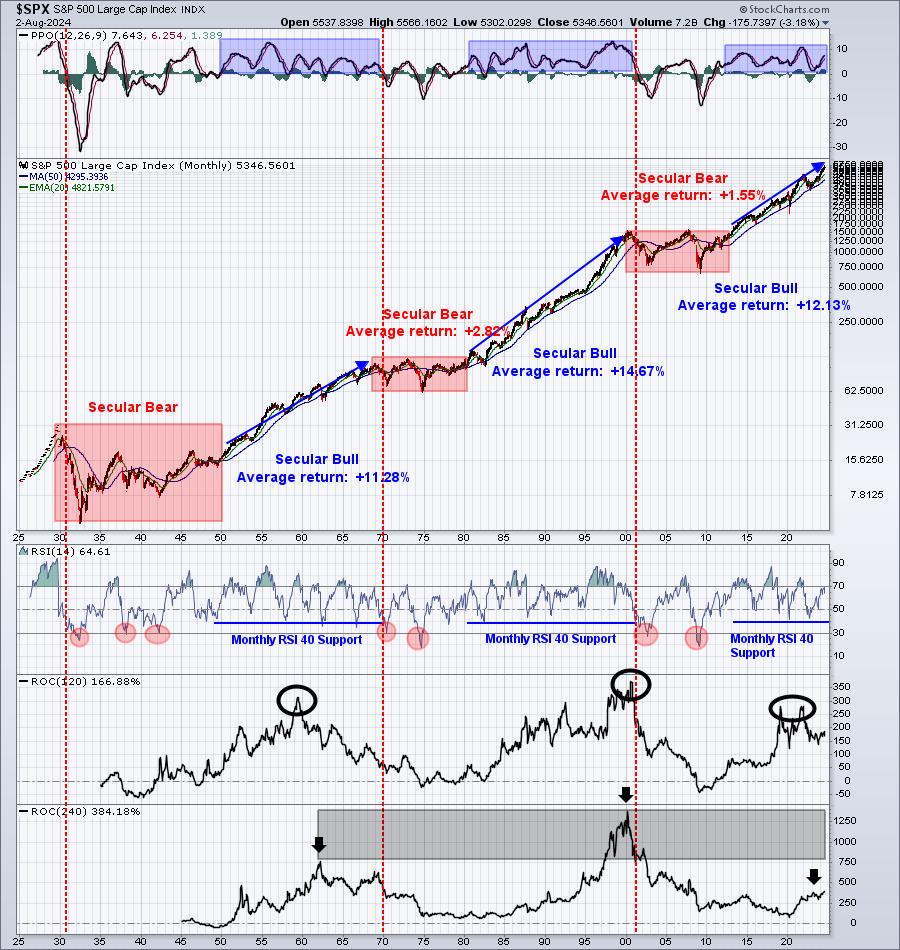
As you all are likely aware, I've grown very nervous in recent weeks, mostly due to economic weakness that's not being addressed by the Fed. Eventually, it will be addressed, so I am NOT long-term bearish. I've had questions arise about my long-term secular bull market commitment. That has NOT changed at all. I remain VERY bullish the long-term and believe we'll rebound quickly from this selling. That's why I've suggested that long-term "buy and hold" folks consider hanging on. I can't make that decision for anyone, I can simply provide you my opinion of what I believe will happen in U.S. equities.
Has the above chart changed in any meaningful way to you? No, it hasn't. In fact, both the 10-year and 20-year rate of change (ROC) are moving higher. Short-term selling is inevitable. It's going to happen. Recognizing trouble ahead is GREAT for a short-term trader, but if that's not who you are, don't start trying to be one every time the stock market has a hiccup.
Rotation/Intermarket Analysis
Here's the latest look at our key intraday ratios as we follow where the money is traveling on an INTRADAY basis (ignoring gaps):
QQQ:SPY
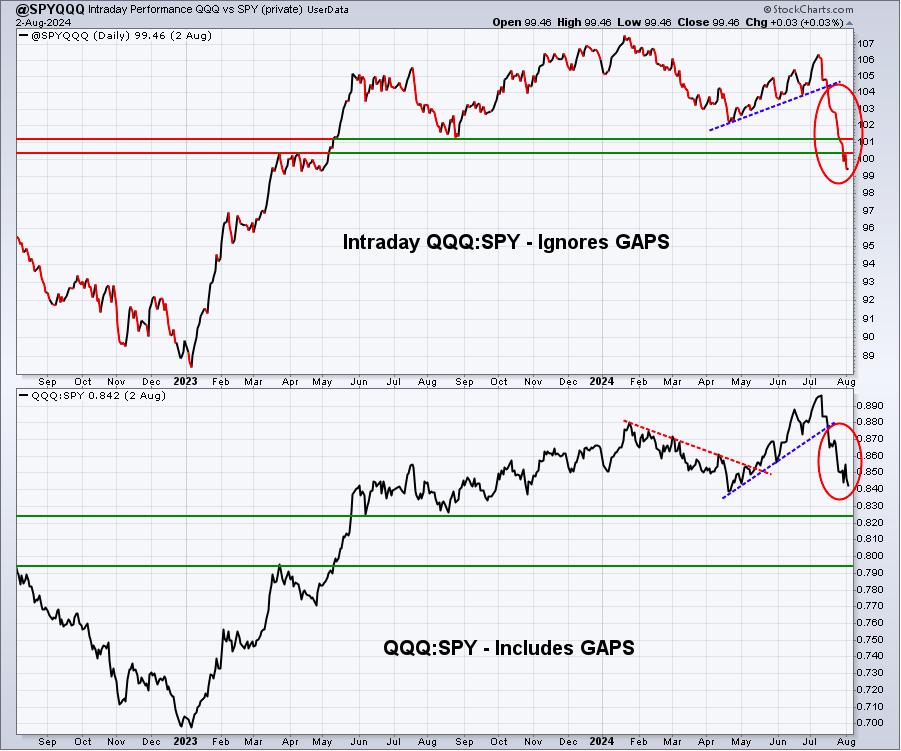
Keep in mind that the NAME of the chart is SPY:QQQ, but the actual numbers and chart represent the QQQ vs. the SPY (QQQ:SPY). After I named this User-Defined Index, I was unable to change it. That confuses a lot of folks when they review this chart. Rest assured, the actual ratio tracks how the QQQ is performing relative to the SPY.
I mentioned last week that the weakness in the top panel could lead to more selling in growth stocks. Well, this QQQ:SPY relationship has deteriorated even further. Growth stocks remain under pressure relative to value stocks on an INTRADAY basis (ignoring gaps). This tells me that distribution of growth stocks is taking place and that can be a big problem.
IWM:QQQ
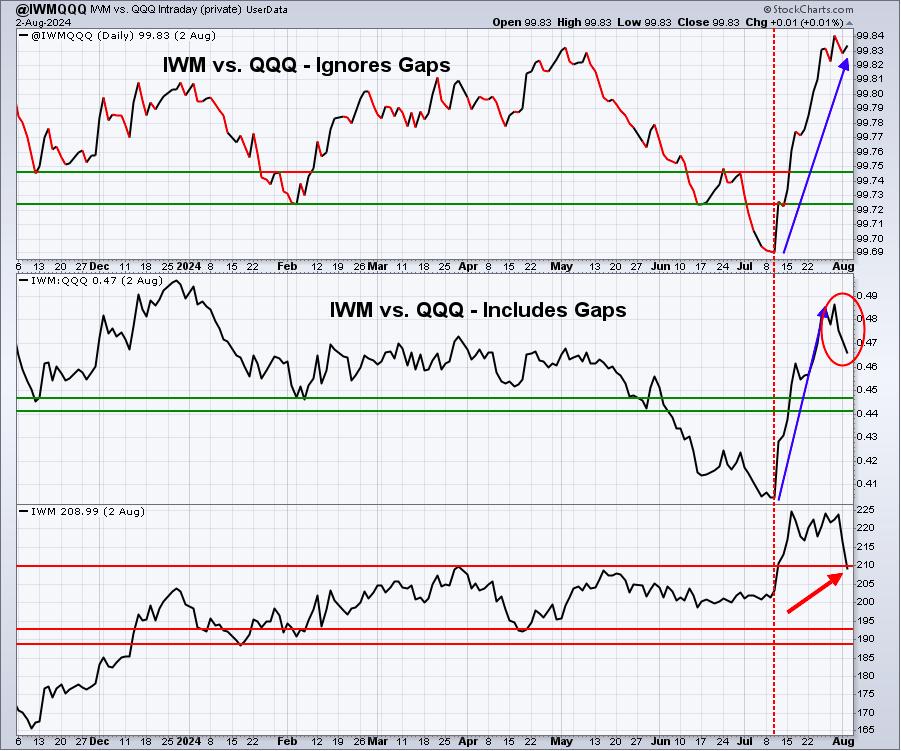
There's not a lot of good news and positive signals in the market short-term. However, this is one. I love that the small cap IWM is maintaining its INTRADAY relative strength vs. its large-cap counterparts. This suggests that the IWM trade into year end and 2025 is NOT dead just yet. I'll continue to watch this relationship, but I definitely like what I'm seeing. If correct, then short-term weakness in the IWM can be used to accumulate a position over time and throughout any additional Q3 weakness we see.
XLY:XLP
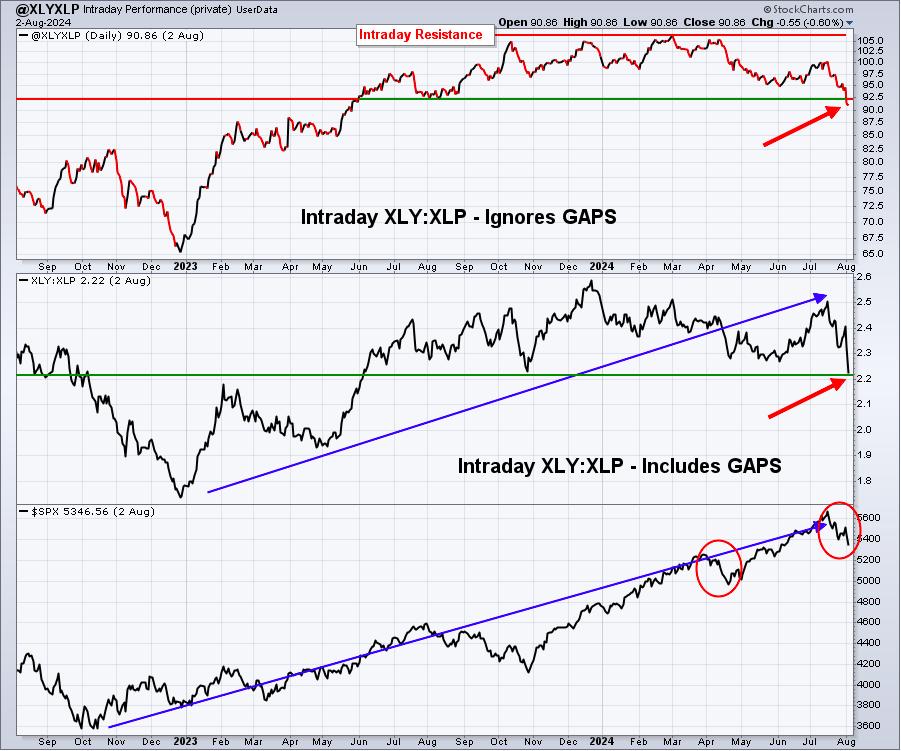
The XLY:XLP breakdown last week is quite noteworthy. Listen, I know AMZN's weak action after its quarterly earnings report has contributed to this ratio dropping. However, that top panel says it's not just about earnings-related gap downs. We're seeing INTRADAY weakness in this ratio, suggesting that Wall Street is moving more towards defensive stocks, anticipating further Q3 downside action. I wouldn't bet against it.
Gold
I wanted to mention gold ($GOLD), because during periods of increasing volatility and a falling dollar, gold typically shows its best relative strength vs. the S&P 500. Here's a quick chart to highlight how $GOLD, the $VIX, the $USD, and the $GOLD:$SPX ratio perform over time:
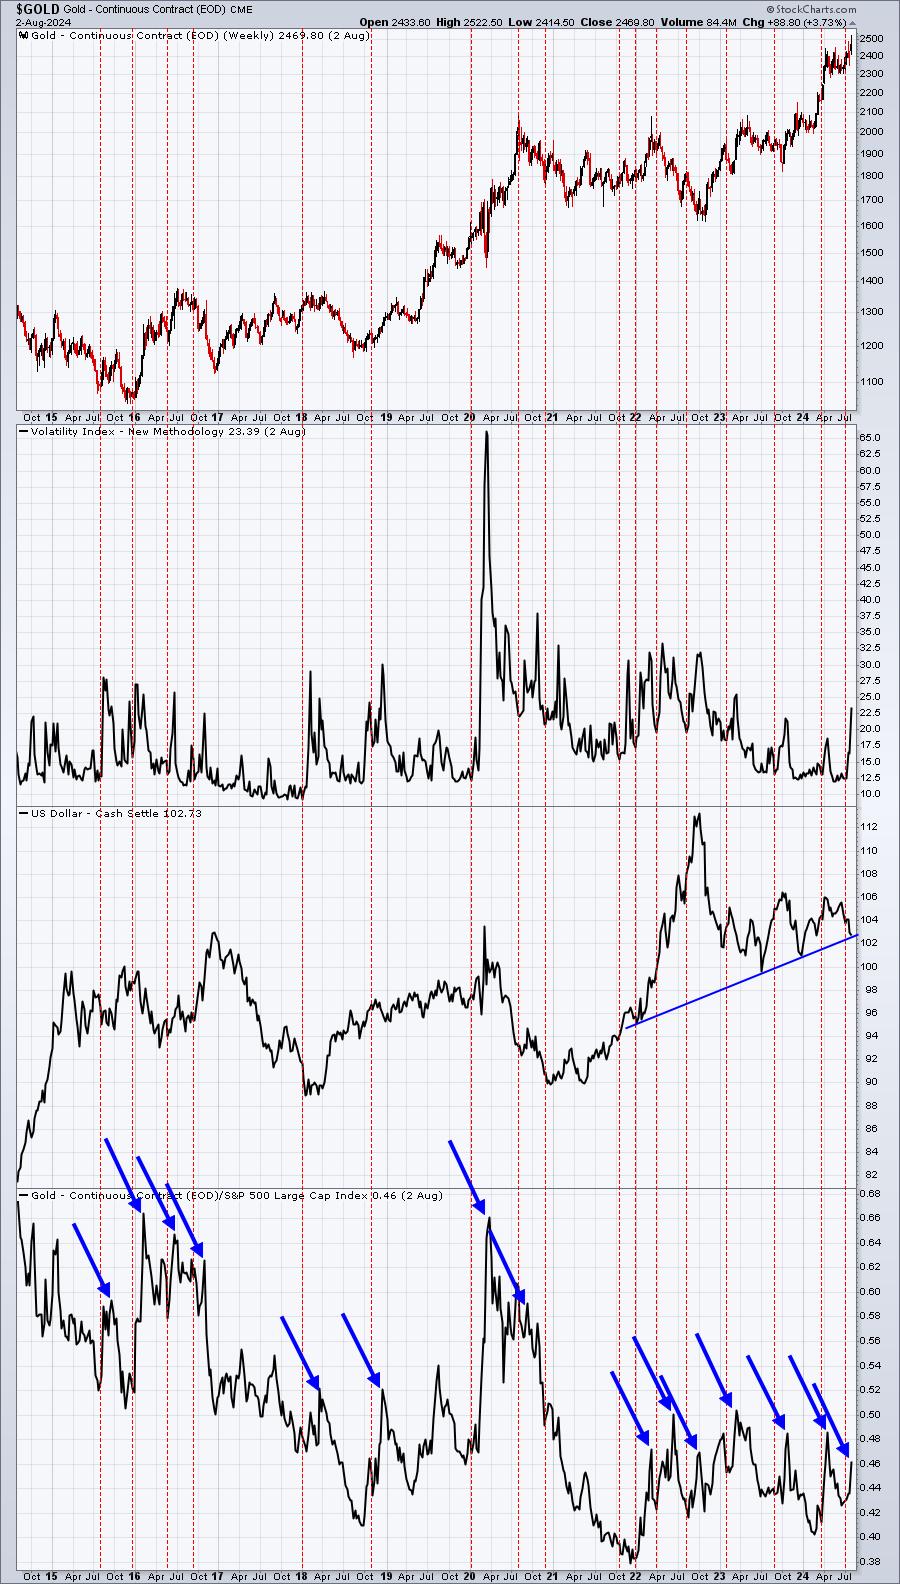
The point here is that the U.S. Dollar is testing a trendline that dates back to 2022. If this trend line fails to hold as support, it would provide another tailwind for gold. The red-dotted lines mark short-term bottoms in the VIX, just prior to significant spikes. The blue arrows on the bottom $GOLD:$SPX ratio panel mark the tops of uptrends that follow those prior VIX lows. My point here is that gold outperforms the S&P 500, and thus works as a hedge against that benchmark, when fear increases and sends the VIX much higher - like what we're experiencing now. The $GOLD:$SPX ratio is climbing right now, not because gold is flying higher, but simply because it's not falling apart like the S&P 500 has.
Sentiment
5-day SMA ($CPCE)
A VIX reading above 20 tells me that fear and panic are beginning to take over the stock market. When this happens, throw rational market behavior right out of the window. Rarely, do key support levels matter when the VIX hits the 20s, 30s, and beyond. Instead, bottoms are typically marked by short-term sentiment indicators that reach levels where previous EMOTIONAL bottoms have been reached. In my experience, there's been NO better bottom marker than the 5-day SMA of the equity only put call ratio ($CPCE). When we're in the midst of a selloff, I intentionally avoid trying to call short-term market bottoms until the 5-day SMA of the CPCE hits AT LEAST .75, preferably .80-.85. That's when a much higher percentage of options traders pile on the bearish put options. When they start buying puts in droves, you can almost smell a bottom forming.
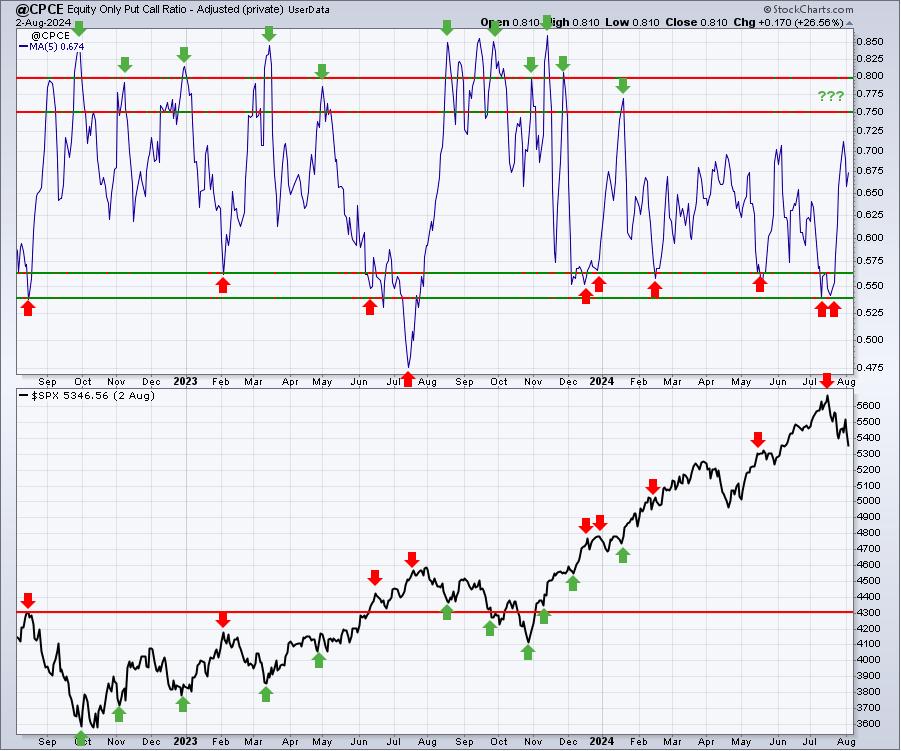
Our 5-day SMA reading right now is just 0.674, a far cry from the level necessary to feel better about a bottom forming. One piece of good news surrounding options, however, is that August monthly options expire on Friday, August 16th, just 11 days away. If the current selling continues throughout the week, we could see two potential factors triggering a market bottom:
- TONS of net in-the-money put premium that would begin to incentivize market makers to start buying during options-expiration week
- The 5-day SMA of the CPCE climbing somewhere in that .75-.85 range where we generally see market bottoms form
As always, patience will be required to identify these key market highs and lows.
Volatility Index ($VIX)
I have a few key standing rules when it comes to the VIX. One of them is don't try to be a hero when the VIX is above 20. These highly-volatile environments can be great for short-term trading IF you happen to be on the right side of the market. If you're not, you can lose a lot of capital quickly, something that I believe is very necessary to avoid in order to be a successful trader over time. I would MUCH, MUCH, MUCH rather have a market with a VIX reading of 12 vs. a market with a VIX reading of 30. High VIX readings send me into trading hibernation.
Long-Term Trade Setup
Since beginning this Weekly Market Report in early September, I've discussed the long-term trade candidates below that I really like. Generally, these stocks have excellent long-term track records and many pay nice dividends that mostly grow every year. Only in very specific cases (exceptions) would I consider a long-term entry into a stock that has a poor or limited long-term track record:
- JPM
- BA
- FFIV
- MA
- GS
- FDX
- AAPL
- CHRW
- JBHT
- STX
- HSY
- DIS
- MSCI
- SBUX
- KRE
- ED
- AJG
- NSC
Keep in mind that our Weekly Market Reports favor those more interested in the long-term market picture. Therefore, the list of stocks above are stocks that we believe are safer (but nothing is ever 100% safe) to own with the long-term in mind. Nearly everything else we do at EarningsBeats.com favors short-term momentum trading, so I wanted to provide an explanation of what we're doing with this list.
No stocks are being added to our Long-Term Trade list this week, though further weakness in Q3 could have me adding a few technology names, which I deliberately haven't added for awhile.
Looking Ahead
Upcoming Earnings:
There is little happening this week in terms of earnings. This is NOT a list of ALL companies reporting this week, so please be sure to check for earnings of any companies that you own or add. Any companies in BOLD represent stocks in one of our Portfolios:
- Monday: CSX ($68 billion), PLTR ($58 billion)
- Tuesday: AMGN ($180 billion), CAT ($162 billion), UBER ($128 billion), TDG ($71 billion)
- Wednesday: NVO ($594 billion), DIS ($170 billion), SHOP ($75 billion)
- Thursday: LLY ($791 billion), GILD ($95 billion), TTD ($43 billion), DDOG ($38 billion)
- Friday: None
Key Economic Reports:
- Monday: July PMI composite, July ISM services
- Tuesday: None
- Wednesday: None
- Thursday: Initial jobless claims, June wholesale inventories
- Friday: None
Historical Data
I'm a true stock market historian. I am absolutely PASSIONATE about studying stock market history to provide us more clues about likely stock market direction and potential sectors/industries/stocks to trade. While I don't use history as a primary indicator, I'm always very aware of it as a secondary indicator. I love it when history lines up with my technical signals, providing me much more confidence to make particular trades.
Below you'll find the next two weeks of historical data and tendencies across the 3 key indices that I follow most closely:
S&P 500 (since 1950)
- Aug 5: -31.84%
- Aug 6: +3.52%
- Aug 7: +63.70%
- Aug 8: -18.26%
- Aug 9: -12.91%
- Aug 10: -34.27%
- Aug 11: +43.86%
- Aug 12: -0.44%
- Aug 13: +0.57%
- Aug 14: -0.66%
- Aug 15: +1.57%
- Aug 16: +19.67%
- Aug 17: +48.47%
- Aug 18: -41.17%
NASDAQ (since 1971)
- Aug 5: -65.57%
- Aug 6: +27.92%
- Aug 7: +76.83%
- Aug 8: -39.45%
- Aug 9: -0.67%
- Aug 10: -55.12%
- Aug 11: +29.15%
- Aug 12: +40.42%
- Aug 13: +13.30%
- Aug 14: +36.21%
- Aug 15: -16.03%
- Aug 16: +32.76%
- Aug 17: +22.01%
- Aug 18: -7.71%
Russell 2000 (since 1987)
- Aug 5: -68.50%
- Aug 6: -11.54%
- Aug 7: +79.11%
- Aug 8: -16.81%
- Aug 9: +14.42%
- Aug 10: -58.63%
- Aug 11: +27.28%
- Aug 12: +25.97%
- Aug 13: -51.78%
- Aug 14: +30.27%
- Aug 15: -7.91%
- Aug 16: +54.20%
- Aug 17: -18.35%
- Aug 18: +6.13%
The S&P 500 data dates back to 1950, while the NASDAQ and Russell 2000 information date back to 1971 and 1987, respectively.
Final Thoughts
Ok, let's take a collective deep breath. Things have changed short-term. We've entered a much more emotional market, one that can be decided short-term by overwhelming fear during downtrends and outrageous greed during rebounds.
Here are the PRIMARY things to consider in the week ahead:
- FEAR. #2 isn't really close. StockCharts is reporting that the VIX hit a high today of 65.73, which is approaching the crazy readings during the financial crisis. This is WAAAAY overblown in my opinion, but it is what it is. Please be careful and understand that cash is absolutely a position. Your portfolio doesn't need to flipped every couple hours, trying to catch every move in each direction. If you decide to do that, I wish you the best of luck. My feeling is that if I can trade a small portion occasionally, make some money, then crawl back into my closet, I'll be ecstatic.
- Sentiment. During an emotional market, like the one we're now in, sentiment indicators become much more important than technical indicators. As the back and forth action accelerates, fear and greed will be battling one another. Keep an eye on the 5-day SMA of the CPCE. It's one of my favorite indicators to use in spotting short-term market bottoms in a declining market.
- Technical Resistance Levels. We haven't really had to discuss this for awhile, but falling 20-day EMAs will become a new reality and a key resistance during rallies.
- Earnings. Many of the largest names have now reported, but there'll still be plenty to discuss. Keep in mind, though, that an emotional market doesn't really think rationally about quarterly earnings. If growth stocks are going to sell off, they'll sell off and it likely won't matter what just was reported. Quarterly results are the equivalent of looking in the rear view mirror. The stock market prices securities based on what it sees ahead. Unfortunately, stock market uncertainty is like fog for a driver. You're not quite sure what you see or if you see anything at all.
- Economic Reports. Scratch this one. Outside of initial jobless claims on Thursday, I don't see much this week to worry about.
- Interest Rates. After dropping to 3.67% this morning, the TNX has bounced back and is just one basis point below Friday's close. I'll certainly be watching the bond market for clues, but won't be surprised by a further drop in the weeks ahead.
- Recession. We're going to hear a LOT about a potential recession as we move forward. Personally, I would put the odds on a recession at maybe 25%. I believe we'll weaken further, but a key will be the unemployment rate and initial jobless claims. If those both gain steam to the upside, the odds of a recession grow, in my view.
- History. Remember my discussion of the weakest time of the year to be invested in stocks? It's not "go away in May". It was the July 17th close through the September 26th close. We're in the first inning of a nine inning game here. Be aware and be scared, while it's appropriate to be. This too will pass.....in time.
Feedback
If you'd like to share your thoughts on our Weekly Market Report, positive or negative, you can reach us at "[email protected]".
Happy trading!
Tom