
EB Weekly Market Report - Monday, August 12, 2024
Max Pain Report
We had difficulties accessing data at cboe.com over the weekend and instead used another website to calculate max pain that did not provide us all the details we usually are able to gather at the CBOE. Therefore, the report is set up differently, but does still provide useful information as we head into July monthly options expiration week. We should have our "normal" Max Pain Report again next month.
Also, we will have our July Max Pain event on Tuesday after the market closes, as usual. We'll send out room instructions to everyone tomorrow.
ChartLists Updated
I updated the following ChartLists over the weekend and they should all be available for your viewing/downloading pleasure on our website:
- Strong Earnings (SECL)
- Strong Future Earnings (SFECL)
- Short Squeeze (SSCL)
- Raised Guidance (RGCL)
- Bullish Trifecta (BTCL)
- All Upcoming Earnings
- Upcoming Earnings - Relative Strength
Weekly Market Recap
Major Indices
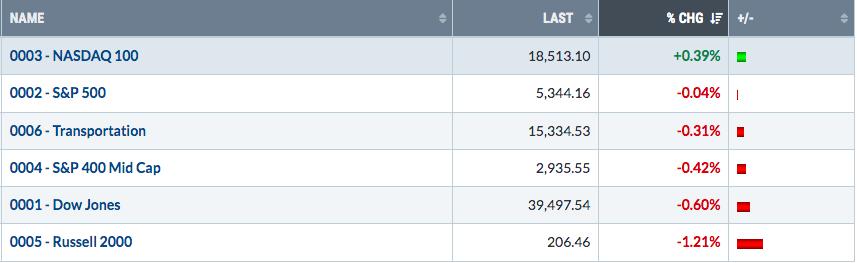
The NASDAQ 100 ($NDX) was the only one of our major indices that finished last week in positive territory. However, the coast is certainly not clear. It was nice to see the NDX rebound and reclaim all the points lost on last Monday's massive gap lower, but there are PLENTY of overhead resistance levels that the NDX must negotiate. Check this out:
NDX:
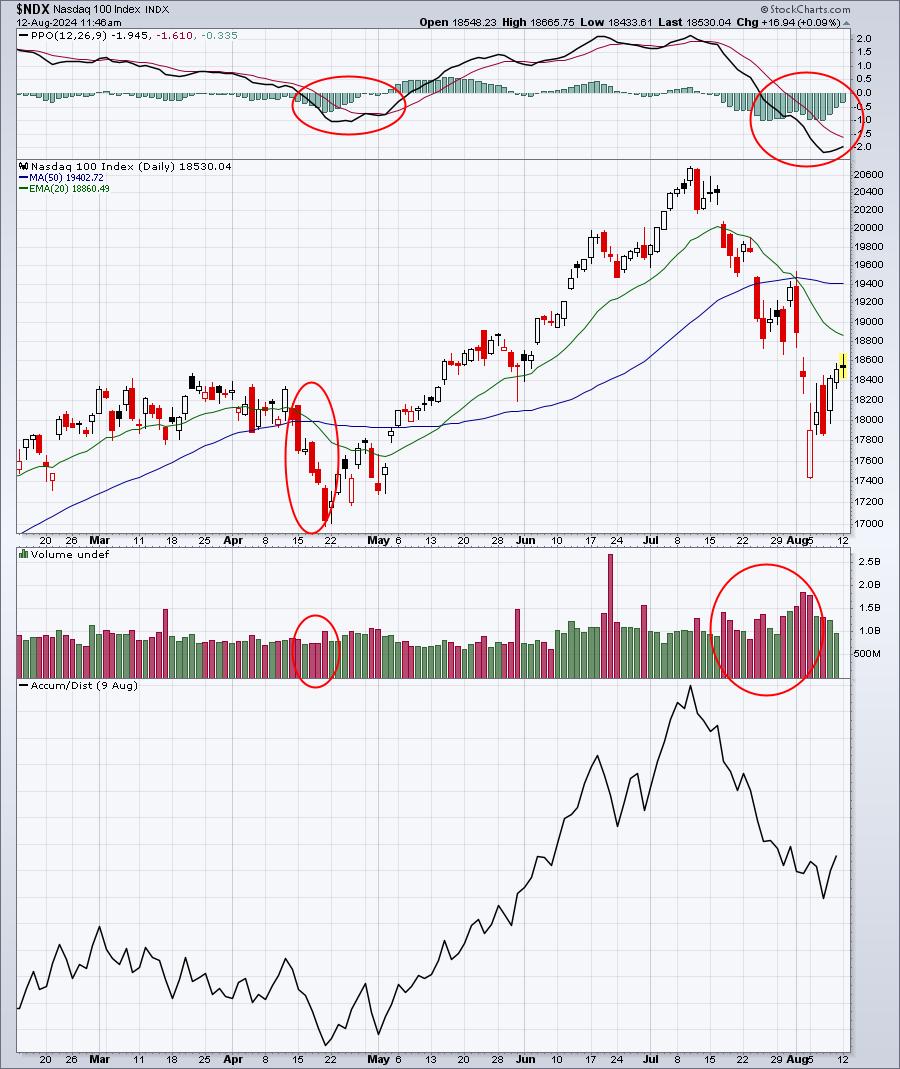
The August selling has been much more pronounced than the April selling. We have a very disappointed group of bulls that wanted to see the Fed start making headway and reverse the economic course, which appears to be weakening. And don't forget we have a Presidential Election ahead that will only add to market uncertainty. Bull markets struggle in uncertain environments and we most definitely are facing an uncertain environment right now. Interest rates, inflation, economic concerns like rising unemployment, and the upcoming Presidential Election are just 4 reasons why the bulls should remain concerned.
Sectors
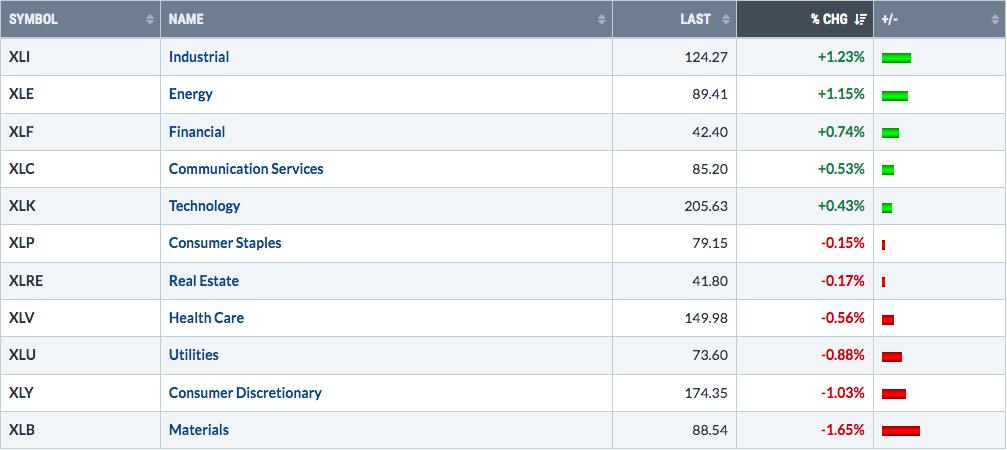
Technology (XLK) will almost always be the most important sector to watch because of its huge representation in the S&P 500 (32%) and an even stronger representation within the NASDAQ 100. After a couple of head & shoulders breakdowns, the XLK has rallied back to approach key overhead resistance. If the 5-day rally is to continue, the XLK will likely need to navigate the 210-212 range:
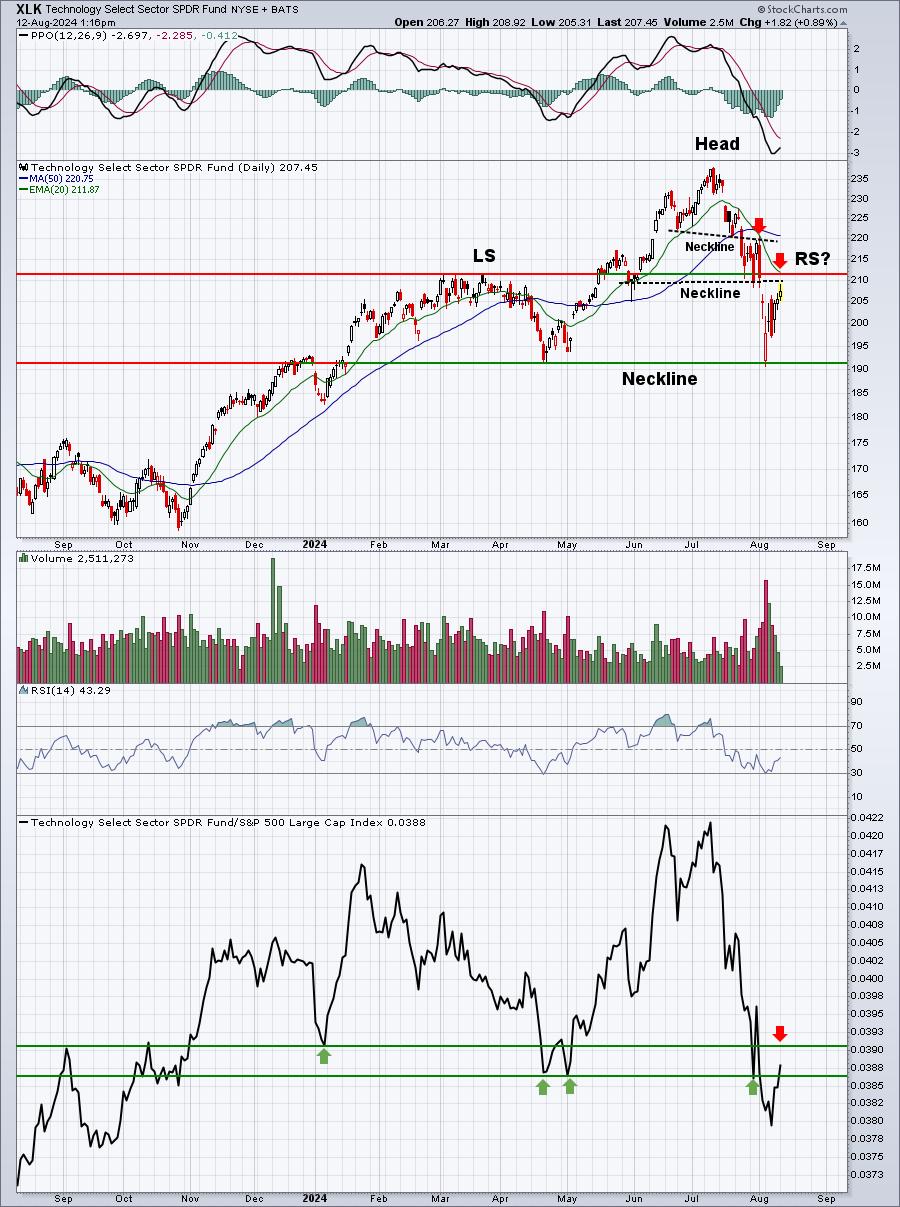
That 192 support level is MASSIVE. We'll worry about that if we move back down there again. The current question is.....can we clear the 2ND neckline resistance just below 210, along with the declining 20-day EMA near 212?
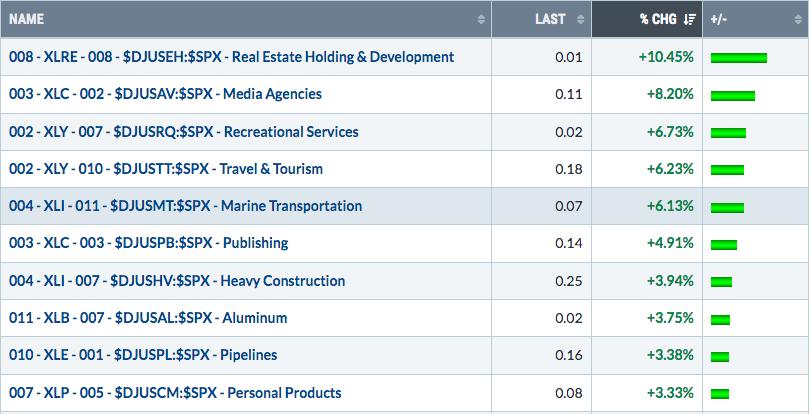
Top 10 Industries Last Week
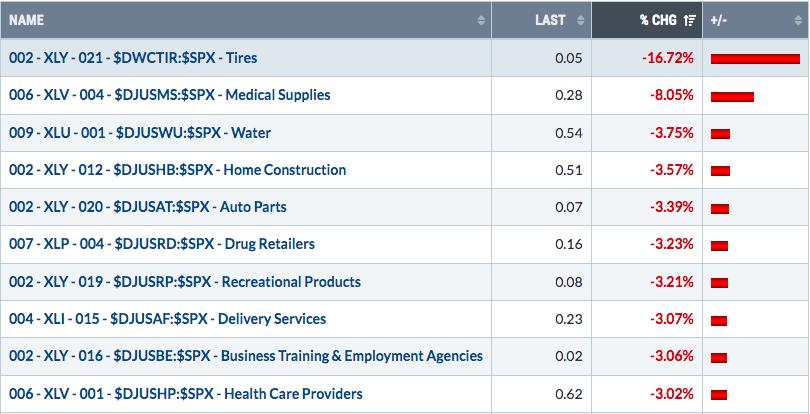
Bottom 10 Industries Last Week
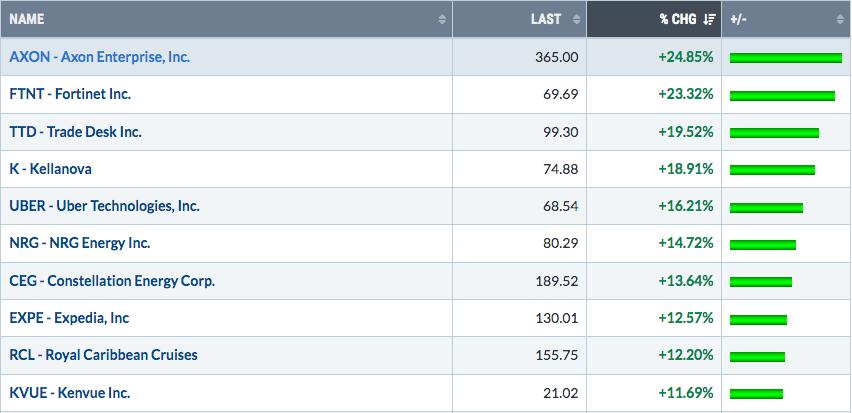
Top 10 Stocks - S&P 500/NASDAQ 100
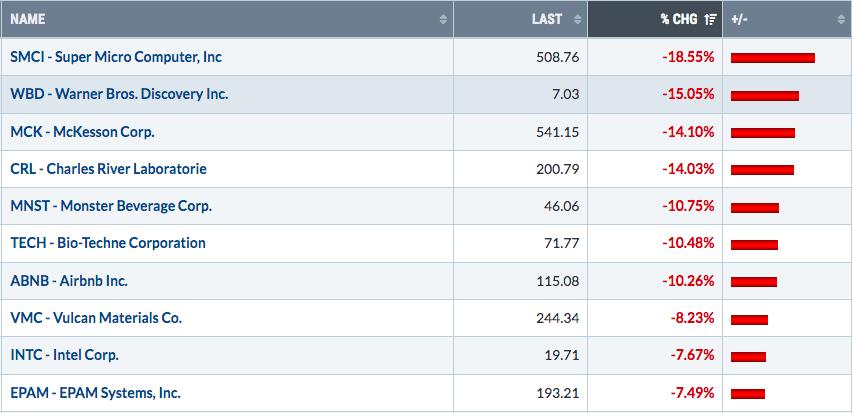
Bottom 10 Stocks - S&P 500/NASDAQ 100
Big Picture
Here's an update of the Big Picture, 100-year chart of the S&P 500:
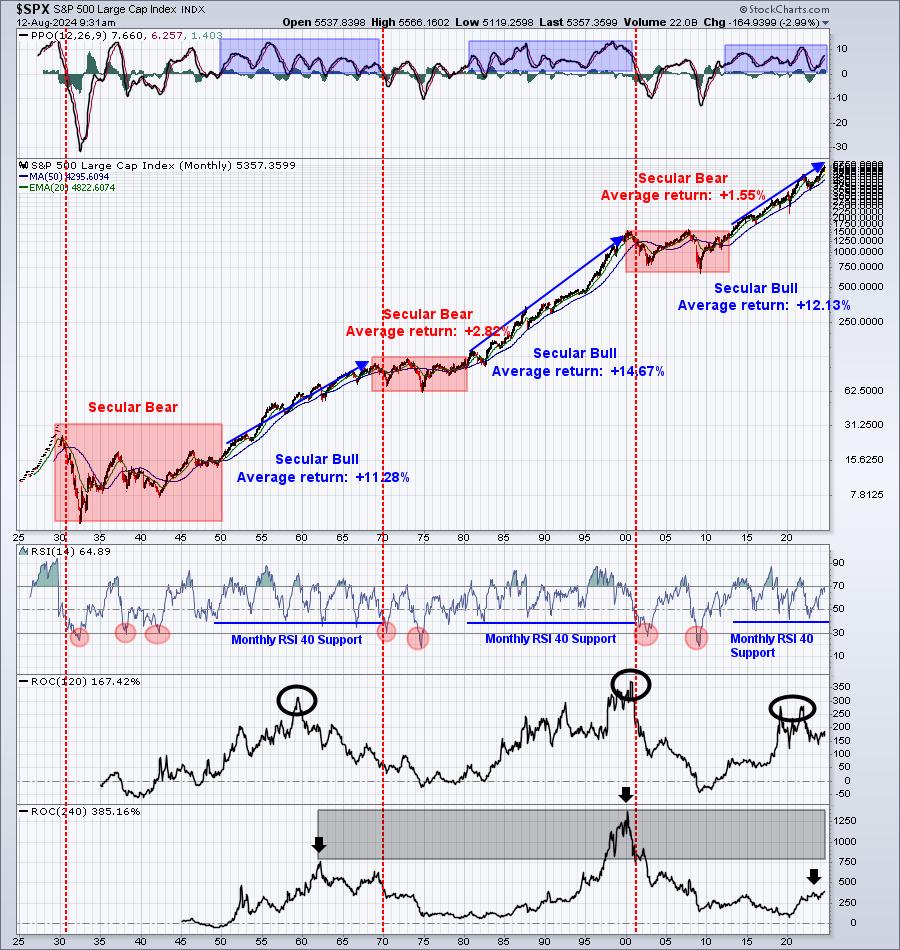
All of this craziness of the past several weeks is really not even negligible on this Big Picture chart. Everything remains fine from a longer-term perspective.
Rotation/Intermarket Analysis
Here's the latest look at our key intraday ratios as we follow where the money is traveling on an INTRADAY basis (ignoring gaps):
QQQ:SPY
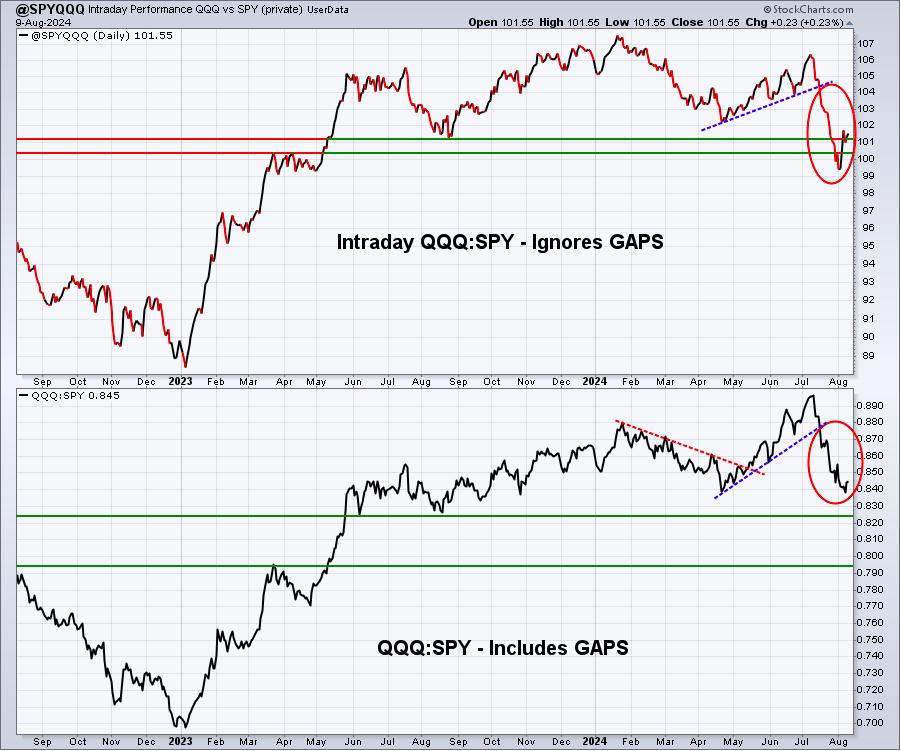
The overall tone in this chart is a simple reminder that, since the first week or two of July, risk has been out of favor. Remember, this chart is actually calculated QQQ:SPY, despite its "@SPYQQQ" name. This downtrend should make everyone a bit nervous and cautious.
IWM:QQQ
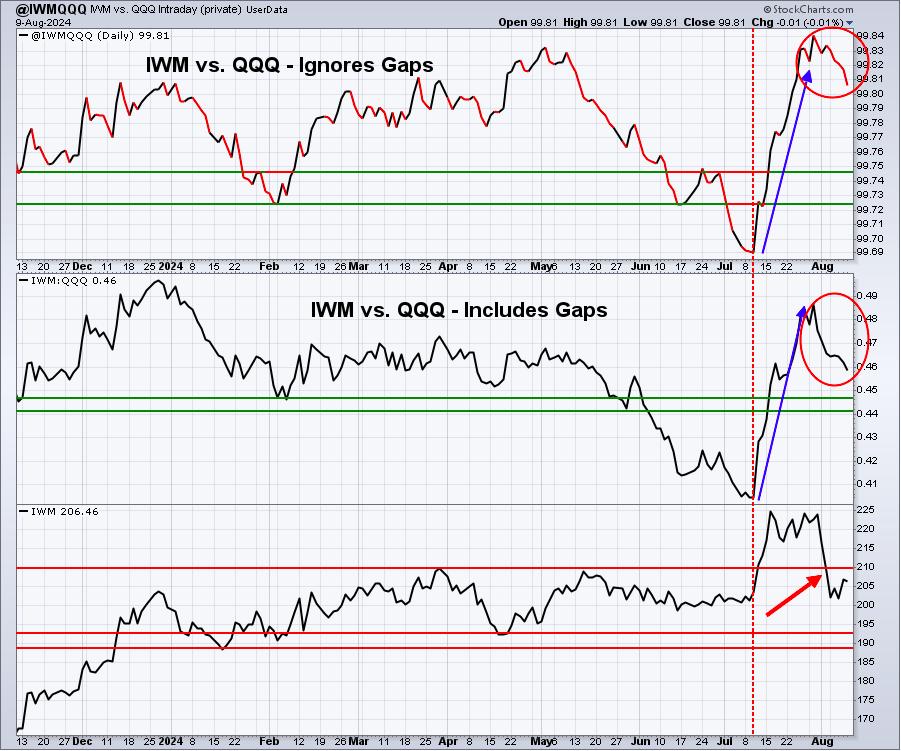
The downturn in the IWM:QQQ ratio was as abrupt as the previous rally. Wall Street was banking on rate cuts and the Fed's most recent delay did not settle well with traders. That's why upcoming inflation and economic reports will be so crucial and could result in wild swings.
XLY:XLP
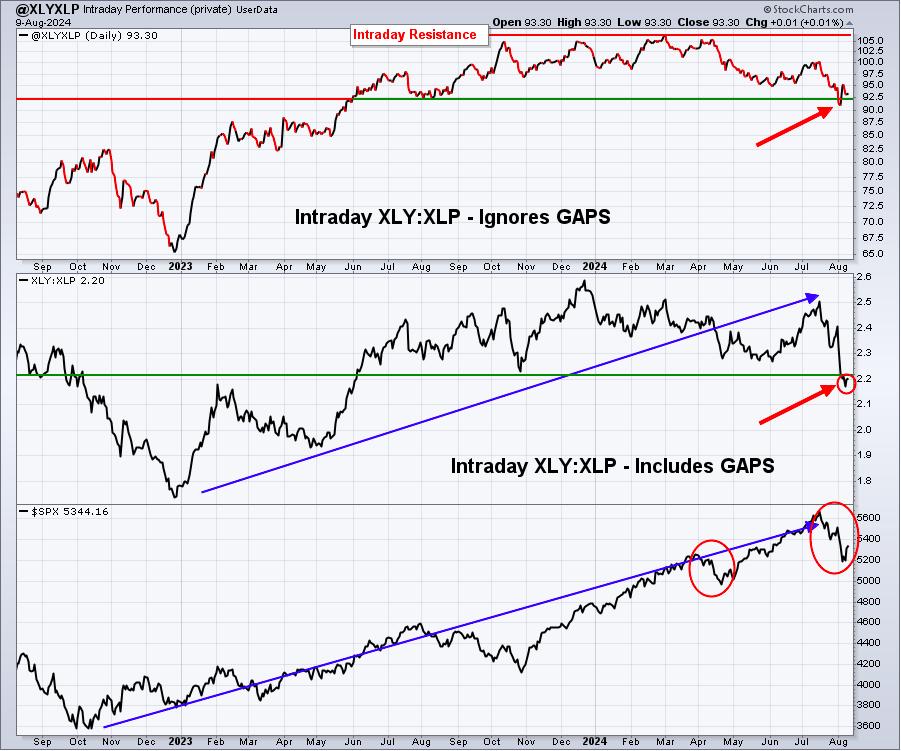
A breakdown in one of our key sustainability ratios (and one of my personal favorites) is NEVER bullish news. Keep in mind this is only ONE secondary signal, but it's definitely a bearish one. Until this ratio begins climbing consistently, the rotation towards staples is not healthy for U.S. equities.
Inflation
We have two big inflation reports out on Tuesday and Wednesday as the July PPI and July CPI will be released on those two days, respectively. While both will be watched, the CPI report on Wednesday is the MUCH bigger report, in my view. After all, if the Fed was waiting for the Core PPI to hit a 2% target, we'd already have seen rate cuts. Here's the chart of the $$CPPI:
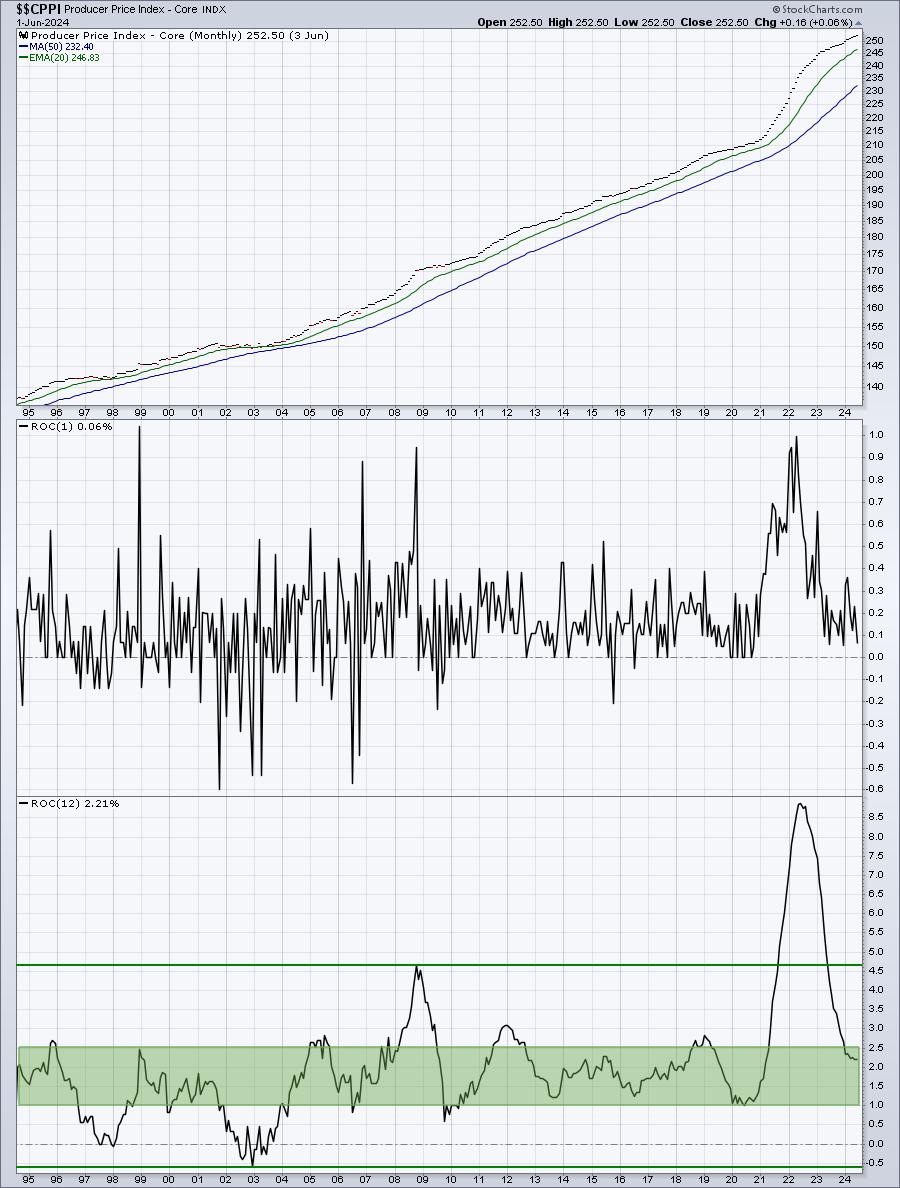
Check out the bottom panel, which reflects the annual Core PPI rate of 2.21%. PPI tends to be much more volatile than CPI as well. I'd say the "normal" range for the Core PPI is from 1.0% to 2.5%. The current reading seems to be safely in that range.
But here's the current look at the annual Core CPI rate:
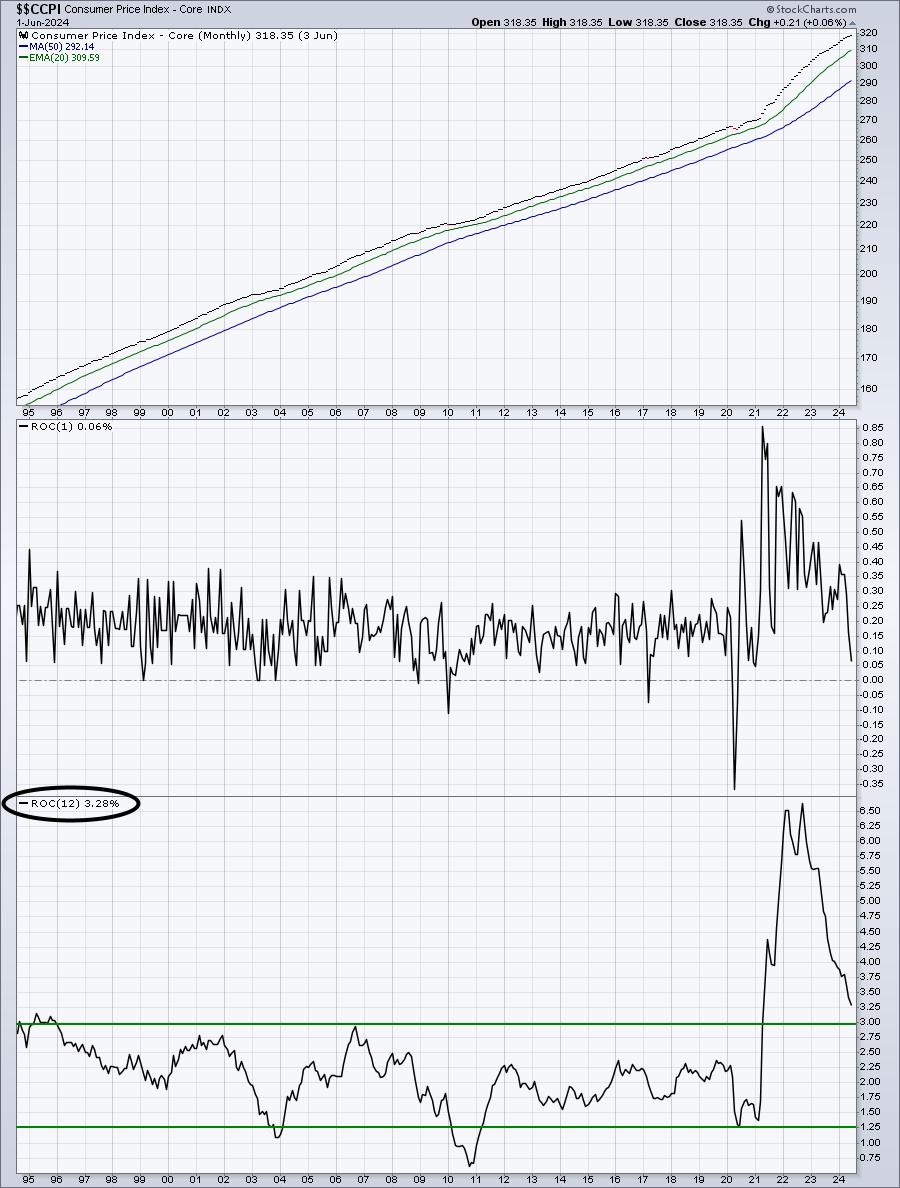
Core CPI still has some work to do to fit into that "normal" range of 1.25% to 3.00%. I'm not sure what the Fed needs to see to be more comfortable that the 2-year drop in Core CPI is sustainable. I'm not sure the Fed knows. The move lower in annual Core CPI seems rather sustainable to me, so I'd like to get a definition from the Fed as to what sustainability means to them.
Needless to say, a sudden "pop" to the upside in the Core CPI on Wednesday would likely be met with a TON of selling and another significant gap lower. I'm not predicting that will happen, just saying that a move up would probably be the worst possible piece of news for the stock market, especially those bulls that have been calling for and looking forward to rate cuts (like me).
Sentiment
5-day SMA ($CPCE)
Here's a quick update on the 5-day SMA of the equity only put call ratio. Remember, a 5-day reading above .75 is historically what I look for to mark a potential market bottom. I'd feel even more comfortable if this reading were to surge above .80.
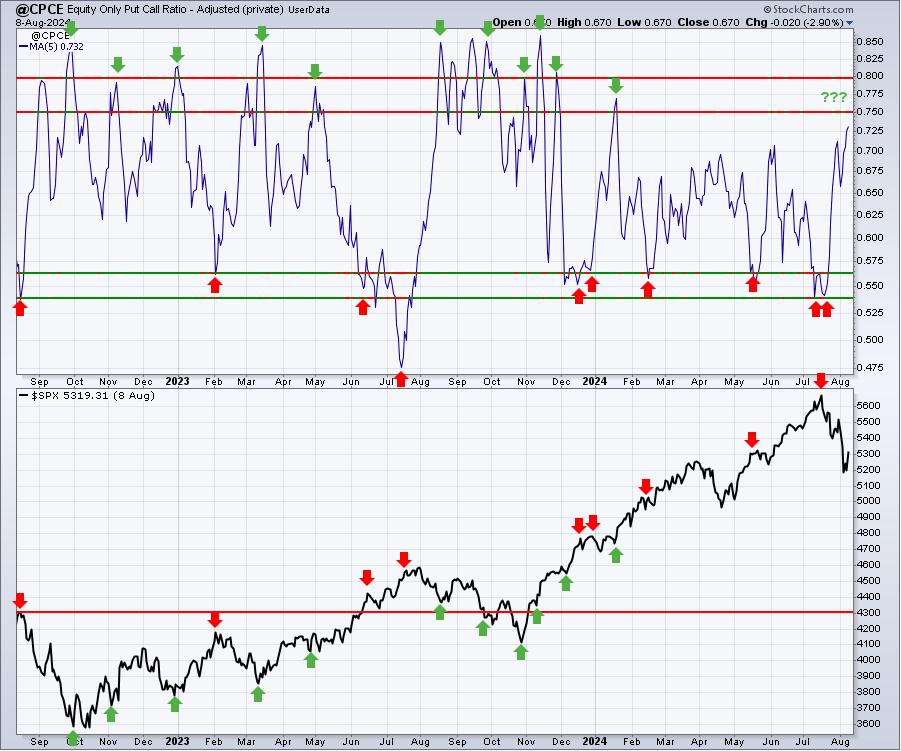
We're not there yet. If we see another downturn in stocks this week, then maybe it'll line up with a key bottom. For now, though, the CPCE is neutral to slightly bullish.
Volatility Index ($VIX)
The Volatility Index ($VIX) has a history of remaining elevated (above 17) during bear markets. If this is going to morph into a cyclical bear market, or 20% decline, the VIX will likely remain above 17. Here's where it currently stands:
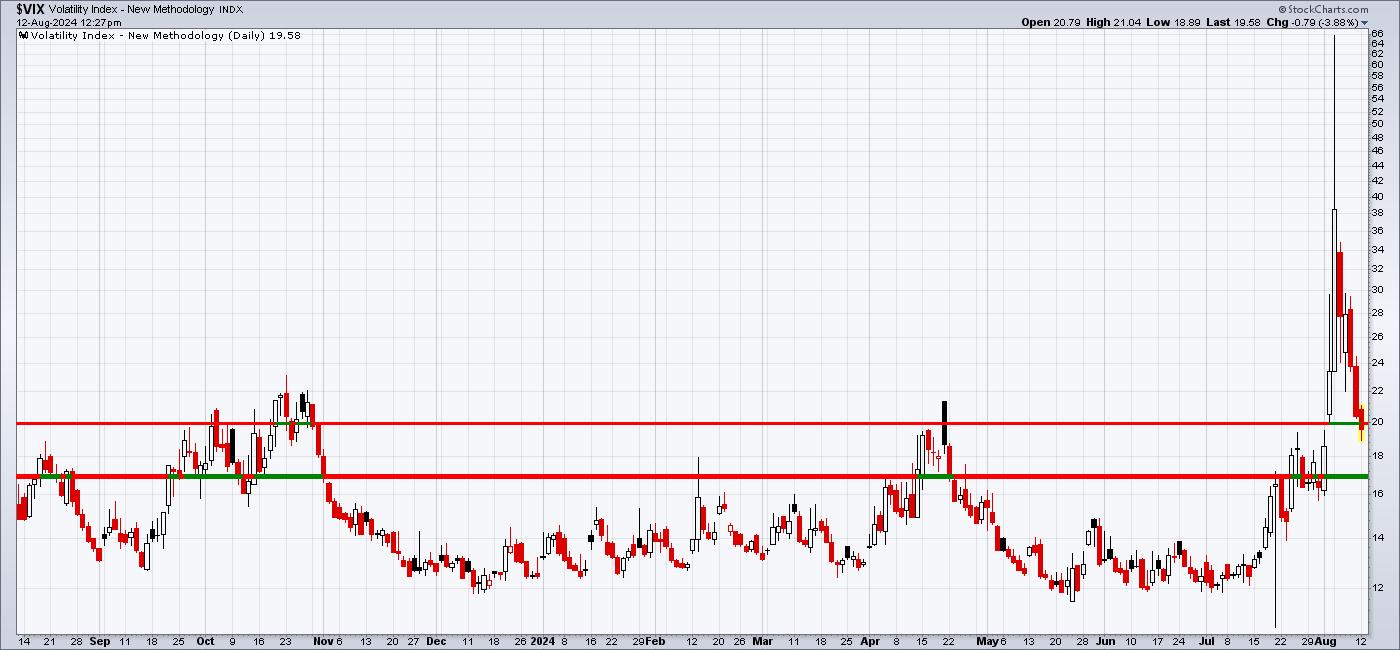
This chart is telling us that we could see a swift drop in the next day or two, which might coincide with the Tuesday PPI and/or Wednesday CPI reports. And this could go either way, by the way. A big move lower in the VIX back below 17 would suggest our 2024 low is very likely already in with that gap lower last Monday.
Long-Term Trade Setup
Since beginning this Weekly Market Report in early September, I've discussed the long-term trade candidates below that I really like. Generally, these stocks have excellent long-term track records and many pay nice dividends that mostly grow every year. Only in very specific cases (exceptions) would I consider a long-term entry into a stock that has a poor or limited long-term track record:
- JPM
- BA
- FFIV
- MA
- GS
- FDX
- AAPL
- CHRW
- JBHT
- STX
- HSY
- DIS
- MSCI
- SBUX
- KRE
- ED
- AJG
- NSC
Keep in mind that our Weekly Market Reports favor those more interested in the long-term market picture. Therefore, the list of stocks above are stocks that we believe are safer (but nothing is ever 100% safe) to own with the long-term in mind. Nearly everything else we do at EarningsBeats.com favors short-term momentum trading, so I wanted to provide an explanation of what we're doing with this list.
No stocks are being added to our Long-Term Trade list this week, though further weakness in Q3 could have me adding a few technology names, which I deliberately haven't added for awhile. This will be the theme later in Q3, if we do see upcoming market weakness.
Looking Ahead
Upcoming Earnings:
There is little happening this week in terms of earnings. There are still a large number of companies reporting, but few that have the potential to move the market. This is NOT a list of ALL companies reporting this week, so please be sure to check for earnings of any companies that you own or add. Any companies in BOLD represent stocks in one of our Portfolios:
- Monday: None
- Tuesday: HD ($345 billion)
- Wednesday: CSCO ($185 billion), UBS ($92 billion)
- Thursday: WMT ($544 billion), BABA ($204 billion), AMAT ($158 billion), DE ($96 billion)
- Friday: None
Key Economic Reports:
- Monday: None
- Tuesday: July PPI
- Wednesday: July CPI
- Thursday: Initial jobless claims, July retail sales, August Philadelphia Fed Mfg, August empire state mfg, July industrial production & capacity utilization, June business inventories, August housing market index
- Friday: July housing starts & building permits, August consumer sentiment
Historical Data
I'm a true stock market historian. I am absolutely PASSIONATE about studying stock market history to provide us more clues about likely stock market direction and potential sectors/industries/stocks to trade. While I don't use history as a primary indicator, I'm always very aware of it as a secondary indicator. I love it when history lines up with my technical signals, providing me much more confidence to make particular trades.
Below you'll find the next two weeks of historical data and tendencies across the 3 key indices that I follow most closely:
S&P 500 (since 1950)
- Aug 12: -0.44%
- Aug 13: +0.57%
- Aug 14: -0.66%
- Aug 15: +1.57%
- Aug 16: +19.67%
- Aug 17: +48.47%
- Aug 18: -41.17%
- Aug 19: -50.68%
- Aug 20: +57.18%
- Aug 21: -10.69%
- Aug 22: -1.85%
- Aug 23: +8.94%
- Aug 24: +3.37%
- Aug 25: -20.66%
NASDAQ (since 1971)
- Aug 12: +40.42%
- Aug 13: +13.30%
- Aug 14: +36.21%
- Aug 15: -16.03%
- Aug 16: +32.76%
- Aug 17: +22.01%
- Aug 18: -7.71%
- Aug 19: -84.63%
- Aug 20: +32.35%
- Aug 21: -16.20%
- Aug 22: +31.20%
- Aug 23: +1.99%
- Aug 24: +11.28%
- Aug 25: +27.71%
Russell 2000 (since 1987)
- Aug 12: +25.97%
- Aug 13: -51.78%
- Aug 14: +30.27%
- Aug 15: -7.91%
- Aug 16: +54.20%
- Aug 17: -18.35%
- Aug 18: +6.13%
- Aug 19: -98.52%
- Aug 20: +29.43%
- Aug 21: -10.59%
- Aug 22: +21.67%
- Aug 23: -53.72%
- Aug 24: +32.69%
- Aug 25: +5.79%
The S&P 500 data dates back to 1950, while the NASDAQ and Russell 2000 information date back to 1971 and 1987, respectively.
Final Thoughts
Well, we've seen opposite sides of the investing spectrum over the past 10 days. Extreme fear began building after the Fed meeting and led to a monstrous gap down last Monday. However, the bulls quickly responded. There was movement in both directions last week, but the rebound was the primary trend. We're now approaching key resistance level on key indices, sectors, and stocks.
Here are the PRIMARY things to consider in the week ahead:
- VIX support. In all of my research, one common denominator during bear markets, if this is what this is, is that the VIX remains above 17. If we see a sustained move below 17, I'd say the bottom for Q3 is in. However, if we see a rebound in a rising VIX back to 20 or higher, that would be a bearish market development as rising fear can lead to significant market losses in a short period of time.
- Inflation. This is what the Fed fears. Therefore, the bullish outcome is easy. The Core PPI and Core CPI for July need to be reported at or below consensus estimates. Both currently are expected to come in at +0.2%.
- Economic Reports. Once the inflation reports are behind us, key economic reports will surface, beginning on Thursday. It's like walking in a mine field. If inflation doesn't crush the bulls, then weak economic reports could. Evidence of a soft landing - falling inflation and a resilient economy is what the Fed is hoping for. Just remember, their biggest fight and our biggest enemy is inflation. We really need to see these upcoming inflation reports TAME.
- Technical Resistance. Upcoming tests of 20-day EMAs and 50-day SMAs will also likely test critical overhead price resistance (lows prior to last Monday's huge gap down) and gap resistance levels. To clear all of this would be asking a lot, especially after last week's rebound and all the data we need to navigate, but it's possible. A big breakout above all of this resistance would be very bullish.
- Earnings. There are a couple key earnings reports this week, but the really big one will be later this month when NVDA reports on August 28th after the market closes. NVDA has a history of running higher into its earnings reports. Can it do it this month, after its recent gap downs and price breakdowns? That will likely determine the fate of semiconductors ($DJUSSC).
- History and the Presidential Election cycle. August and September have a reason for being bearish months for a reason. Presidential Elections simply tend to magnify that weakness. Will 2024 be any different? We'll find out together.
Feedback
If you'd like to share your thoughts on our Weekly Market Report, positive or negative, you can reach us at "[email protected]".
Happy trading!
Tom