
EB Weekly Market Report - Monday, August 19, 2024
ChartLists Updated
I updated the following ChartLists over the weekend and they should all be available for your viewing/downloading pleasure on our website:
- Strong Earnings (SECL)
- Strong Future Earnings (SFECL)
- Raised Guidance (RGCL)
- Bullish Trifecta (BTCL)
- All Upcoming Earnings
- Upcoming Earnings - Relative Strength
Weekly Market Recap
Major Indices
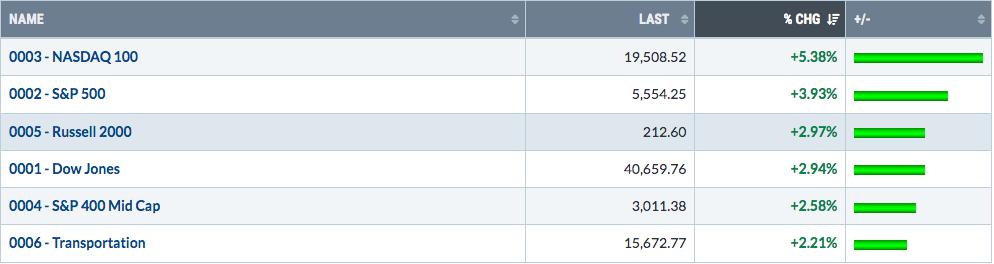
The NASDAQ 100 ($NDX) had a very strong week last week, but I'm still having a difficult time believing that we won't have AT LEAST more sideways action over the next several weeks, rather than a continuing rally to an all-time high. But anything is possible, and we all must remember that we are in a secular bull market. The ultimate long-term move in our major indices, in my opinion, is higher. My concern is only the next couple months. We have a Fed that has proven over and over and over again that they'll disappoint Wall Street in favor of ensuring that inflation is in check. They'll have another chance to disappoint from Jackson Hole, WY this week. Given the mostly stronger economic reports last week, the Fed may feel they have the luxury of waiting longer to lower interest rates. Currently, Wall Street is mostly in the camp of how much rates will be lowered in September, not IF rates will be lowered. They're set up potentially for yet another disappointment. I am totally in favor of a rate cut, but I've been in favor of that for the past 2-3 meetings, minimum, and we've yet to see one.
Technically, rotation has been favoring the Dow Jones and S&P 500, despite last week's strong showing by the NDX. The leadership last week was primarily in our aggressive sectors, which is generally a bullish development.
Sectors
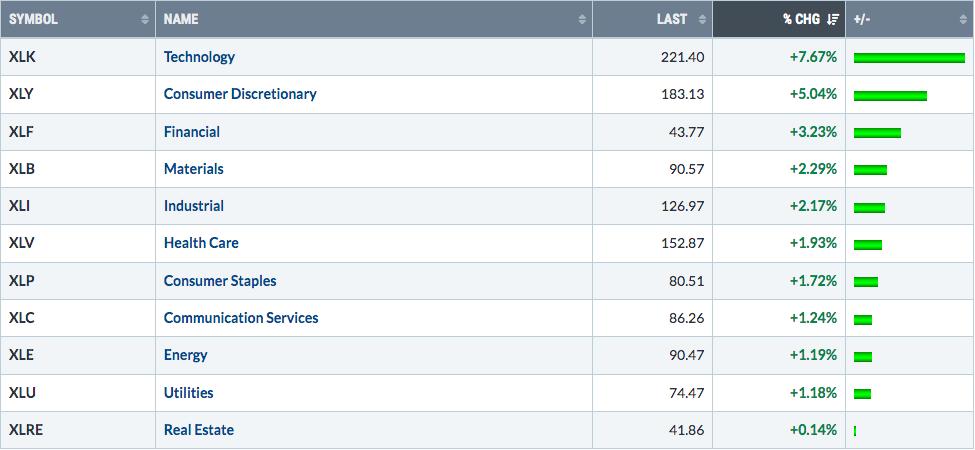
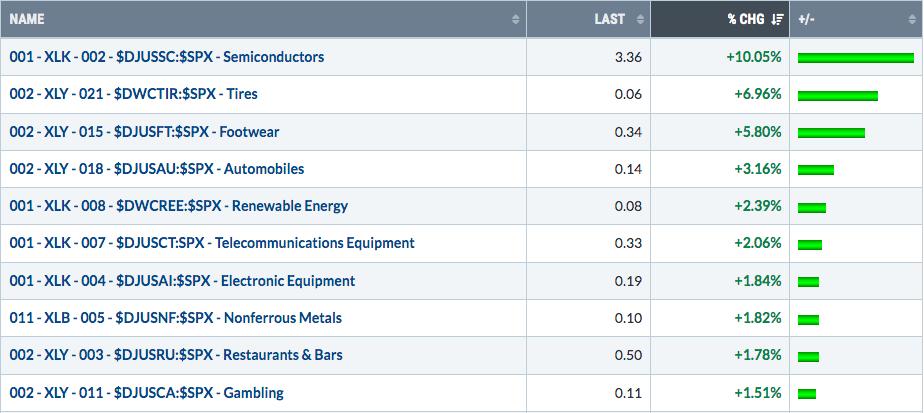
Technology (XLK) was the clear leader last week (finally!) as semiconductors ($DJUSSC, +14.38%) soared. That was nice in the near-term, but it absolutely feels like Wall Street has rotated/is rotating more into value-oriented areas of the market. This is setting up for a strong end-of-year rally in areas like financials (XLF) and industrials (XLI). Take a look at our 5 aggressive sectors and check out where they are vs. where they were when the June CPI was released on July 12th:
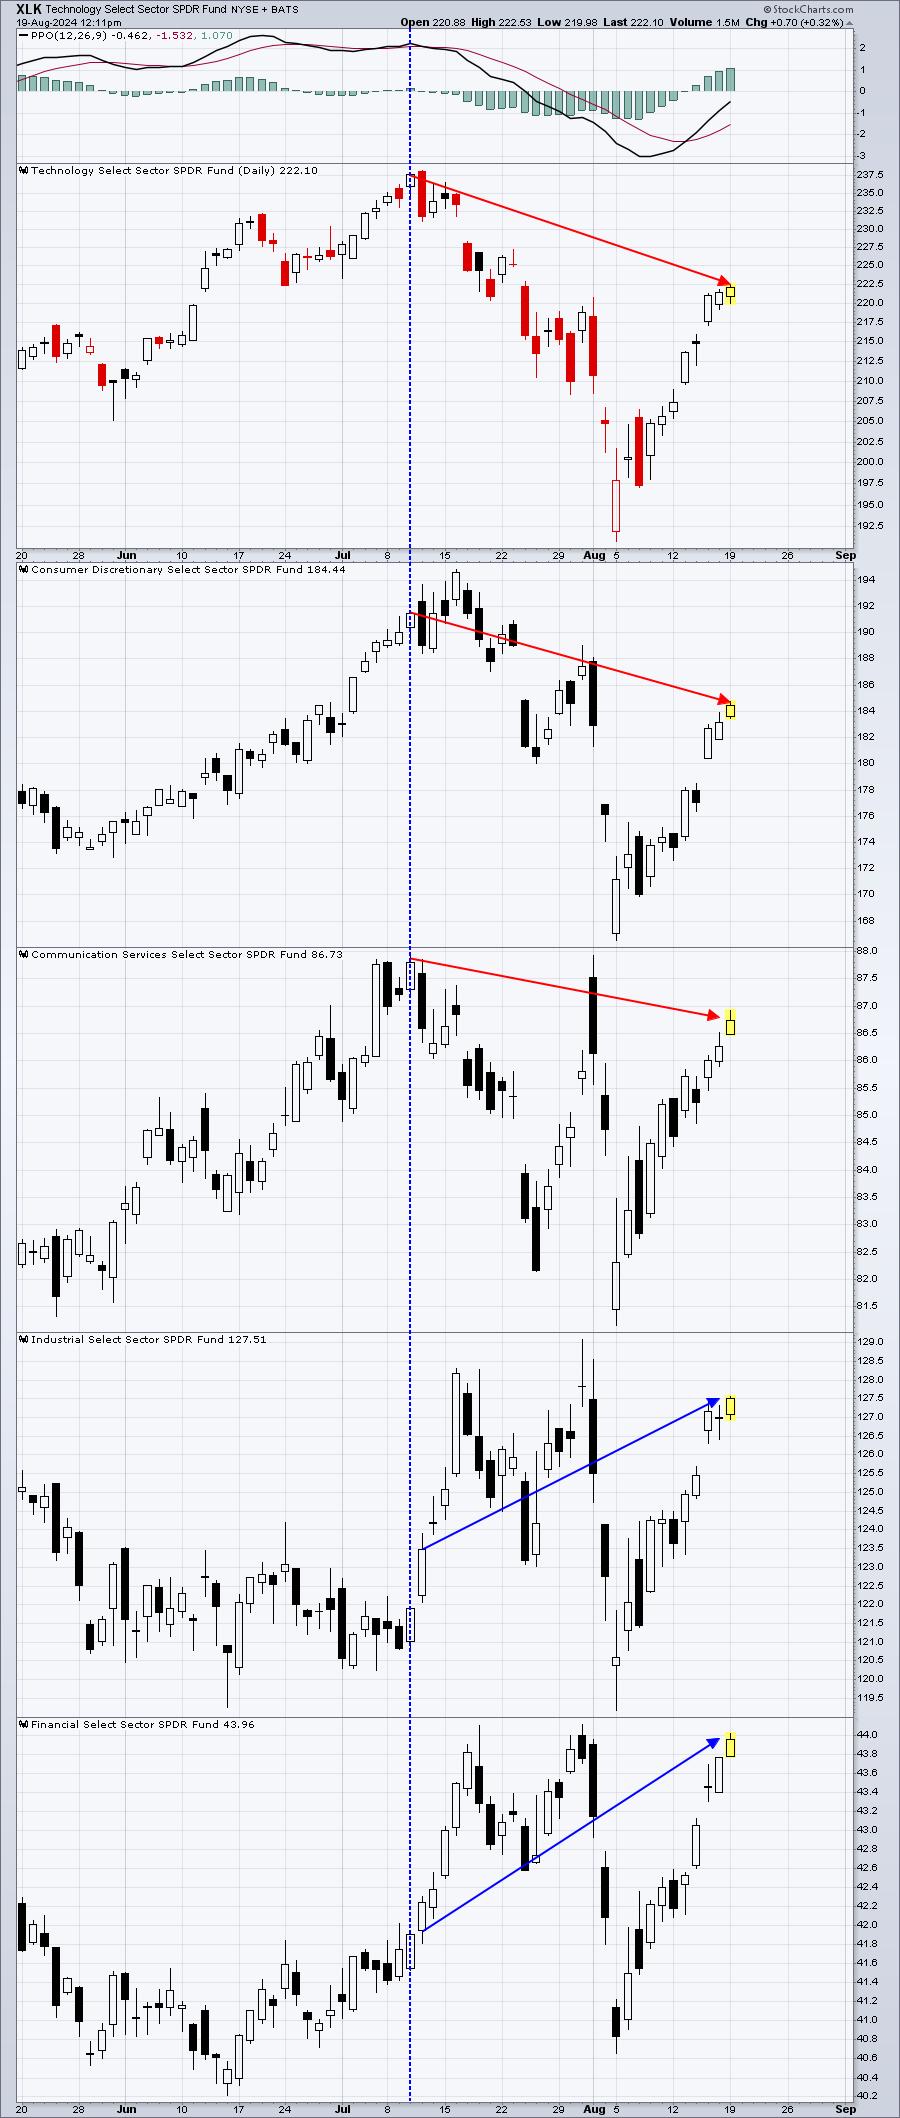
Yes, the XLK has enjoyed a great run and yes, the semiconductors flew last week. But what I'm seeing since the big inflation news hit is that money is rotating and the other aggressive areas like financials and industrials are benefiting the most - and likely will continue to do so. Also, I don't expect the small caps to remain lower for long. They've rallied back nicely of the August low and I fully expect this group to be setting all-time highs later in 2024.
Top 10 Industries Last Week
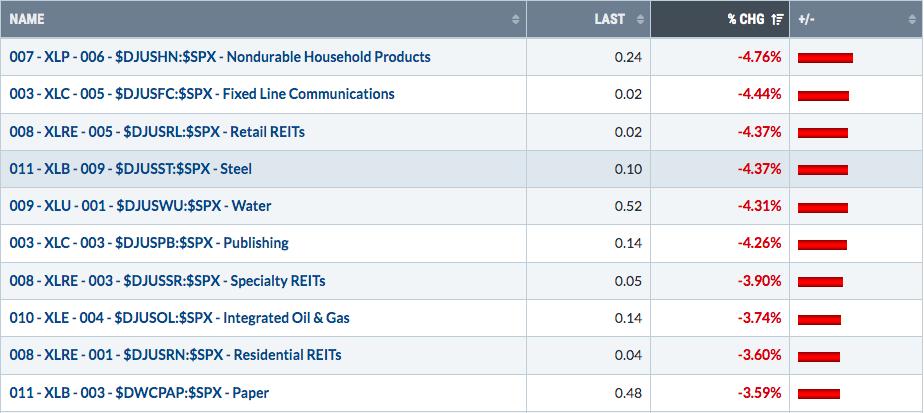
Bottom 10 Industries Last Week
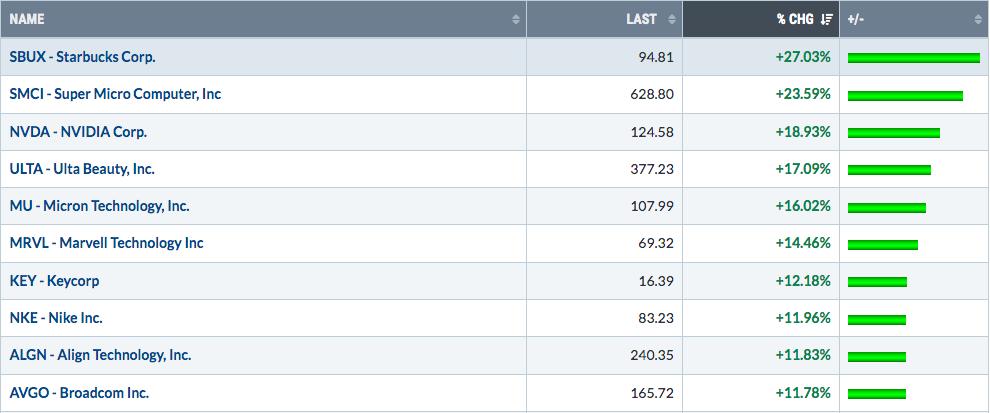
Top 10 Stocks - S&P 500/NASDAQ 100
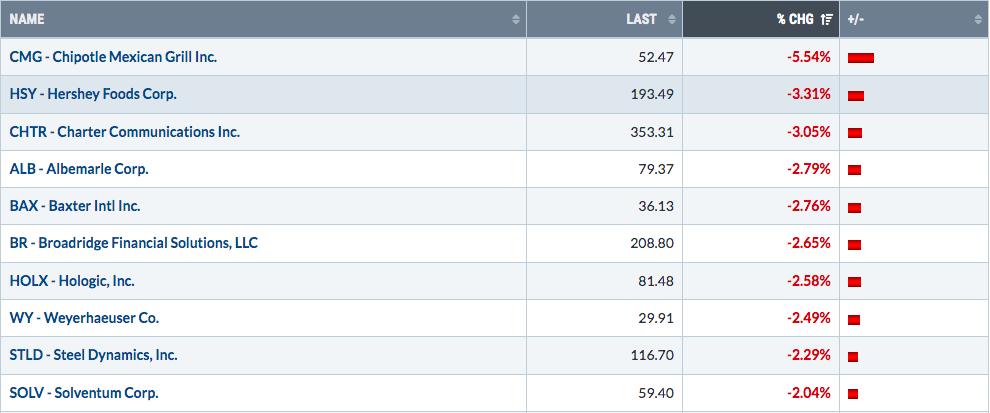
Bottom 10 Stocks - S&P 500/NASDAQ 100
Big Picture
Here's an update of the Big Picture, 100-year chart of the S&P 500:
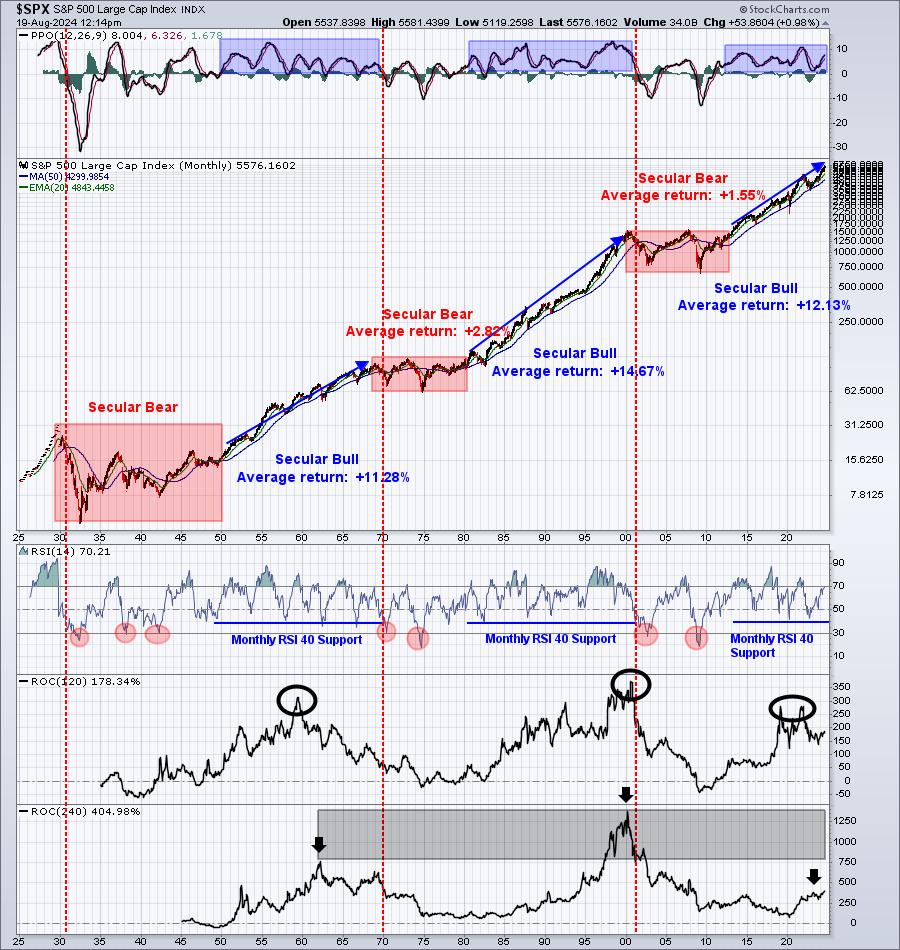
This chart provides me a TON of confidence/comfort from a long-term perspective. It completely drowns out the short-term noise and enables us to focus squarely on the long-term trend, which is higher.
Rotation/Intermarket Analysis
Here's the latest look at our key intraday ratios as we follow where the money is traveling on an INTRADAY basis (ignoring gaps):
QQQ:SPY
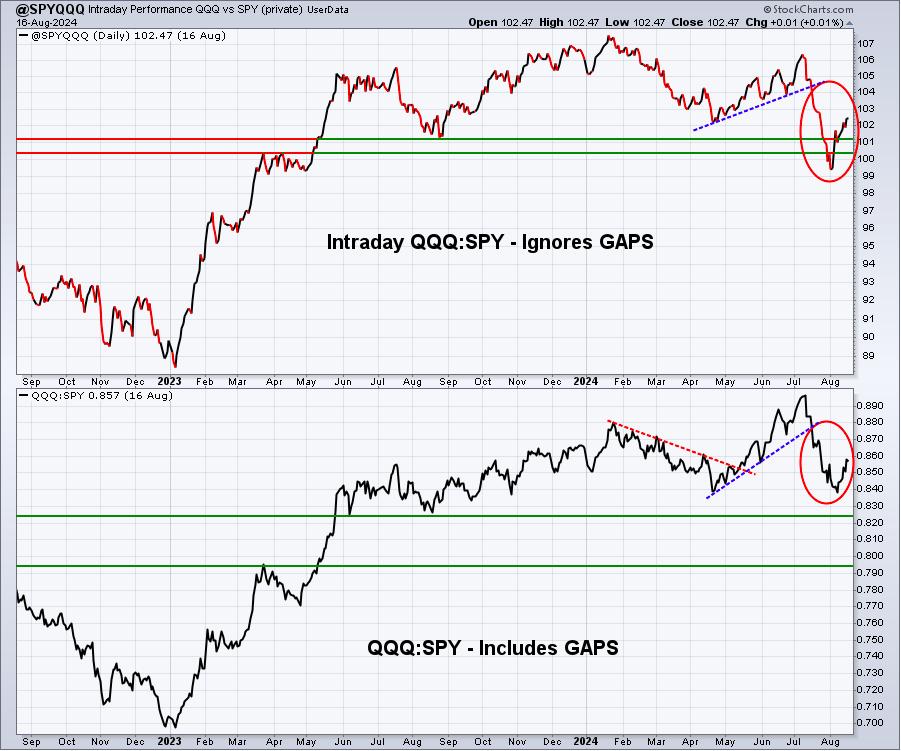
It was certainly nice to see a big recovery in many of the risk areas last week. But you can see from the above chart that we have a TON of work to do before I'd call the rotation crazy bullish.
Also, this chart is actually calculated QQQ:SPY, despite its "@SPYQQQ" name.
IWM:QQQ
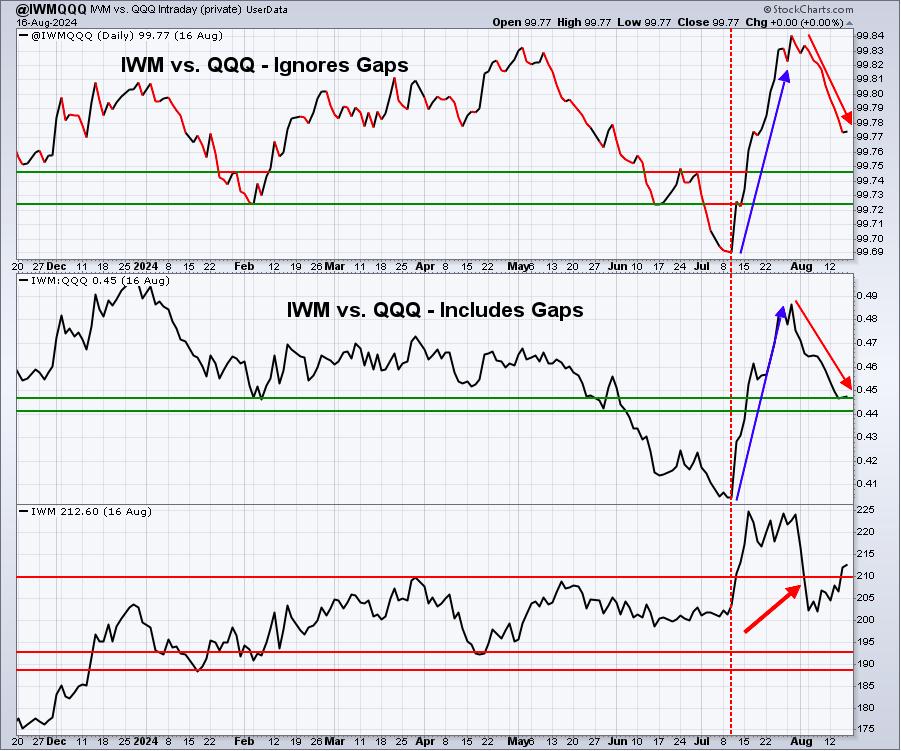
The QQQ has significantly outperformed the IWM in August, reminiscent of the wild outperformance of the QQQ in recent years. I do believe rate cuts, once the Fed acknowledges them, will send more money pouring back into the IWM, especially financials. Cutting rates will help the regional banks (KRE) immensely.
XLY:XLP
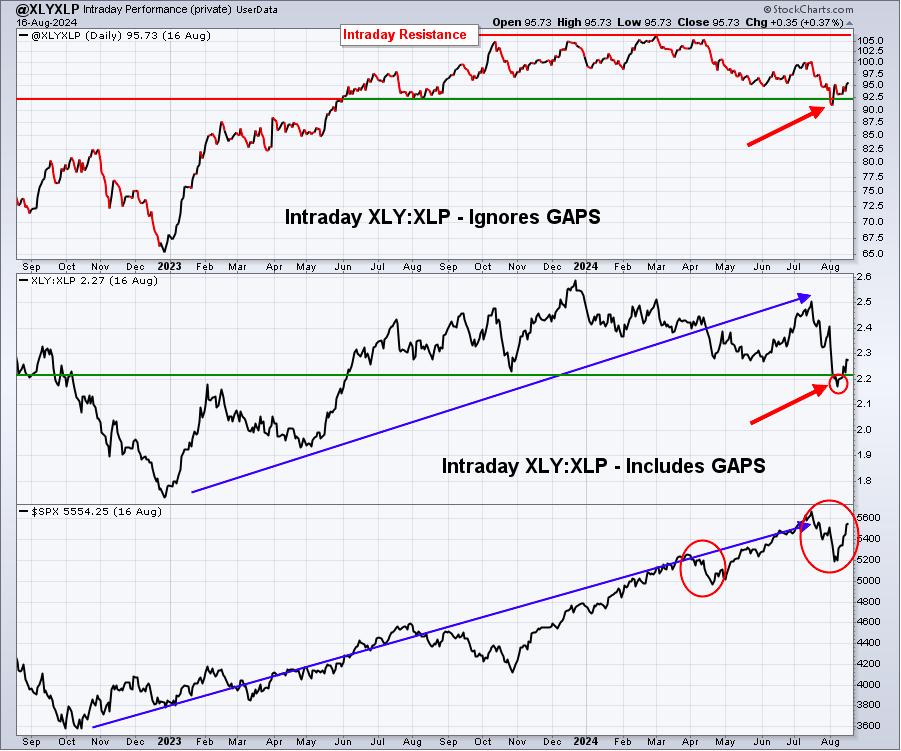
The XLY:XLP ratio is always one of my favorites, if not MY ABSOLUTE favorite sustainability ratio. I didn't like the breakdown that I highlighted last week, but this week's relative rally reclaimed prior relative support. Therefore, until this relative rotation shifts back towards staples, I'd be ok with, and probably expect, more aggression in the stock market.
Sentiment
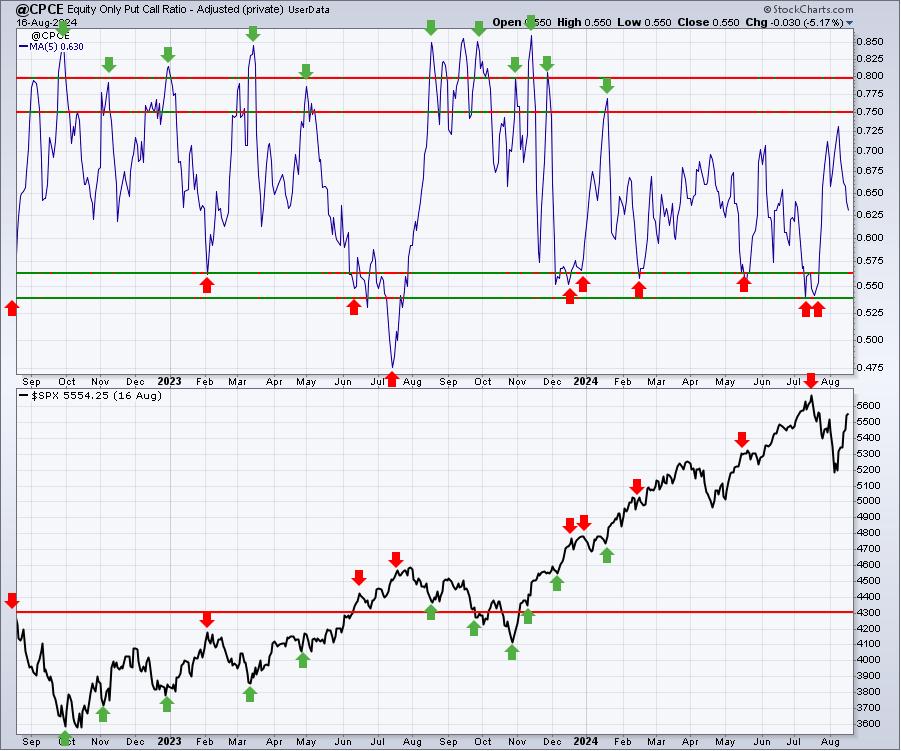
5-day SMA ($CPCE)
This is my favorite sentiment indicator and it has a long history of marking key short-term market bottoms and tops. After last week's rally, however, the 5-day SMA of the CPCE dropped back into neutral territory, providing us little in the way of short-term clues:
Volatility Index ($VIX)
The theme right now, in my opinion, is that money is NOT leaving the stock market, it's simply rotating and that is BULLISH long-term. The VIX dropping below 17 and holding there is simply one example of why I'd look for the early-August market low to hold. We still have issues ahead and we could see another market fall and another considerable spike in the VIX, but I suspect it would be accompanied by more sideways action in the stock market vs. an extended correction.
Industry Groups
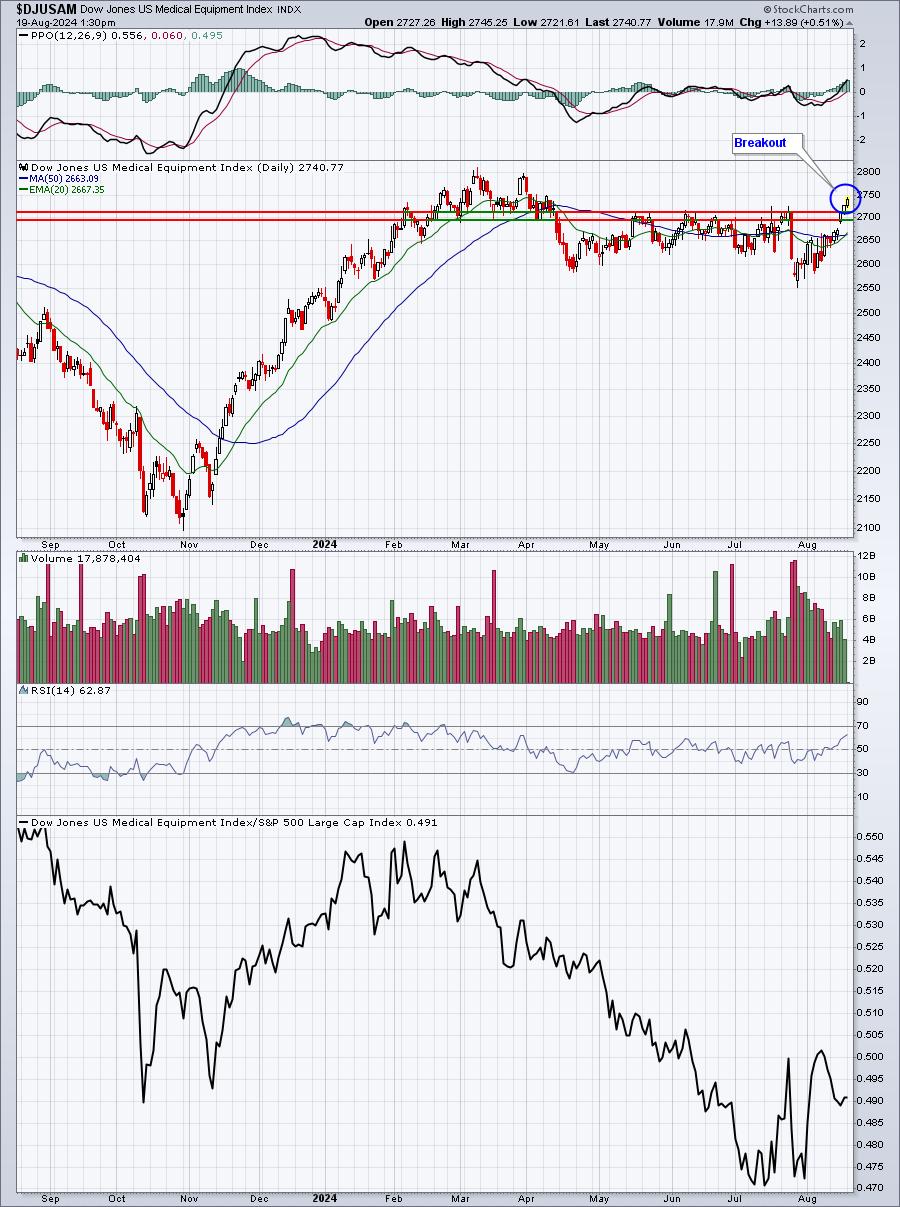
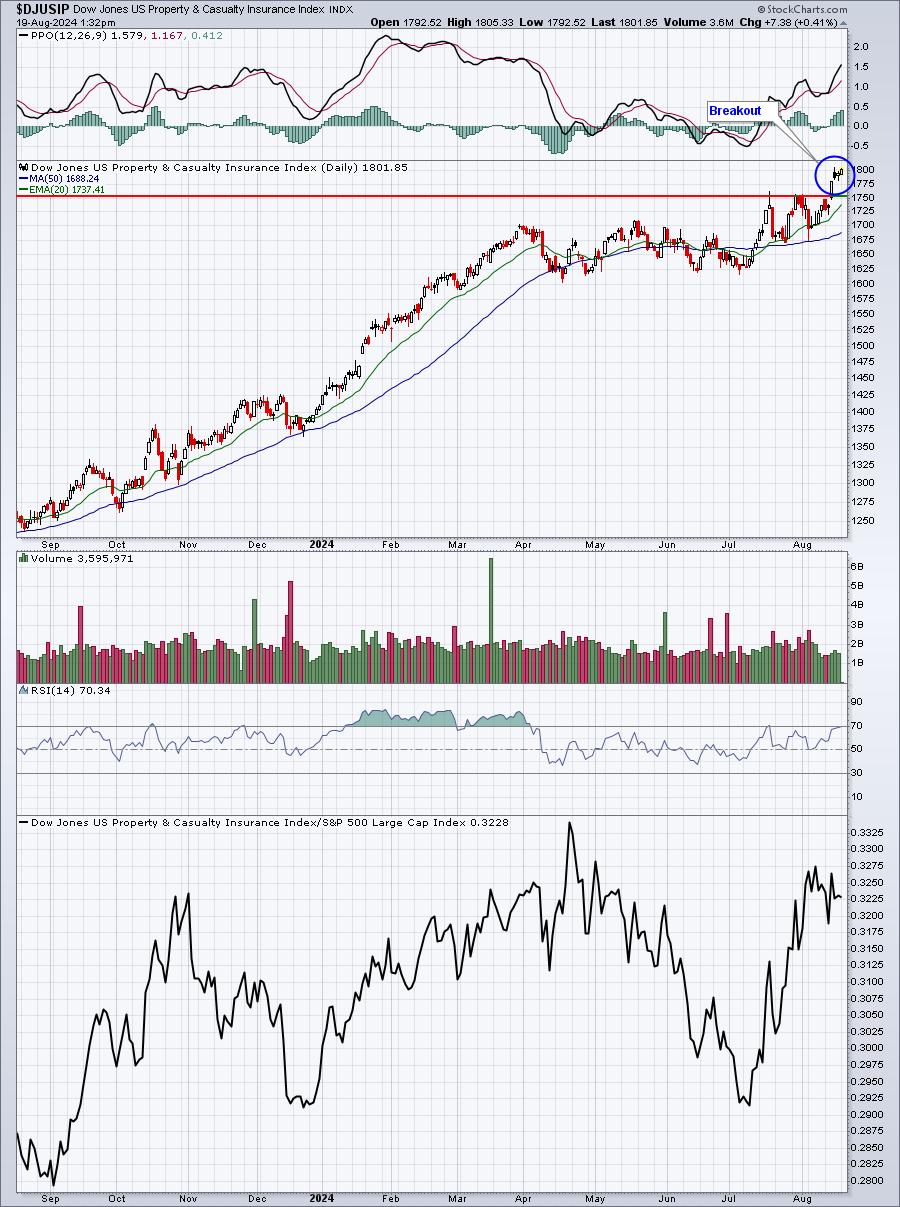
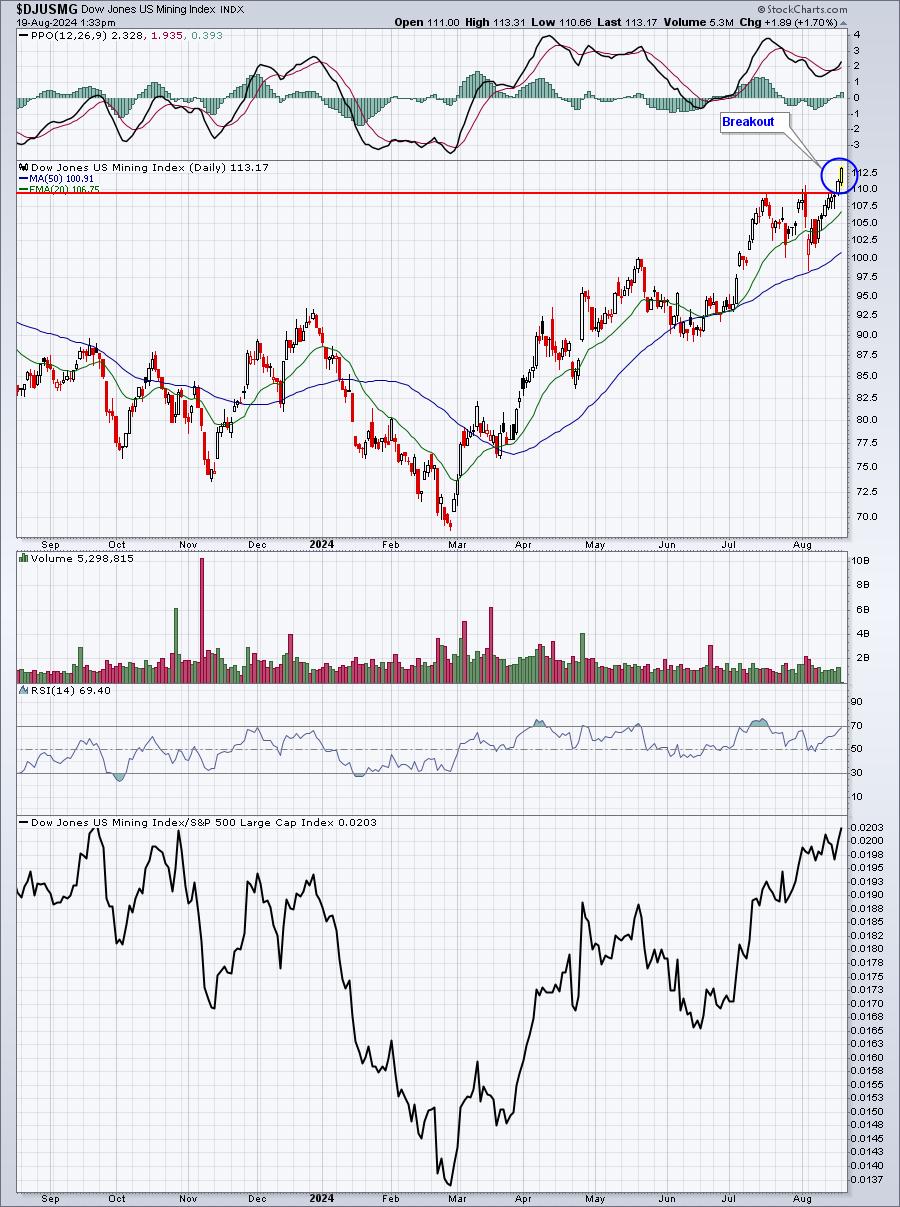
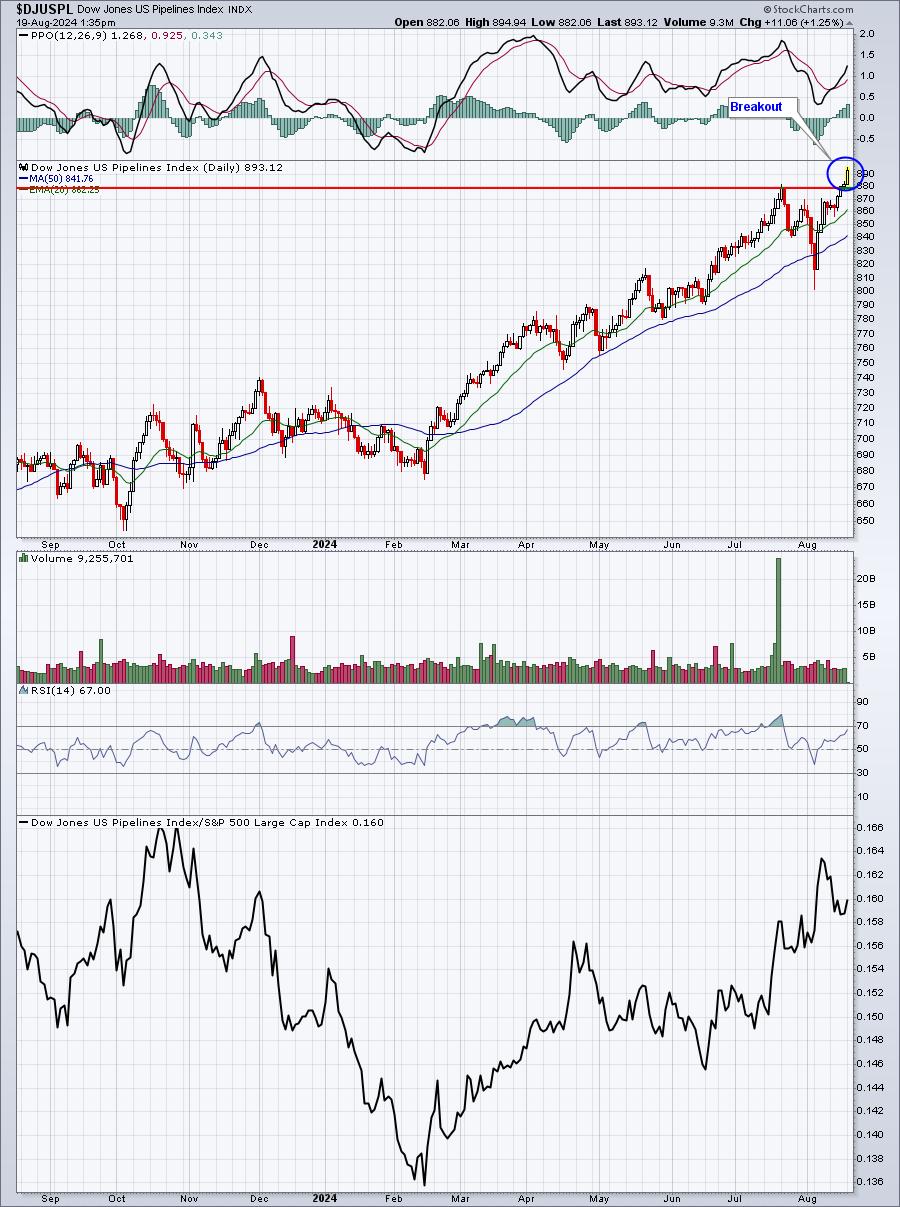
Here are 4 industry groups that are already showing absolute strength and price breakouts:
Medical Equipment:
Property & Casualty Insurance:
Mining:
Pipelines:
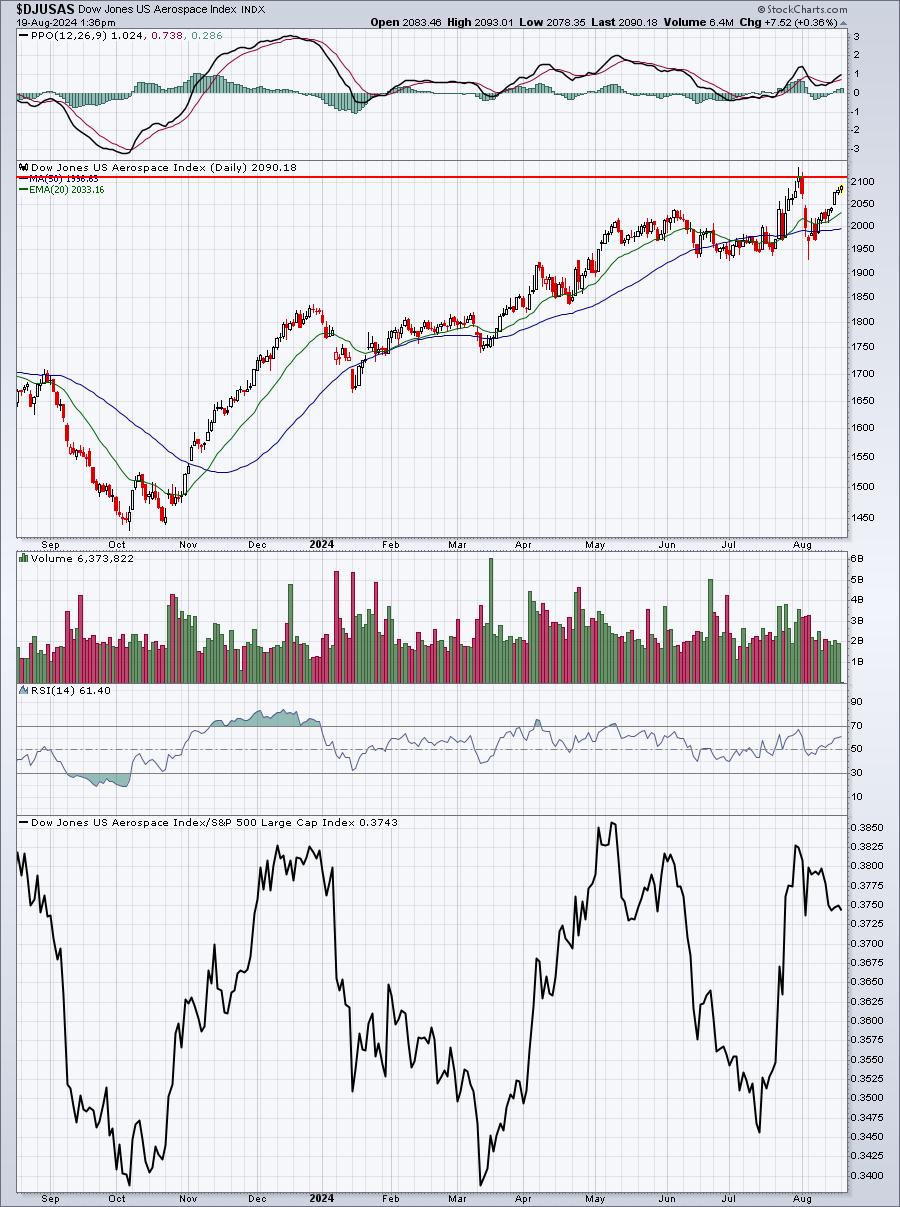
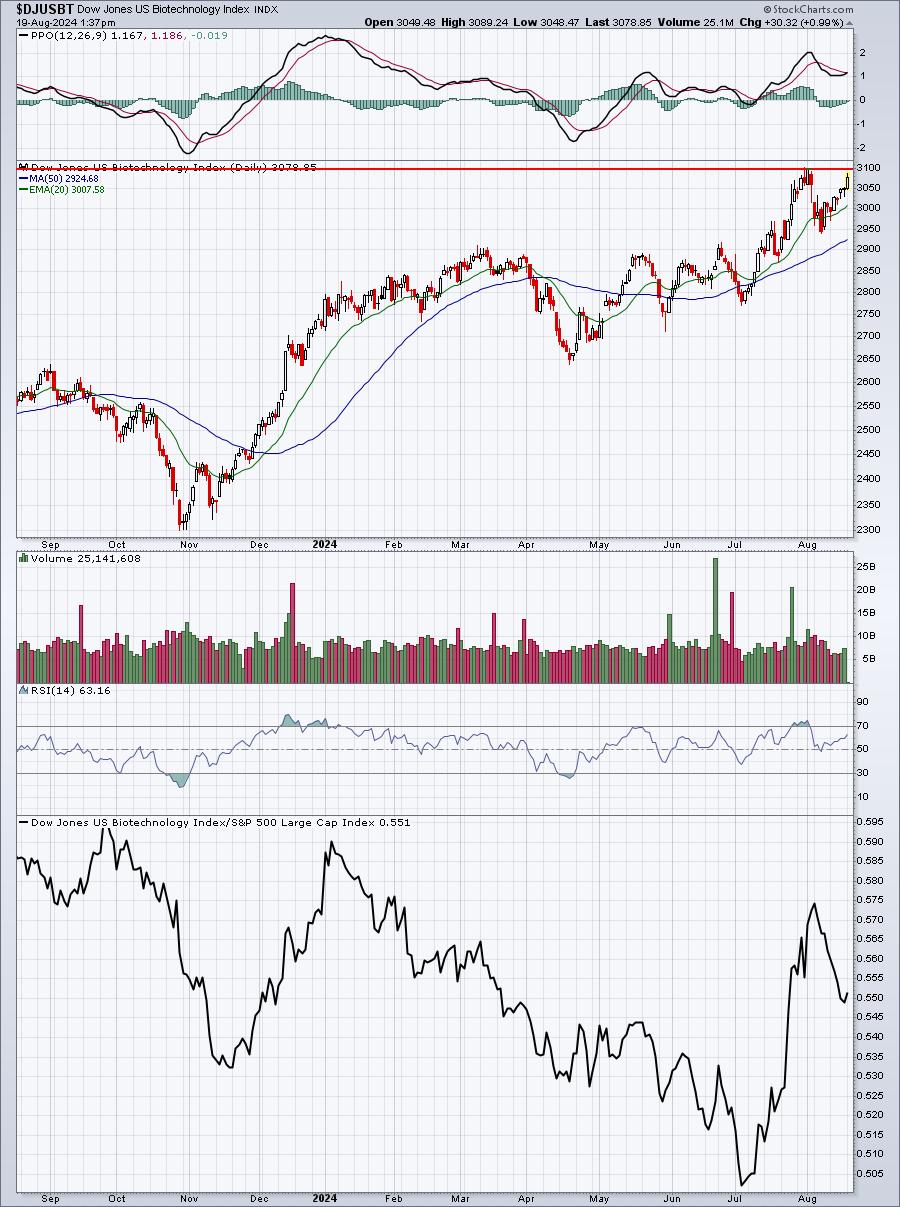
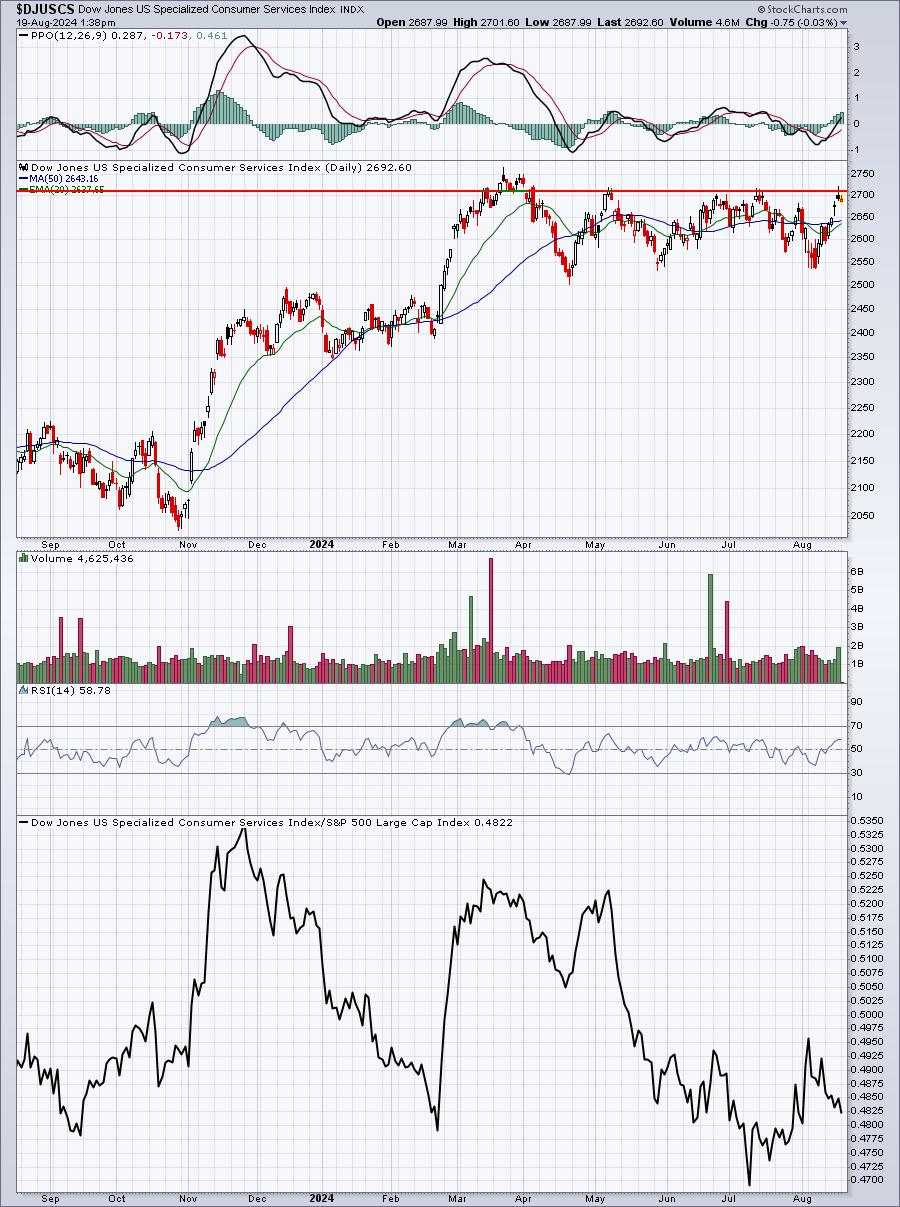
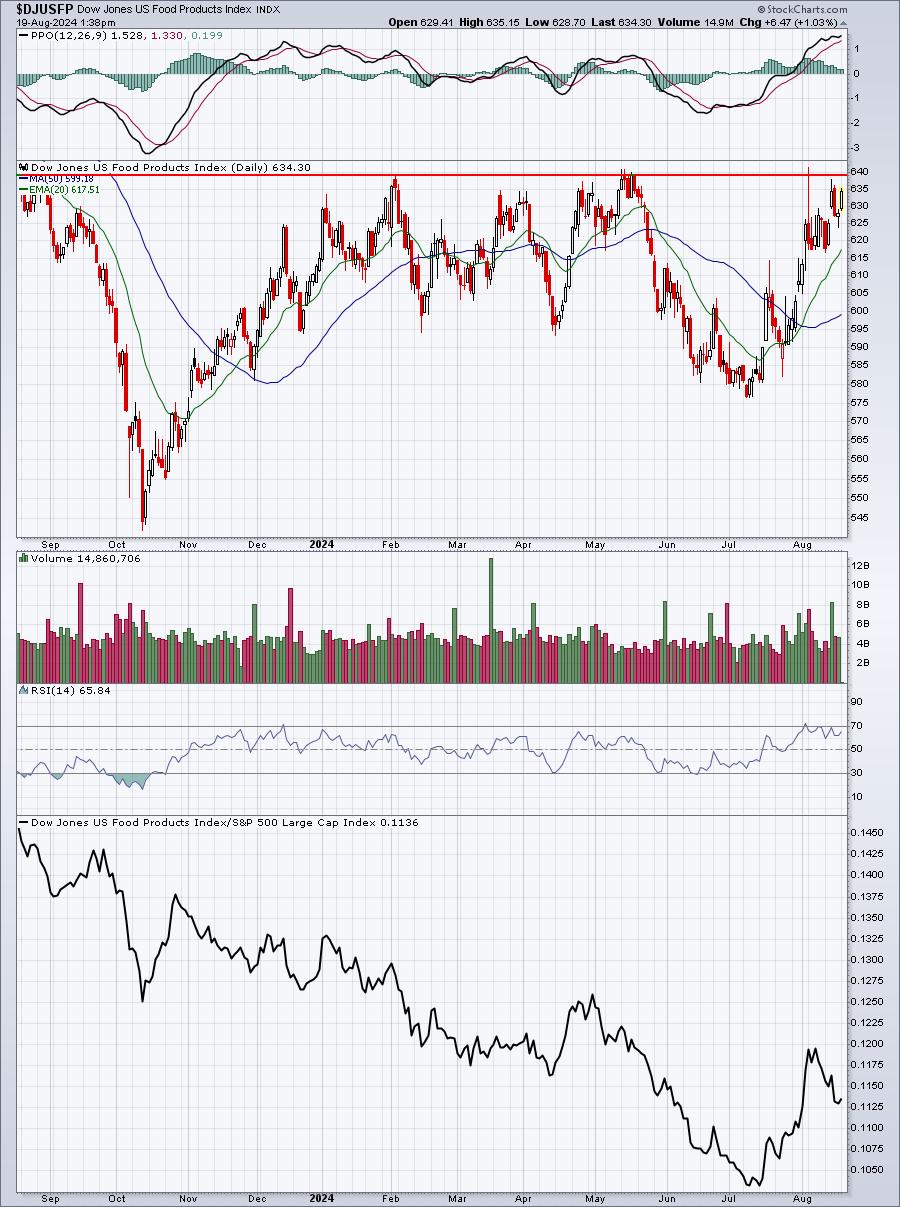
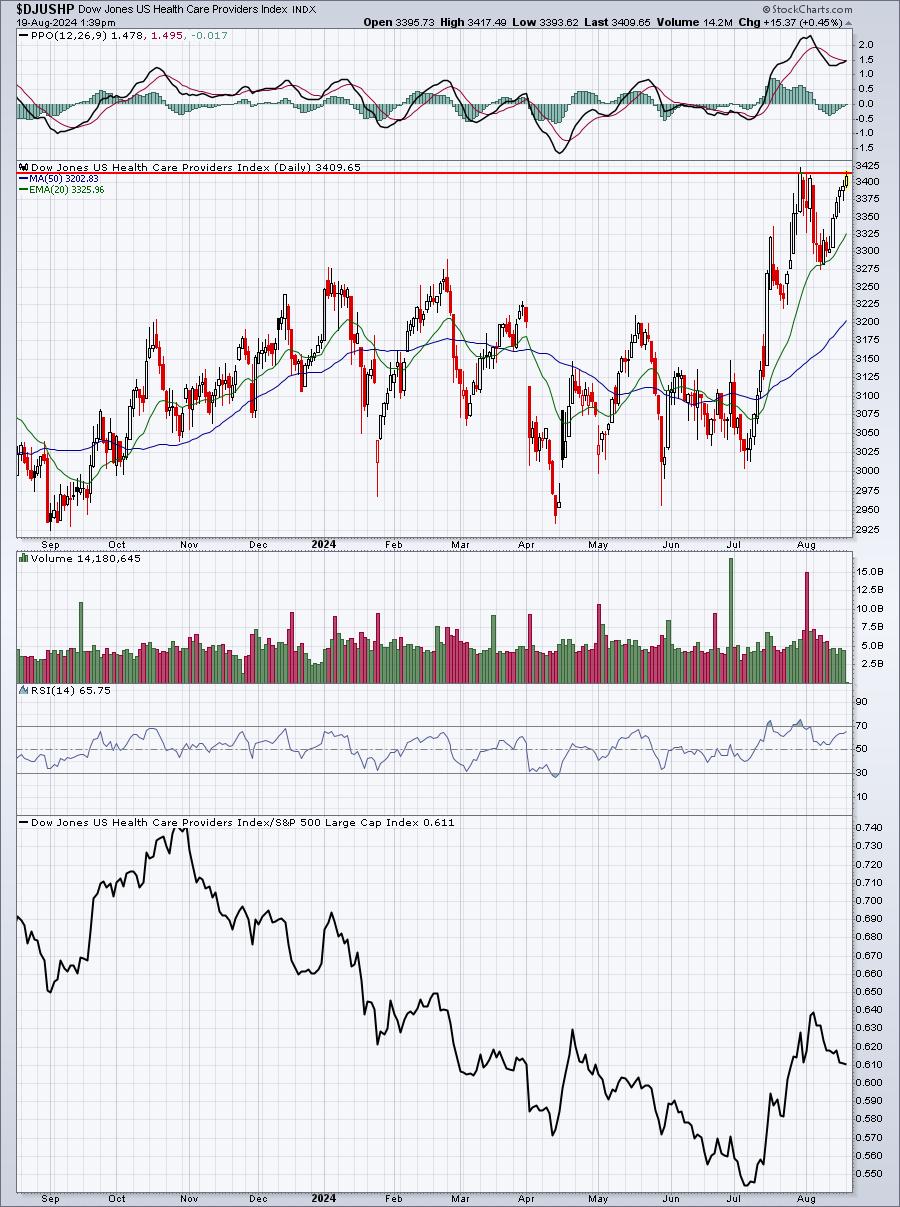
Here are 5 more industry groups where I'm watching for absolute breakouts:
Aerospace:
Biotechnology:
Specialized Consumer Services:
Food Products:
Health Care Providers:
Long-Term Trade Setup
Since beginning this Weekly Market Report in early September, I've discussed the long-term trade candidates below that I really like. Generally, these stocks have excellent long-term track records and many pay nice dividends that mostly grow every year. Only in very specific cases (exceptions) would I consider a long-term entry into a stock that has a poor or limited long-term track record:
- JPM
- BA
- FFIV
- MA
- GS
- FDX
- AAPL
- CHRW
- JBHT
- STX
- HSY
- DIS
- MSCI
- SBUX
- KRE
- ED
- AJG
- NSC
Keep in mind that our Weekly Market Reports favor those more interested in the long-term market picture. Therefore, the list of stocks above are stocks that we believe are safer (but nothing is ever 100% safe) to own with the long-term in mind. Nearly everything else we do at EarningsBeats.com favors short-term momentum trading, so I wanted to provide an explanation of what we're doing with this list.
No stocks are being added to our Long-Term Trade list this week. I was hoping to see a bit more technology weakness in order to add one of two excellent names for the long-term. We may still get our chance, but based on the recent rally, we'll need to have some patience.
Looking Ahead
Upcoming Earnings:
There is little happening this week in terms of earnings. There are still a large number of companies reporting, but few that have the potential to move the market. This is NOT a list of ALL companies reporting this week, so please be sure to check for earnings of any companies that you own or add. Any companies in BOLD represent stocks in one of our Portfolios:
- Monday: PANW ($111 billion), EL ($34 billion)
- Tuesday: LOW ($137 billion), MDT ($107 billion)
- Wednesday: TJX ($126 billion), ADI ($111 billion), TGT ($66 billion), SNOW ($43 billion)
- Thursday: INTU ($182 billion), TD ($102 billion), WDAY ($61 billion), ROST ($49 billion)
- Friday: None
Key Economic Reports:
- Monday: July leading indicators
- Tuesday: None
- Wednesday: FOMC minutes
- Thursday: Initial jobless claims, July existing home sales
- Friday: July new home sales
Historical Data
I'm a true stock market historian. I am absolutely PASSIONATE about studying stock market history to provide us more clues about likely stock market direction and potential sectors/industries/stocks to trade. While I don't use history as a primary indicator, I'm always very aware of it as a secondary indicator. I love it when history lines up with my technical signals, providing me much more confidence to make particular trades.
Below you'll find the next two weeks of historical data and tendencies across the 3 key indices that I follow most closely:
S&P 500 (since 1950)
- Aug 19: -50.68%
- Aug 20: +57.18%
- Aug 21: -10.69%
- Aug 22: -1.85%
- Aug 23: +8.94%
- Aug 24: +3.37%
- Aug 25: -20.66%
- Aug 26: -2.29%
- Aug 27: -3.57%
- Aug 28: -6.44%
- Aug 29: +32.75%
- Aug 30: -28.08%
- Aug 31: +9.88%
- Sep 1: +27.13%
NASDAQ (since 1971)
- Aug 19: -84.63%
- Aug 20: +32.35%
- Aug 21: -16.20%
- Aug 22: +31.20%
- Aug 23: +1.99%
- Aug 24: +11.28%
- Aug 25: +27.71%
- Aug 26: +31.29%
- Aug 27: +12.09%
- Aug 28: -13.87%
- Aug 29: +78.68%
- Aug 30: -43.06%
- Aug 31: +16.28%
- Sep 1: +57.15%
Russell 2000 (since 1987)
- Aug 19: -98.52%
- Aug 20: +29.43%
- Aug 21: -10.59%
- Aug 22: +21.67%
- Aug 23: -53.72%
- Aug 24: +32.69%
- Aug 25: +5.79%
- Aug 26: +2.90%
- Aug 27: +40.74%
- Aug 28: +21.92%
- Aug 29: +157.75%
- Aug 30: -78.17%
- Aug 31: +1.28%
- Sep 1: +39.71%
The S&P 500 data dates back to 1950, while the NASDAQ and Russell 2000 information date back to 1971 and 1987, respectively.
Final Thoughts
It's been a trying period for sure and we certainly understand. Is our economy weakening or is it remaining resilient? Depending on how you answer that question likely places you in the bullish or bearish camp. We can't argue with price action, however, as the recovery has been swift and impressive.
Here are a handful of things to consider as we move into another trading week:
- The Fed. Well, it's Jackson Hole time again. The meeting runs from Thursday until Saturday of this week. Fed Chief Powell will provide the only public address on Friday, August 23rd. We know what happened in 2022 when Powell's infamous "more pain ahead" speech sent stocks spiraling lower after coming off a significant bottom in June 2022 and 5-6 week market rally. If you like the potential of market fireworks, put this date on your calendar.
- VIX. Based on the VIX sustained drop back below 17, I'm saying the August low is THE low for 2024.
- Growth vs. Value. The seasonal growth trade runs from May through August, but we do know that historically the stock market does not perform well from the August 15th close through the end of September. It doesn't mean that growth NEVER performs well in late August or September, it simply stacks the odds against it.
- Retailers. Many of the biggest names in the stock market have now reported their latest quarterly results and we'll need to await mid-October to start the earnings cycle all over again. Retailers, though, do tend to report later in the quarter and we'll see a few of the big names in that area reporting this week, including LOW, EL, TJX, TGT, ROST, and BJ.
- Technical Resistance. U.S. equities have been impressive during the rally off the August 5th low. We've seen multiple key resistance levels cleared, but the biggest one of all is the all-time highs across our indices. I see these levels being cleared in Q4, but continue to expect the balance of Q3 to be choppy, with periods of market strength and weakness.
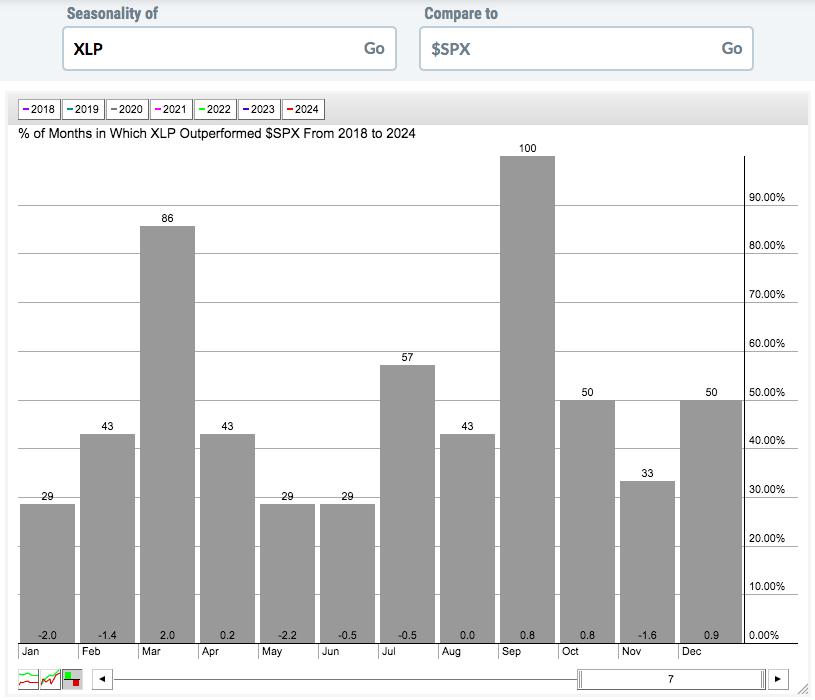
- History. It's not at all unusual to see defensive- and value-oriented stocks outperform in August and, especially, September. For example, consumer staples (XLP) have outperformed the S&P 500 in each of the last 7 years:
Feedback
If you'd like to share your thoughts on our Weekly Market Report, positive or negative, you can reach us at "[email protected]".
Happy trading!
Tom