
EB Weekly Market Report - Tuesday, September 3, 2024
ChartLists Updated
I updated the following ChartLists over the weekend and they should all be available for your viewing/downloading pleasure on our website:
- Strong Earnings (SECL)
- Strong Future Earnings (SFECL)
- Raised Guidance (RGCL)
- Short Squeeze (SSCL)
- Bullish Trifecta (BTCL)
- All Upcoming Earnings
- Upcoming Earnings - Relative Strength
Weekly Market Recap
Major Indices
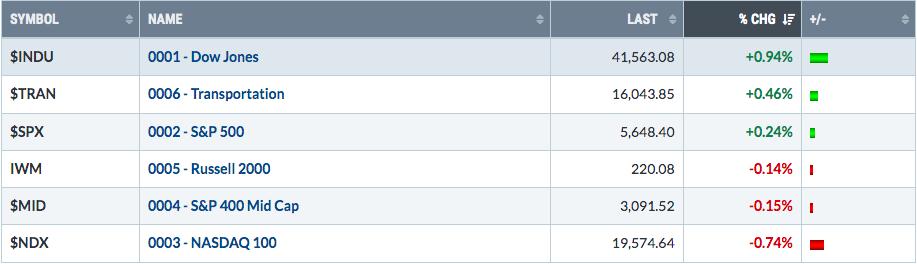
It was a back-and-forth kind of week with the Dow Jones ultimately leading the action and establishing a new all-time record high as August came to a close and the overall market prepped for the historically-volatile month of September.
Sectors
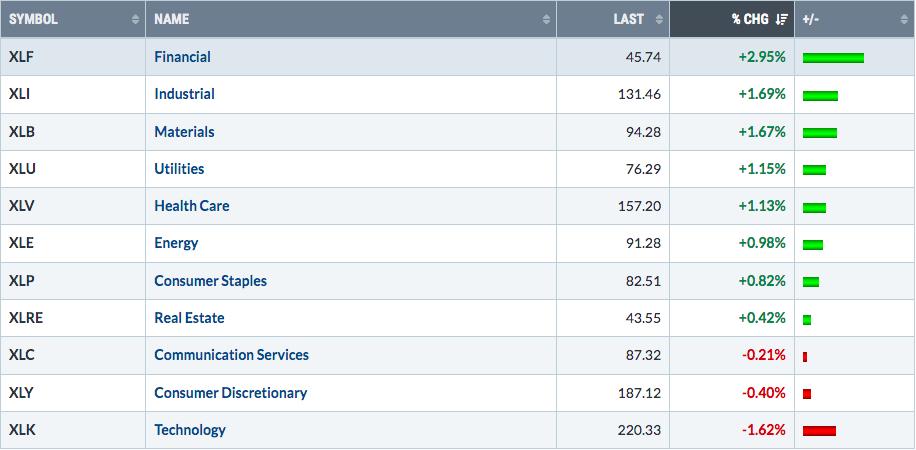
I continue to favor the areas that provided leadership last week - financials (XLF) and industrials (XLI) - in particular. The 3 aggressive sectors (XLK, XLY, XLC) once again lagged and that's been the case since June/July, especially with the technology area.
Top 10 Industries Last Week
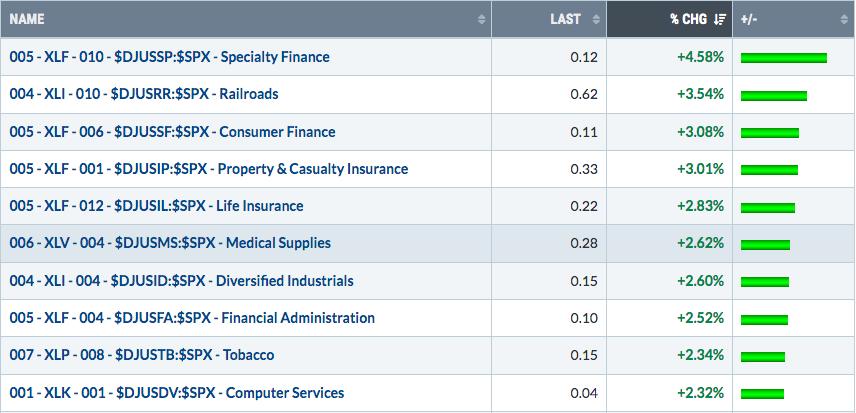
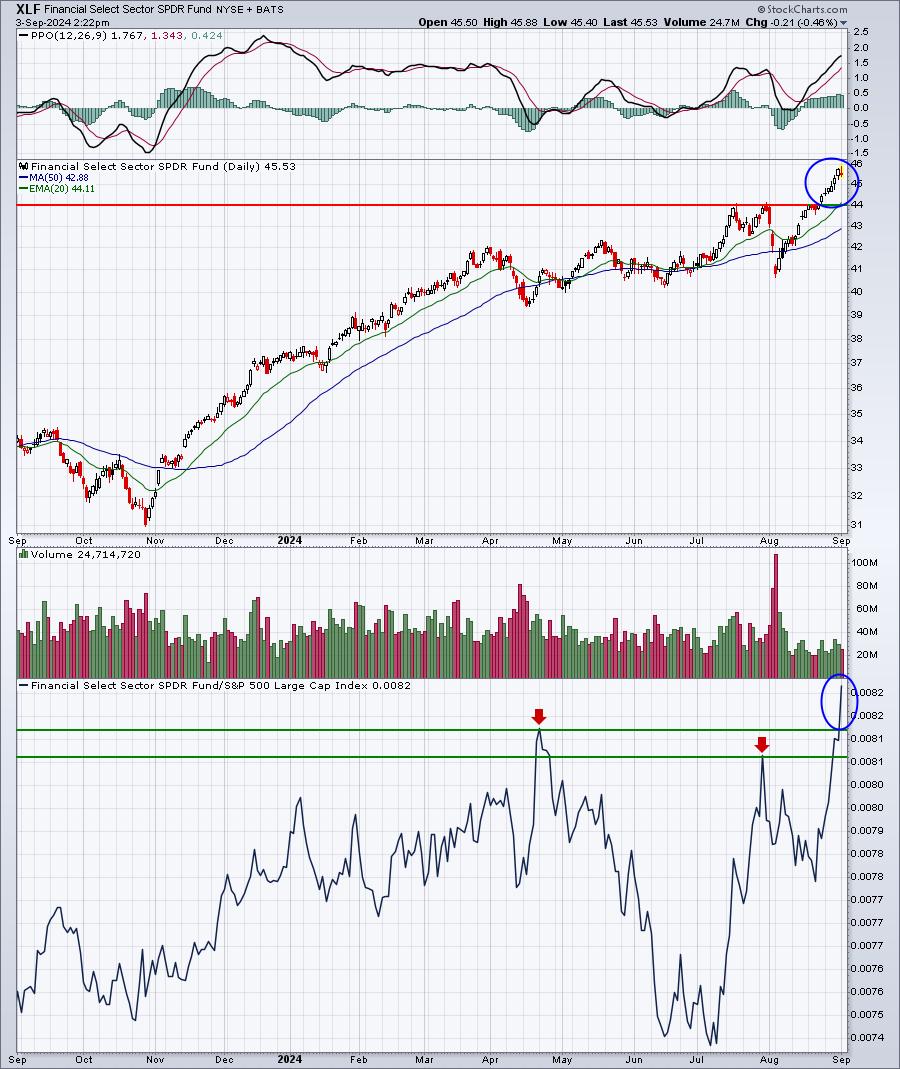
4 of the top 5 industry groups and 5 of the top 10 industry groups came from financials. The XLF has not only broken out on an absolute basis, it's clear to me that Wall Street favors the group relative to other sectors:
Bottom 10 Industries Last Week
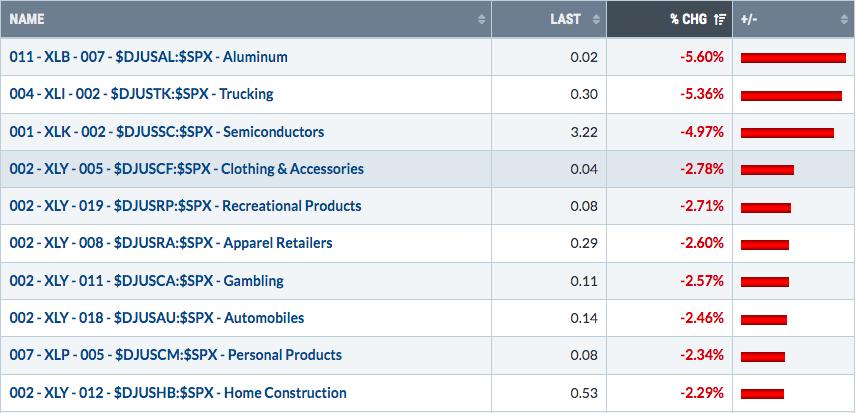
It's never good to see semiconductors ($DJUSSC) perform poorly and they're only adding to the misery today with another 8.2% drop:
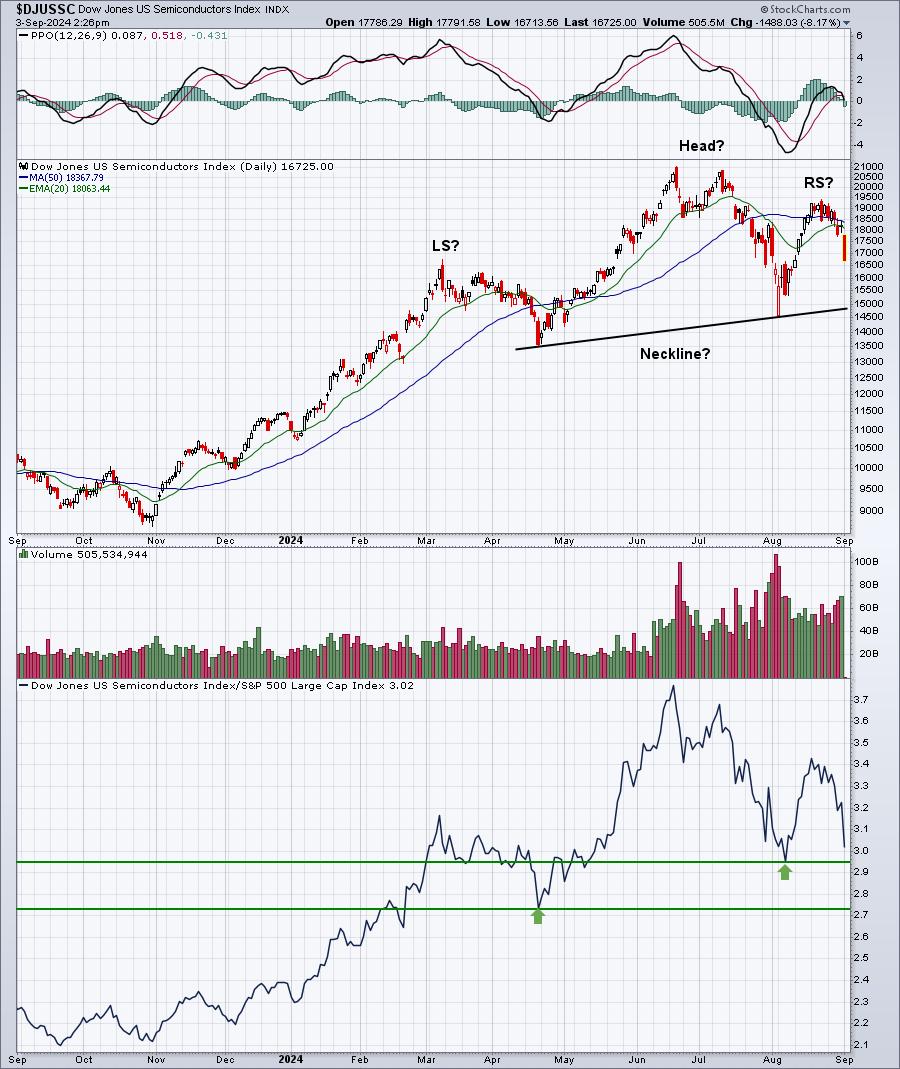
Listen, semiconductors have been out of favor since June 22nd, the day I wrote about a significant top. I don't know how long this period of weakness/consolidation lasts, but I do know that the upside on the S&P 500 remains limited while this industry group struggles.
Many technicians will begin talking about a head & shoulders pattern based on the above chart. I don't believe this is a head & shoulders topping pattern. I'm generally not convinced of this bearish pattern when the neckline is sloping HIGHER. In this case, we could easily take out support from the August 5th low without clearing the support from April. If the DJUSSC moves back down close to the April low, I'll be looking for entry into this aggressive industry, not an exit. Like I said, I believed this group topped on June 22nd. A 33% move lower to test the April low is the time to buy, not sell, in my opinion.
I expect we'll see a very strong Q4 from this group, especially beginning in November.
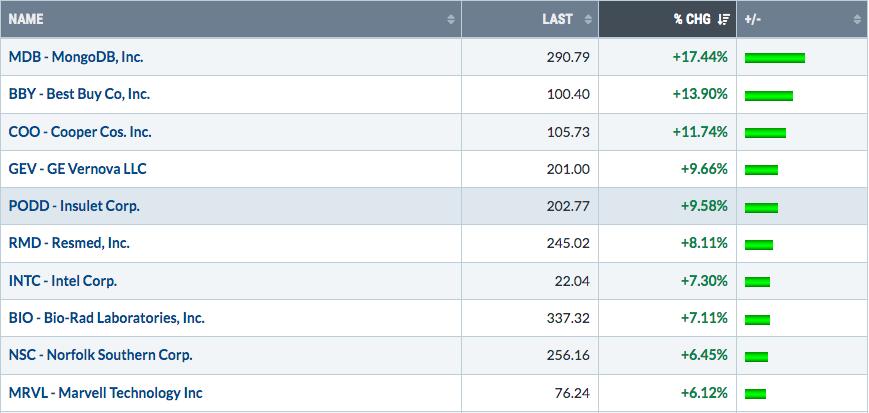
Top 10 Stocks - S&P 500/NASDAQ 100
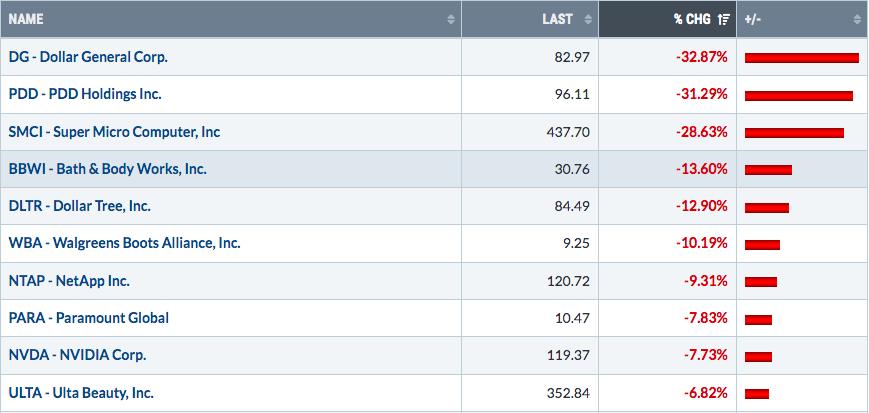
Bottom 10 Stocks - S&P 500/NASDAQ 100
Big Picture
Here's an update of the Big Picture, 100-year chart of the S&P 500:
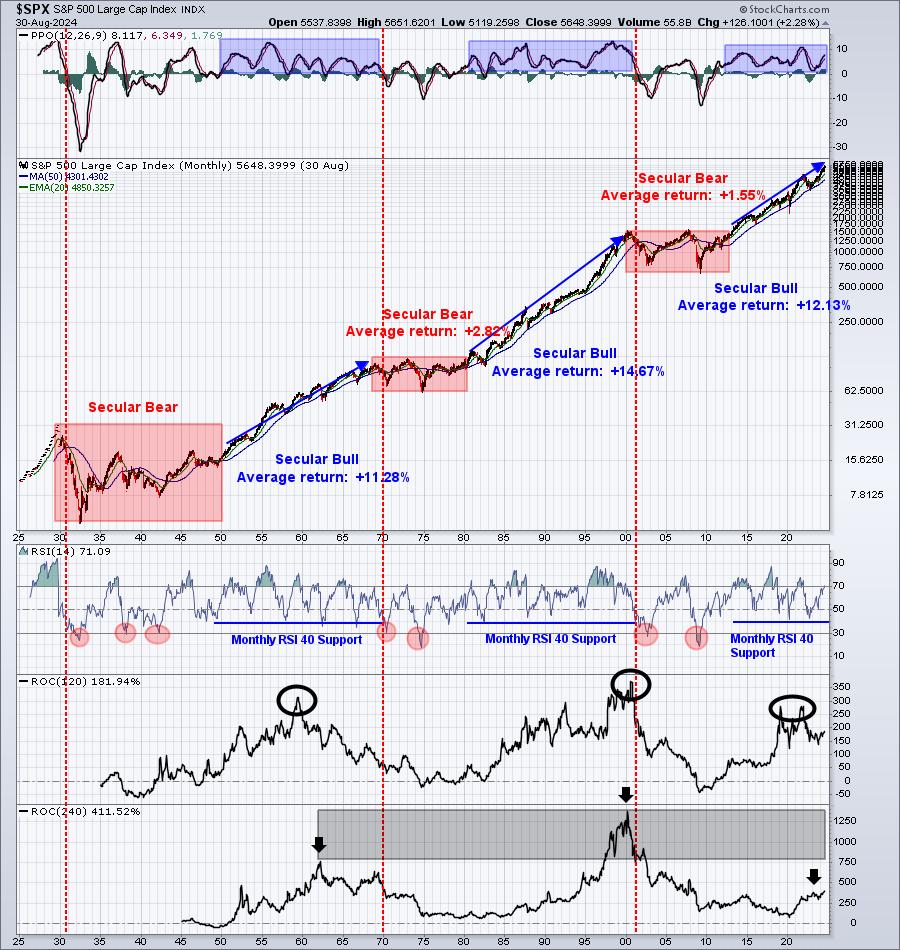
On days like today, I like to spend some time checking out this Big Picture chart and not get caught up in the fear, instead realizing that further selling is very likely to result in another long-term buying opportunity.
Rotation/Intermarket Analysis
Here's the latest look at our key intraday ratios as we follow where the money is traveling on an INTRADAY basis (ignoring gaps):
QQQ:SPY
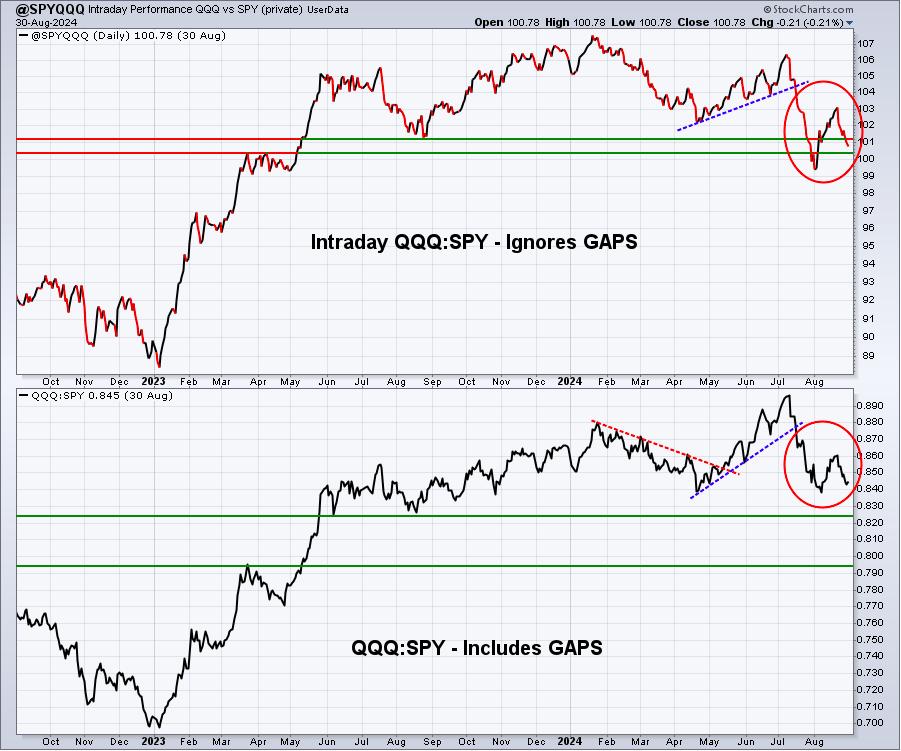
The top panel shows that the QQQ vs. SPY ratio continues to decline. Also, note that this sustainability ratio has fallen well below the April low, indicative of the rotation from growth to value INTRADAY for the past several months. If we include gaps, the April support is still holding. Interesting. This tells me that while we may have seen a few months where gaps helped growth stocks, but during the trading, rotation had begun.
Also, this chart is actually calculated QQQ:SPY, despite its "@SPYQQQ" name.
IWM:QQQ
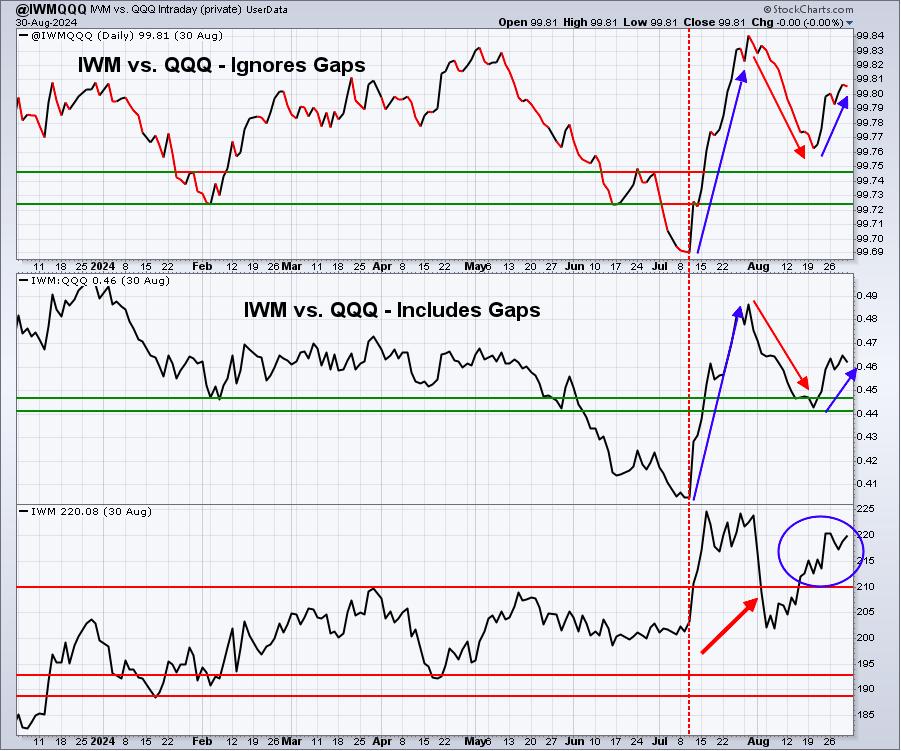
Volatility here is quite obvious, though the intraday action of the IWM:QQQ points to more accumulation of small caps.
XLY:XLP
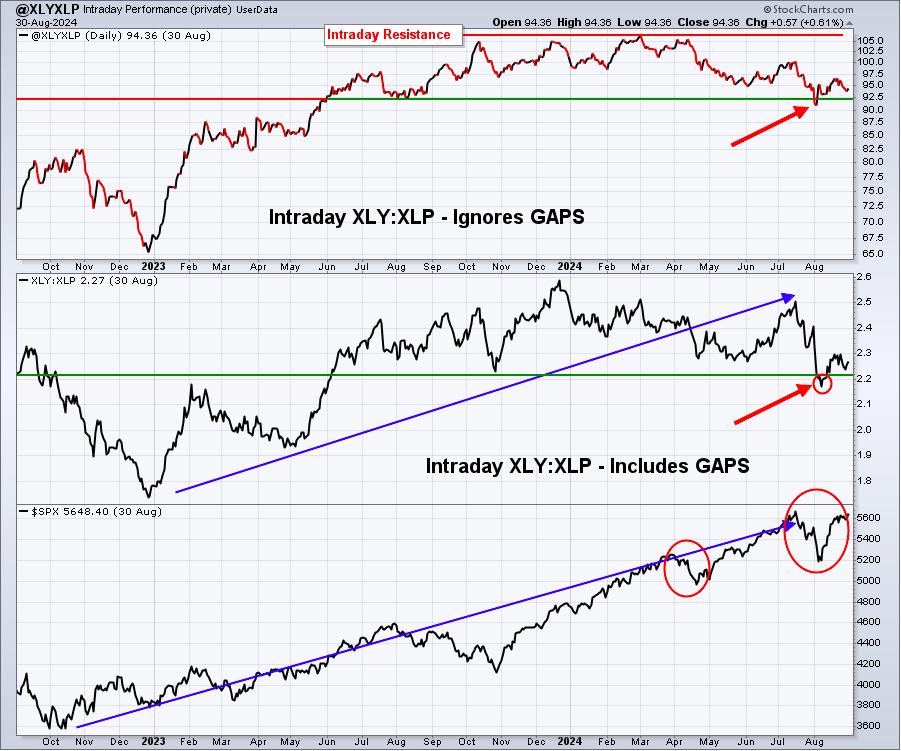
I'm still seeing mostly neutral action based on the intraday XLY:XLP rotation. Yes, we're well off the highs, but I would view the 89.00-92.50 range as the key longer-term relative support level to watch.
Sentiment
5-day SMA ($CPCE)
This is my favorite sentiment indicator and it has a long history of marking key SHORT-TERM market bottoms and tops. Currently, the 5-day SMA of the CPCE is in neutral territory, after recently providing us clues of a short-term top:
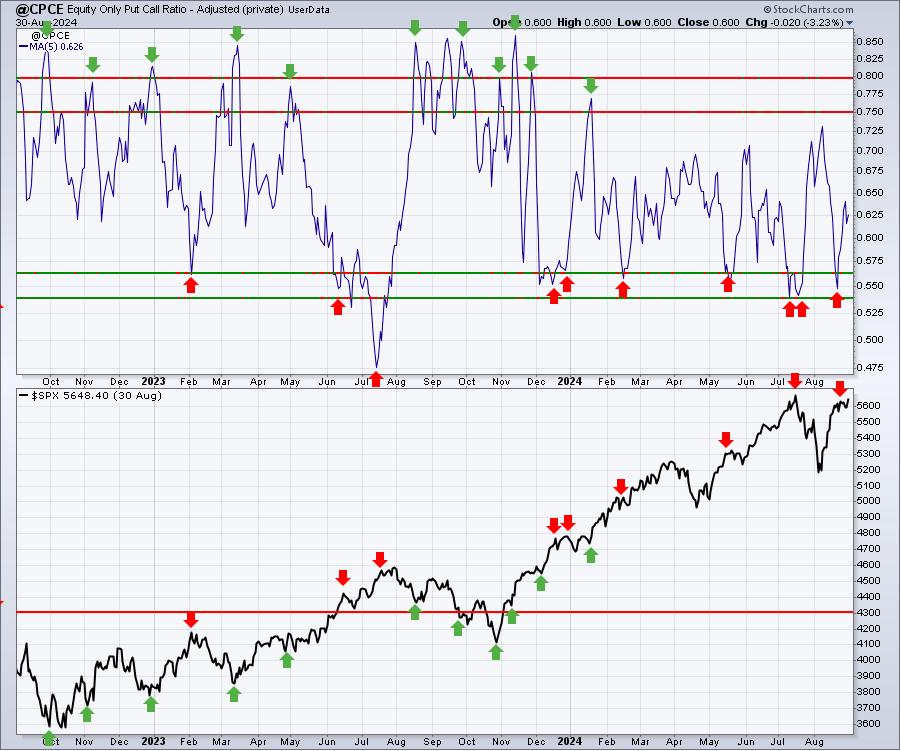
Readings of this 5-day SMA between .54 and .56 has historically preceded periods of stock market weakness, so multiple readings in this range over the past 2 months is noteworthy.
253-day SMA ($CPCE)
This is my longer-term sentiment indicator to help provide long-term clues about the market. When this 1-year moving average is rising, stocks are generally in trouble and quite risky. But when the opposite occurs (falling 253-day SMA), you typically want to be long stocks. This is where we stand now:
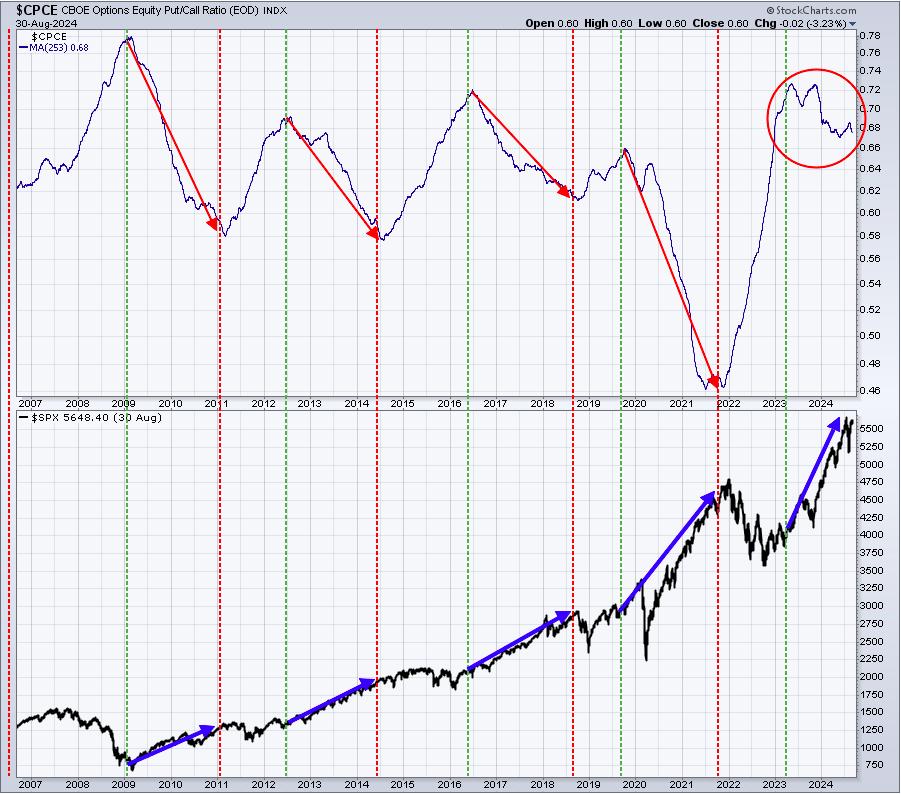
Study the chart and see if you come up with a different conclusion. The reason this makes sense is that once the 1-year moving average reaches key highs and begins to roll over, everyone who is bearish has essentially sold. You simply run out of sellers when sentiment reaches extreme equity only put call levels. The blue directional lines in the bottom panel highlight what happens to the S&P 500 as the 253-day SMA of the CPCE moves lower to "reset" with much more complacency. When we ultimately reach the bottom and beginning turn higher, that'll be the time to be very careful longer-term. I don't see that occurring for quite some time.
Long-Term Trade Setup
Since beginning this Weekly Market Report nearly one year ago, I've discussed the long-term trade candidates below that I really like. Generally, these stocks have excellent long-term track records and many pay nice dividends that mostly grow every year. Only in very specific cases (exceptions) would I consider a long-term entry into a stock that has a poor or limited long-term track record and/or pays no dividends. Below is a quick recap of what I saw on each stock as of the close on Friday, August 23, 2024:
- JPM - just broke out again, looks poised for further gains into year end
- BA - hasn't performed well, but continues to trade and hold in a 160-180 support area
- FFIV - trending higher, I expect more strength into year end
- MA - further shift into financials will help continue this uptrend
- GS - love the absolute and relative strength here
- FDX - easily beating its rival UPS, expect further upside
- AAPL - has recovered nicely from its August swoon
- CHRW - huge earnings-related gap in August has this one on the move
- JBHT - broke to 4-month high on Friday
- STX - primarily trending higher since adding, now bouncing back from August selloff
- HSY - still consolidating, but AD line improving - sign of move higher?
- DIS - remains mired in downtrend off March/April high, big support just beneath 180
- MSCI - rallying strongly off April low
- SBUX - new CEO (former Chipotle CEO) lifted the stock nearly two weeks ago
- KRE - trending higher and poised for growth as upcoming rate cuts take effect
- ED - consistent utility stock near 52-week high
- AJG - reversing candle on Friday with neg divergence, could see short-term decline, still love long-term
- NSC - trying to kickstart a trend change in what's been mostly sideways action for last 3-4 years
Keep in mind that our Weekly Market Reports favor those more interested in the long-term market picture. Therefore, the list of stocks above are stocks that we believe are safer (but nothing is ever 100% safe) to own with the long-term in mind. Nearly everything else we do at EarningsBeats.com favors short-term momentum trading, so I wanted to provide an explanation of what we're doing with this list.
Because September is historically a very poor month in terms of stock performance, it should make sense that it's also a great time to be considering opportunities. While I could see more market struggles ahead for perhaps the next couple weeks to couple months, adding solid long-term performers is something we should consider. I'll add one this week in Constellation Brands (STZ). It's having a great day today, so waiting for a bit of weakness might not be a bad idea. It is currently trading nearly 10% lower than its double top from July 2023 and March 2024, though. Also, STZ was trading at this same level at the beginning of the 2022 cyclical bear market, so it's been unchanged for nearly 3 years. Anyhow, check out this long-term chart on STZ:
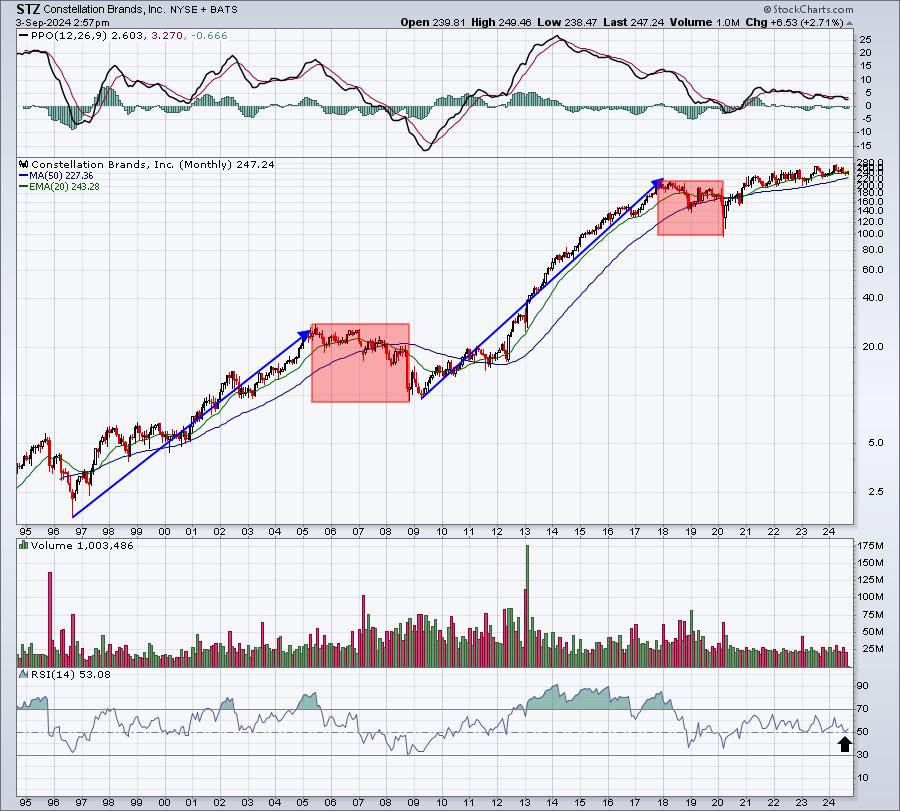
This chart goes back to 1994 and illustrates the capital appreciation potential for STZ. But this is also a solid dividend payer, yielding 1.68% currently. The dividend was raised 13% last year and 11% the year before, and has more than tripled in the last 9 years, so STZ does a great job of increasing its dividend to help income investors overcome inflation.
Looking Ahead
Upcoming Earnings:
There is little happening this week in terms of earnings. There are still a large number of companies reporting, but few that have the potential to move the market. This is NOT a list of ALL companies reporting this week, so please be sure to check for earnings of any companies that you own or add. Any companies in BOLD represent stocks in one of our Portfolios:
- Monday: None
- Tuesday: ZS ($30 billion)
- Wednesday: CPRT ($51 billion)
- Thursday: AVGO ($758 billion)
- Friday: None
Key Economic Reports:
- Monday: None
- Tuesday: August PMI manufacturing, August ISM manufacturing, July construction spending
- Wednesday: July factory orders, beige book
- Thursday: August ADP employment report, initial jobless claims, Q2 productivity & costs, August PMI composite, August ISM services,
- Friday: August nonfarm payrolls
Historical Data
I'm a true stock market historian. I am absolutely PASSIONATE about studying stock market history to provide us more clues about likely stock market direction and potential sectors/industries/stocks to trade. While I don't use history as a primary indicator, I'm always very aware of it as a secondary indicator. I love it when history lines up with my technical signals, providing me much more confidence to make particular trades.
Below you'll find the next two weeks of historical data and tendencies across the 3 key indices that I follow most closely:
S&P 500 (since 1950)
- Sep 2: +62.42%
- Sep 3: +4.54%
- Sep 4: -40.02%
- Sep 5: -17.78%
- Sep 6: +26.84%
- Sep 7: -8.58%
- Sep 8: +8.58%
- Sep 9: -47.86%
- Sep 10: -23.57%
- Sep 11: +17.60%
- Sep 12: +11.56%
- Sep 13: +12.29%
- Sep 14: +35.62%
- Sep 15: -17.96%
NASDAQ (since 1971)
- Sep 2: +75.21%
- Sep 3: -64.43%
- Sep 4: -50.80%
- Sep 5: -53.75%
- Sep 6: +12.35%
- Sep 7: +38.60%
- Sep 8: -6.25%
- Sep 9: -15.68%
- Sep 10: -8.44%
- Sep 11: +52.98%
- Sep 12: -7.28%
- Sep 13: -2.76%
- Sep 14: +65.92%
- Sep 15: -50.69%
Russell 2000 (since 1987)
- Sep 2: +94.68%
- Sep 3: -60.70%
- Sep 4: +38.95%
- Sep 5: -60.38%
- Sep 6: +5.47%
- Sep 7: +31.72%
- Sep 8: +50.64%
- Sep 9: -27.30%
- Sep 10: +2.52%
- Sep 11: +85.94%
- Sep 12: +55.89%
- Sep 13: +22.12%
- Sep 14: +58.36%
- Sep 15: -35.64%
The S&P 500 data dates back to 1950, while the NASDAQ and Russell 2000 information date back to 1971 and 1987, respectively.
Final Thoughts
Last week, I was looking for quick transport to late October. Nothing has changed. I really don't know what September holds in store. I know it can be a very difficult month, especially the 2nd half of September. But, as you can see, the first day of September has gotten off to a very rocky start. There are a few things that I'm thinking about in terms of September trading:
- ZERO Leverage. I might be on the long side in September, especially the small caps, but I won't trade with leverage. We know the September tendencies, which are for stocks to typically move lower. Why take the added risk of owning leveraged ETFs?
- Volatility ($VIX). Last week, I discussed how when the VIX moves higher in September, it sometimes SOARS. Today alone, we see the VIX up 34% to move back above 20. That should certainly be a reminder of what we'll need to navigate over the next few to several weeks. ANY TIME the VIX moves and closes above 20, it notifies us that prices could turn much lower very quickly. Therefore, be very careful of the stocks you own and also keep stops in play. Stocks can always be re-entered later this month or in October.
- Growth vs. Value. In each of the last 6 years, large cap growth stocks (IWF) have trailed large cap value stocks (IWD). The stock market has tendencies and the 3rd month of EVERY calendar quarter can be difficult for growth stocks, but September is the one that really stands out.
- Technical Outlook - Short-Term. To repeat what I said last week....."While I do expect to see much better relative performance out of small and mid caps, I'm still not sold on the fact that we won't have at least one more drop in September/October that provides a scare to folks. It's likely to be something to do with the economy. Also, we still have the Presidential Election coming and that could drop a few bombs. The goal for me remains to try to keep my capital intact as best I can until the more seasonally-favorable Q4 period arrives."
- Technical Outlook - Long-Term. I still LOVE the long-term and am VERY BULLISH. I can only give you my opinion based on all of my experience and research, but I would not allow fear to drive me out of the market. Listen, we know September CAN be a difficult month, but please don't forget that Q4 is the absolute BEST time to be invested in U.S. equities. If you exit U.S. stocks in September and you're timing is bad, it can be a painful lesson for long-term investors. Remember, if you're in it for the long-term and you don't want to be swayed by day-to-day or week-to-week volatility, then DON'T. Simply understand that the stock market goes up and down from time to time, but it goes UP way more often. I see nothing on the horizon that tells me we're in for months or years of stock market weakness. When I see that, you'll be the first to know.
Feedback
If you'd like to share your thoughts on our Weekly Market Report, positive or negative, you can reach us at "[email protected]".
Happy trading!
Tom