
EB Weekly Market Report - Monday, September 9, 2024
ChartLists Updated
I updated the following ChartLists over the weekend and they are all available for viewing/downloading on our website:
- Strong Earnings (SECL)
- Strong Future Earnings (SFECL)
- Raised Guidance (RGCL)
- Bullish Trifecta (BTCL)
There are very few key earnings reports that will be released ahead of the start of Q3 earnings season, so we will not be providing our Upcoming Earnings ChartLists for the next 4-5 weeks.
Weekly Market Recap
Major Indices
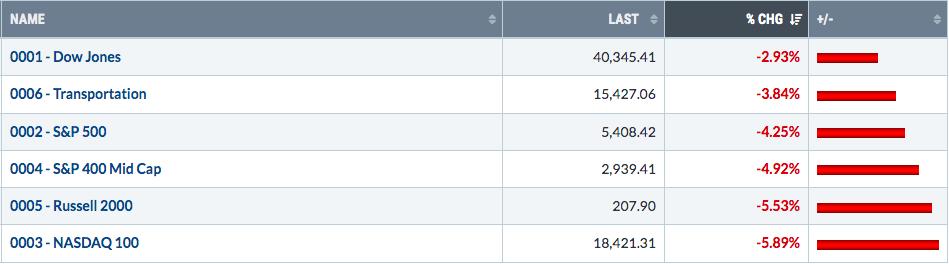
September's first week was not a nice one for the bulls. All of our key indices took a big hit, but the most intense selling was among the aggressive NASDAQ 100:
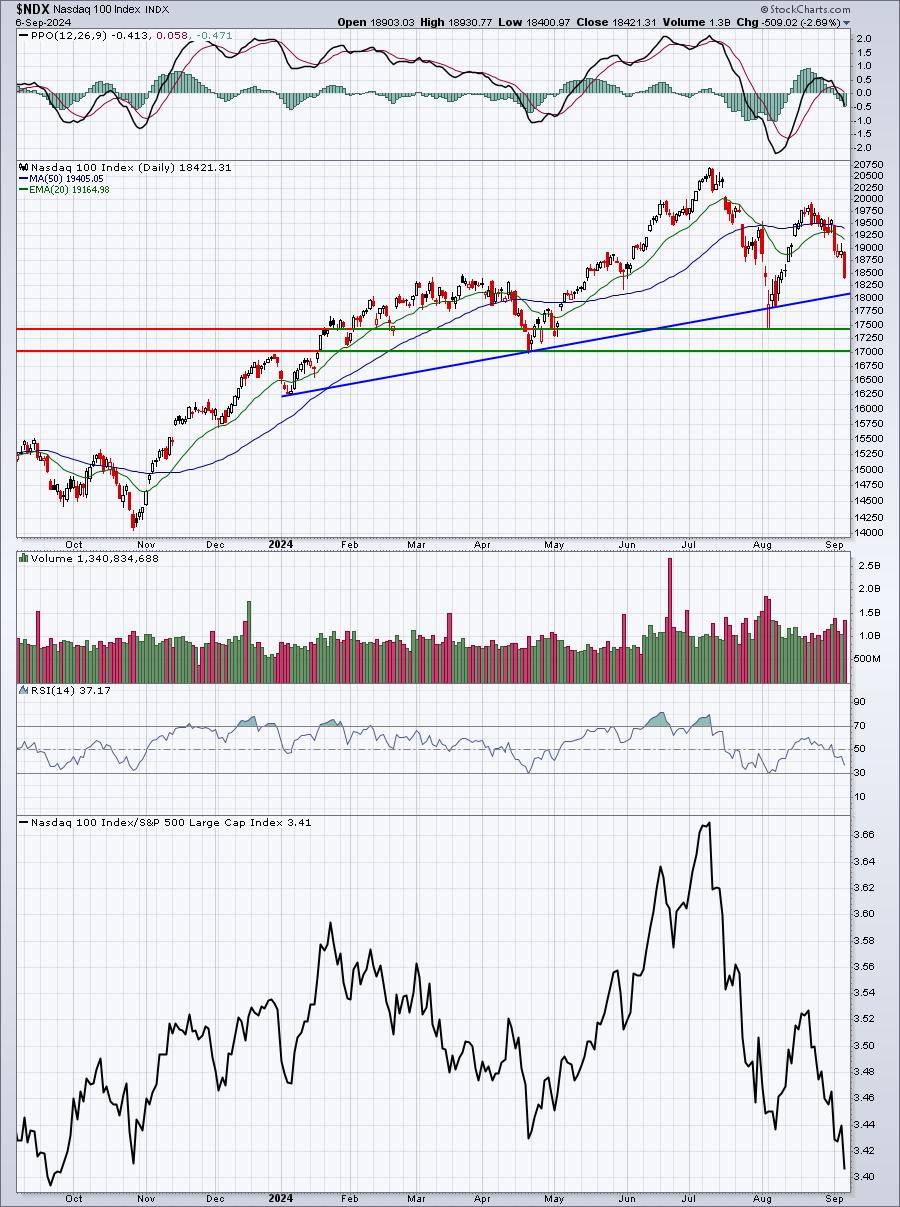
I've highlighted the trendline support that connects all of the key CLOSES since the beginning of the year. That currently intersects near the 18000 level. If trendline support is lost, I've provided the two critical levels of price support to watch, if action in September deteriorates further.
Sectors
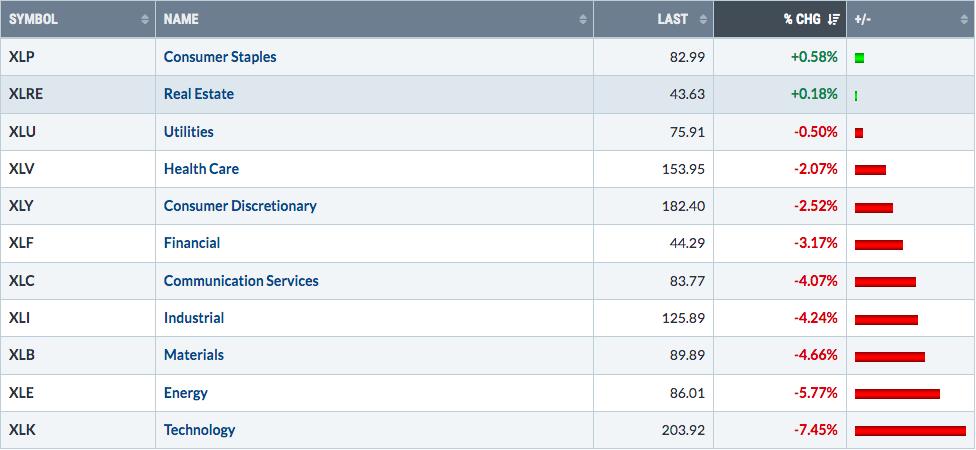
Defensive sectors led the action last week, but remember, defensive sectors nearly always lead during market declines as the more-aggressive sectors tend to see much more selling/profit taking on a relative basis. Even financials (XLF) and industrials (XLI), which had previously avoided much of the weakness and traded higher, began showing absolute weakness last week.
Top 10 Industries Last Week
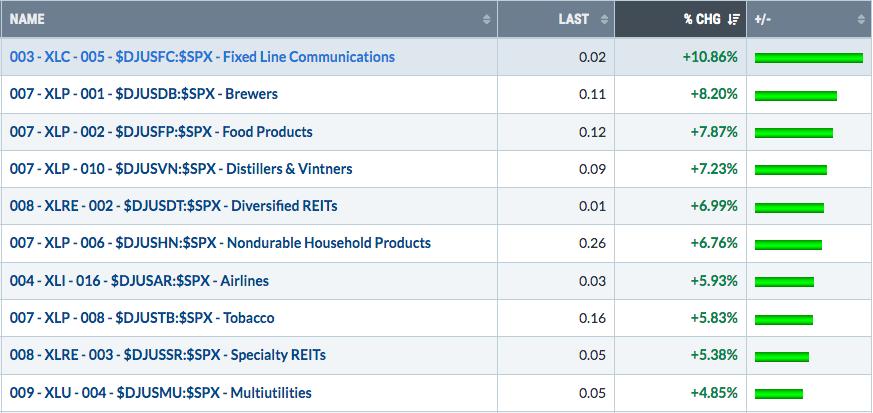
Many defensive- and value-oriented industry groups led last week, which is perfectly normal when growth stocks are trashed like they were. 5 of the 10 best-performing industry groups came from the consumer staples sector. Other than airlines ($DJUSAR), I'd consider all of them to be more value-oriented/dividend payers.
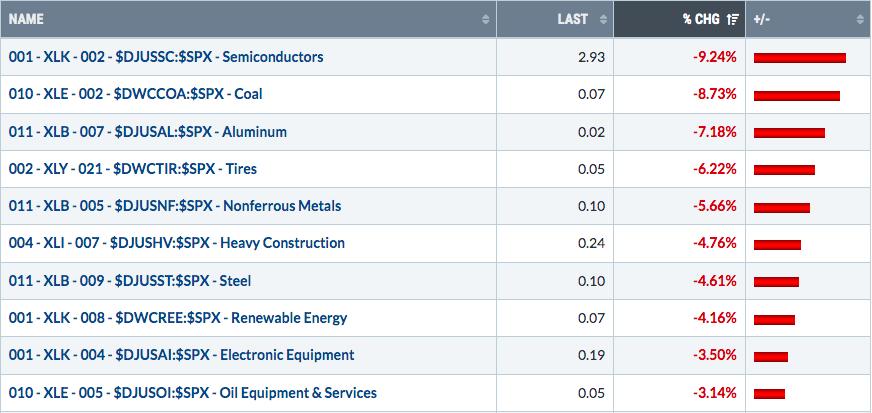
Bottom 10 Industries Last Week
Heavy construction ($DJUSHV) has been consolidating sideways and in rectangular fashion since topping in May:
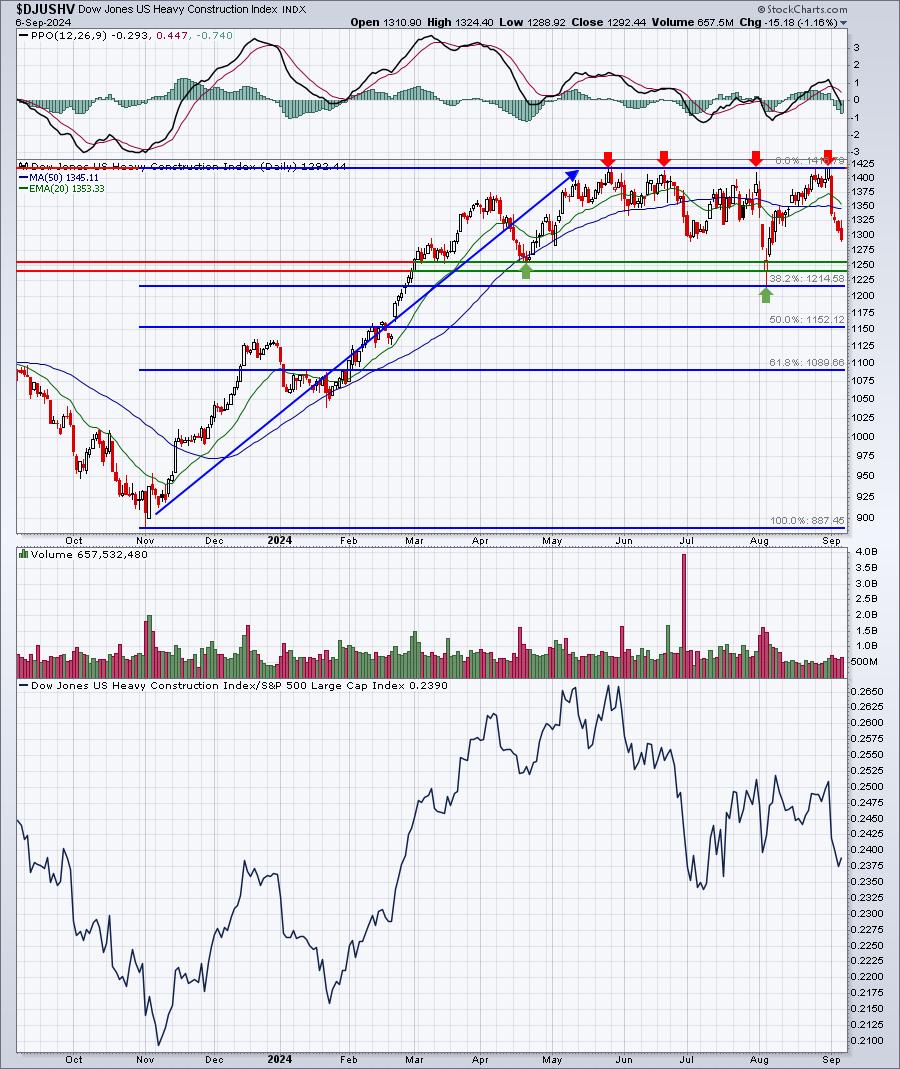
The August low tested the initial Fibonacci retracement level of 38.2% almost perfectly. Currently, I view the DJUSHV in a very bullish pattern - uptrend followed by a lengthy consolidation, or basing, pattern. We could see a head fake on a quick breakdown, but I'd mostly be looking for this group to hold support and eventually work its way back up to another breakout, likely in Q4.
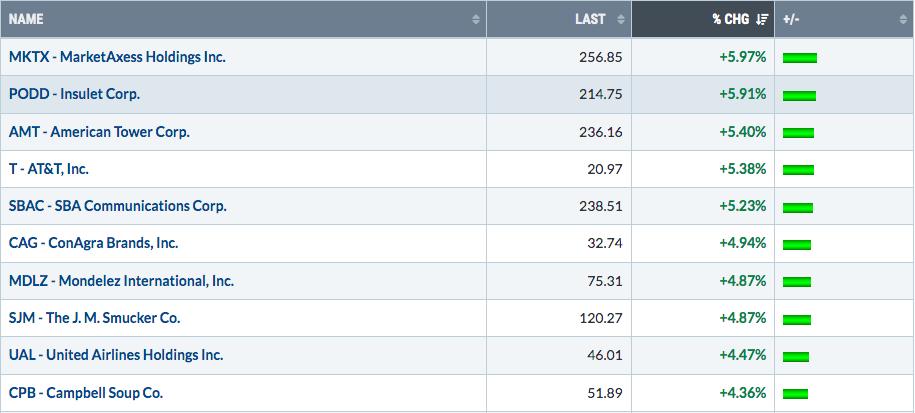
Top 10 Stocks - S&P 500/NASDAQ 100
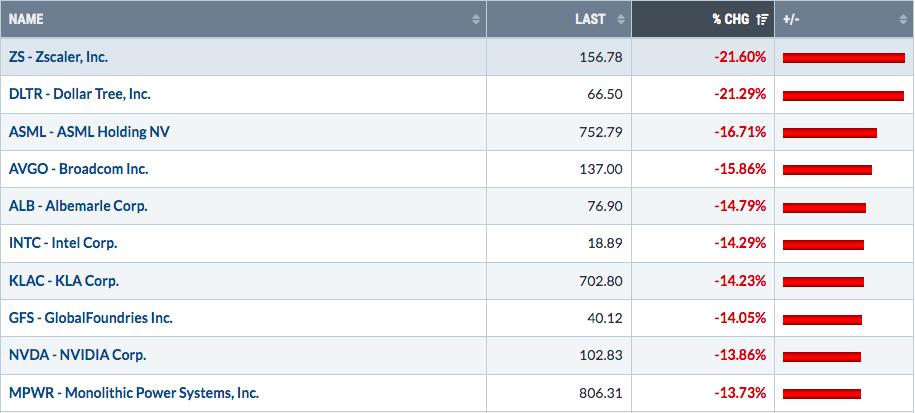
Bottom 10 Stocks - S&P 500/NASDAQ 100
Big Picture
Here's an update of the Big Picture, 100-year chart of the S&P 500:
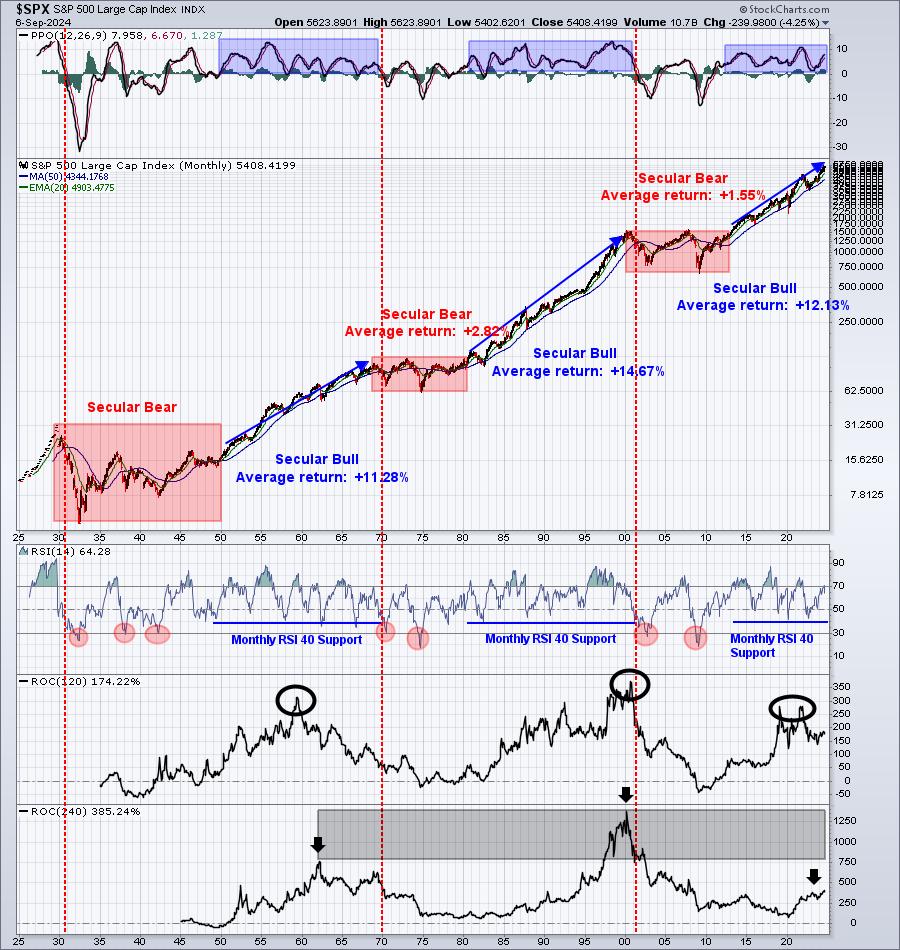
It was a very rough week last week, but this Big Picture chart looks no different than it did last week, drowning out the noise of daily and weekly volatility.
Rotation/Intermarket Analysis
Here's the latest look at our key intraday ratios as we follow where the money is traveling on an INTRADAY basis (ignoring gaps):
QQQ:SPY
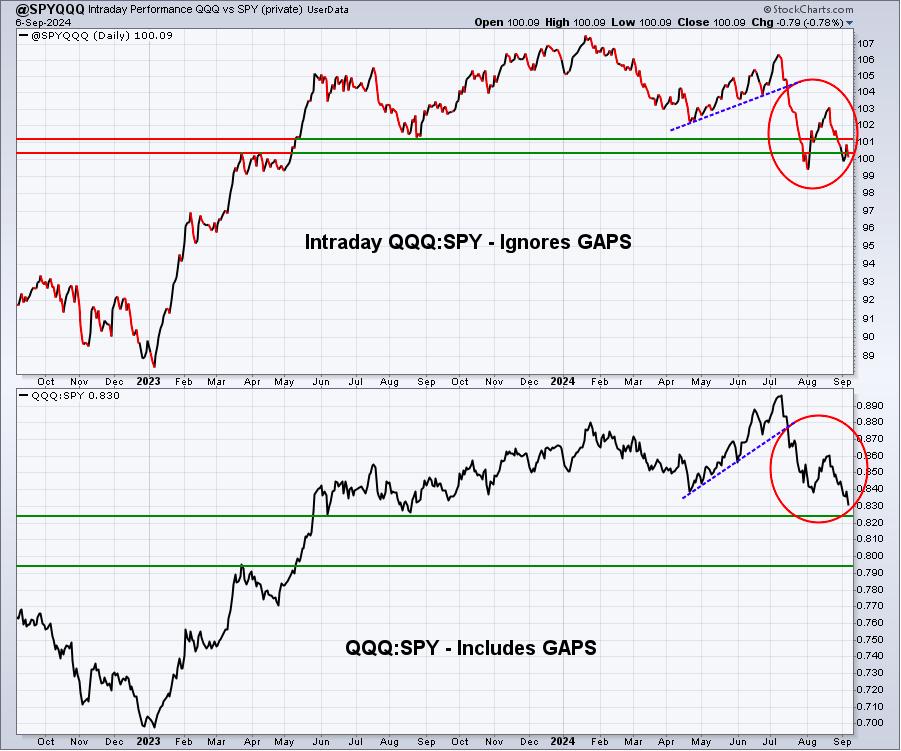
I view the recent action on this chart to be bullish for equities - maybe not immediately, but if this pattern continues into October, I'd grow much more bullish about a bottom being in place. What I'm looking at specifically is the fact that the QQQ vs. SPY is performing worse on an "including gaps" basis. Check out the April through early-July pattern on both charts above. Notice how the "including gaps" chart was doing so much better than the "ignoring gaps" chart? That's a subtle suggestion to me that QQQ prices were being manipulated higher via gaps and the actual intraday action saw more rotation. I view this type of behavior as more bearish as it appears the opening gaps were allowing Wall Street to exit at higher prices, resulting in more intraday selling (relative distribution). Now we see the opposite. Gaps carrying the QQQ much lower, while we've yet to see a new low on an intraday basis. Is this a sign of accumulation? It's certainly a strong possibility.
Remember, this chart is actually calculated QQQ:SPY, despite its "@SPYQQQ" name.
IWM:QQQ
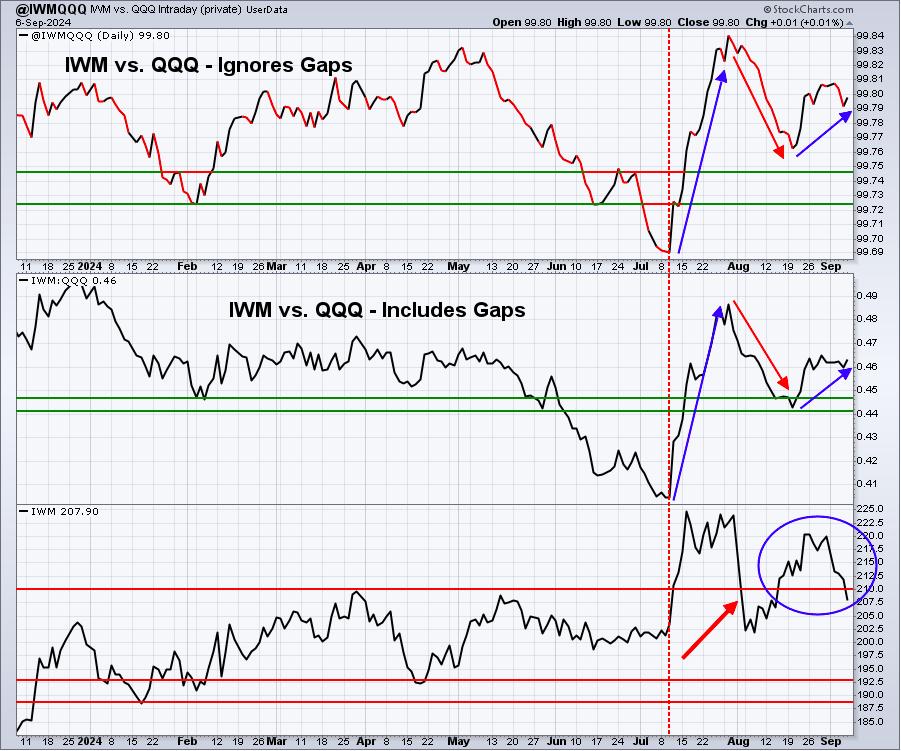
IWM is falling on an absolute basis, while rising vs. the QQQ on a relative basis. Bullish rotation into small caps does not appear to be over.
XLY:XLP
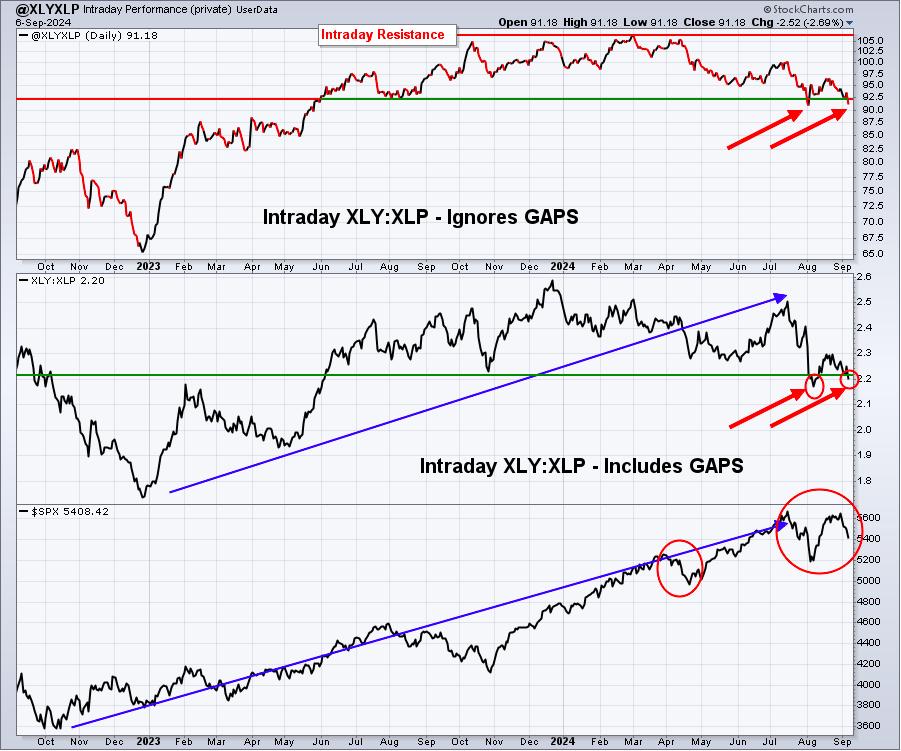
I mentioned last week that I'm watching the 89.00-92.50 relative support range on the XLY:XLP relative chart that ignores gaps. The recent downtrend in relative performance is not bullish, but let's continue to watch to see if, on an intraday basis, the XLY:XLP ratio can hold this support zone. Failure to do so would be a more bearish signal, no doubt.
Sentiment
5-day SMA ($CPCE)
This is my favorite sentiment indicator and it has a long history of marking key SHORT-TERM market bottoms and tops. Currently, the 5-day SMA of the CPCE is moving higher, indicative of growing bearishness among traders, and is moving into an area where we typically see short-term market bottoms form:
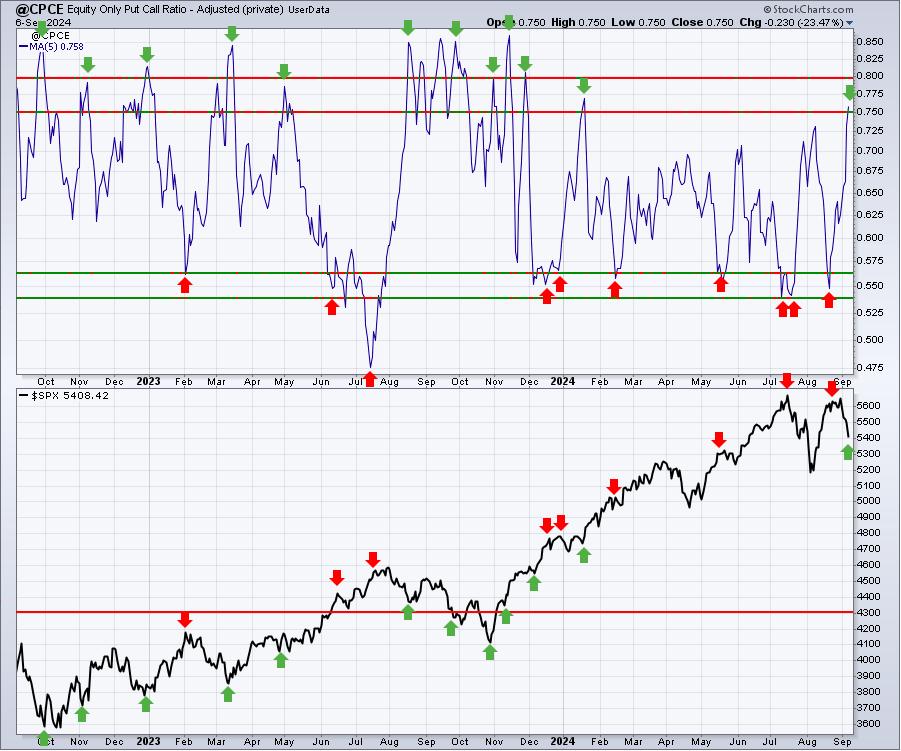
Readings of this 5-day SMA above .75, and especially .80, have a solid history of marking short-term bottoms, as you can see above. I expect September to be a very volatile month, with at least a few moves back and forth. Given the weak finish last week, I thought weakness today and another very pessimistic CPCE reading could help mark a bottom now. Unfortunately, we're seeing some strength so far today. Bottoms can form any way and they do usually take shape in a variety of ways. What I look for is a panicked intraday low, followed by significant buying. Today, we didn't even print a low beneath Friday's low, so panicked selling isn't likely - unless we see an afternoon reversal today and another close near or at the daily low.
253-day SMA ($CPCE)
This is my longer-term sentiment indicator to help provide long-term clues about the market. When this 1-year moving average is rising, stocks are generally in trouble and quite risky. But when the opposite occurs (falling 253-day SMA), you typically want to be long stocks. This is where we stand now:
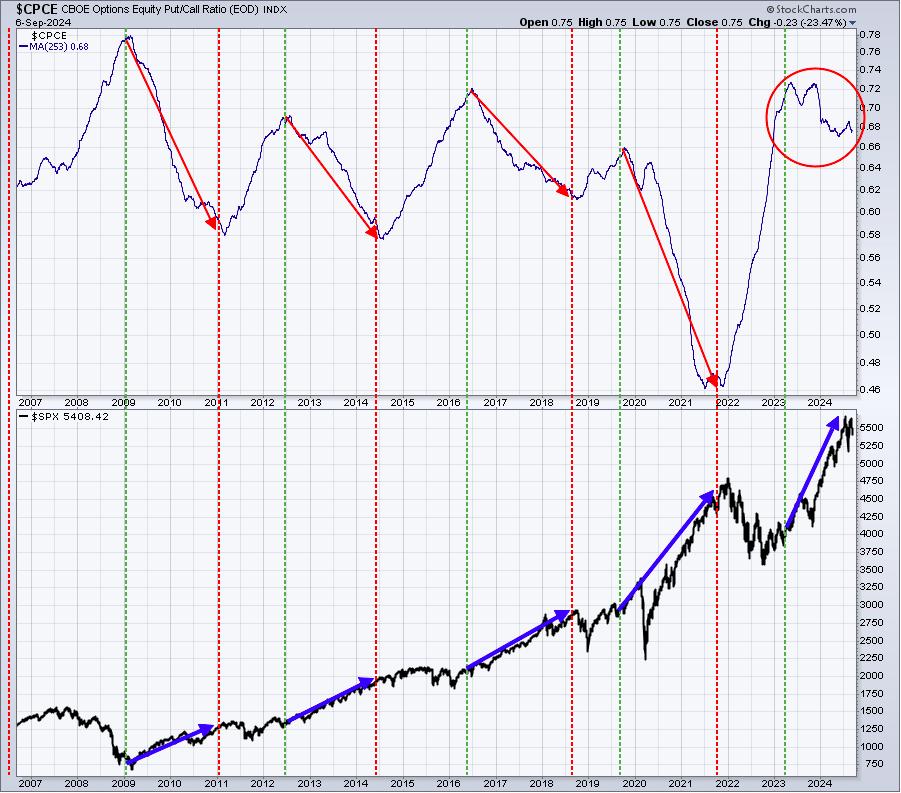
There are periods when the blue directional line moves higher, yet we see brief periods of selling - even cyclical bear markets. I don't expect to see a cyclical bear market develop, but I do recognize the frailty of the uptrend right now, as we battle through the very difficult historical period in September/October.
Overall, though, make no mistake about it. The rolling over of this 253-day SMA is BULLISH. It's one big reason why I believe the S&P 500 will return to new highs as soon as the September/October blues are eradicated.
Long-Term Trade Setup
Since beginning this Weekly Market Report nearly one year ago, I've discussed the long-term trade candidates below that I really like. Generally, these stocks have excellent long-term track records and many pay nice dividends that mostly grow every year. Only in very specific cases (exceptions) would I consider a long-term entry into a stock that has a poor or limited long-term track record and/or pays no dividends. Below is a quick recap of what I saw on each stock as of the close on Friday, August 23, 2024:
- JPM - just broke out again, looks poised for further gains into year end
- BA - hasn't performed well, but continues to trade and hold in a 160-180 support area
- FFIV - trending higher, I expect more strength into year end
- MA - further shift into financials will help continue this uptrend
- GS - love the absolute and relative strength here
- FDX - easily beating its rival UPS, expect further upside
- AAPL - has recovered nicely from its August swoon
- CHRW - huge earnings-related gap in August has this one on the move
- JBHT - broke to 4-month high on Friday
- STX - primarily trending higher since adding, now bouncing back from August selloff
- HSY - still consolidating, but AD line improving - sign of move higher?
- DIS - remains mired in downtrend off March/April high, big support just beneath 180
- MSCI - rallying strongly off April low
- SBUX - new CEO (former Chipotle CEO) lifted the stock nearly two weeks ago
- KRE - trending higher and poised for growth as upcoming rate cuts take effect
- ED - consistent utility stock near 52-week high
- AJG - reversing candle on Friday with neg divergence, could see short-term decline, still love long-term
- NSC - trying to kickstart a trend change in what's been mostly sideways action for last 3-4 years
Keep in mind that our Weekly Market Reports favor those who are more interested in the long-term market picture. Therefore, the list of stocks above are stocks that we believe are safer (but nothing is ever 100% safe) to own with the long-term in mind. Nearly everything else we do at EarningsBeats.com favors short-term momentum trading, so I wanted to provide an explanation of what we're doing with this list.
Because September is historically a very poor month in terms of stock performance, it should make sense that it's also a great time to be considering buying opportunities. We started our list last September and we added 5 stocks in September and another 4 in October. That's one reason why the performance of many of these stocks has been so strong. While I could see more market struggles ahead for perhaps the next 4-6 weeks, adding solid long-term performers is something we will do.
For this week, I want to add Robert Half, Inc. (RHI). This is a $6.4 billion staffing & employment services company that was founded in 1948 and filed its initial public offering (IPO) in 1991. It has a long-term history of capital appreciation and currently yields 3.49%, a very nice dividend. Its dividend has been raised by roughly 10% or more every year since 2013 and has been raised every year since 2005, according to www.nasdaq.com. Capital appreciation, a solid dividend, and a history of big annual dividend increases is the recipe for building a strong retirement portfolio.
Here's the long-term chart of RHI:
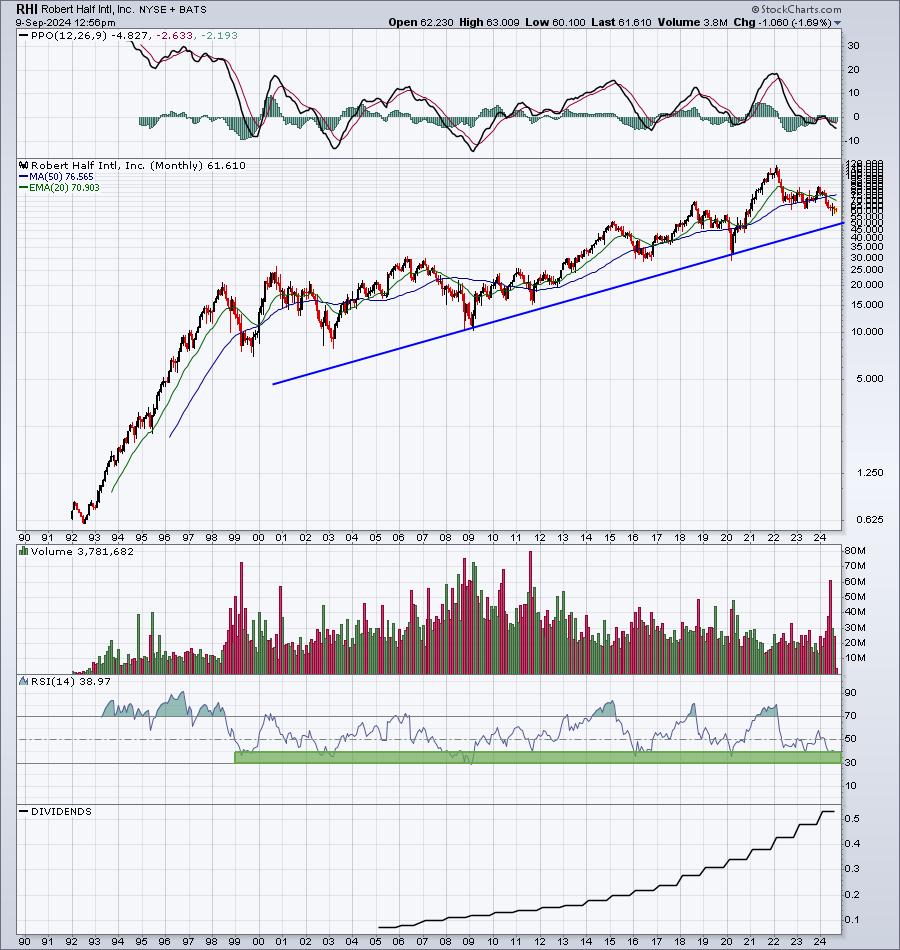
Price weakness has sent RHI down to approach a 15-year uptrend support line. The actual trendline is closer to 50. In the RSI panel below the price chart, you'll see a green-shaded rectangle, which marks every monthly RSI trip down into its key 40-50 support range. The financial crisis led to RHI's monthly RSI hitting 40. Otherwise, the monthly RSI level of 50 has been excellent in terms of entry price for the long-term. With RHI now down 50% from its 2022 high of 120 and its history of paying higher and higher dividends, I like the opportunity here for long-term investors.
Please keep in mind that I'm not a Registered Investment Advisor and am only providing what I believe to be a solid dividend-paying stock for the long-term. Companies periodically go through adjustments, new competition, restructuring, management changes, etc. that can have detrimental long-term impacts. The stock price nor the dividend is guaranteed. I'm simply pointing out an interesting stock candidate for long-term investors. Do your own due diligence and please consult with your financial advisor before making any purchases of securities.
Looking Ahead
Upcoming Earnings:
There is little happening this week in terms of earnings. The number of companies reporting is dwindling, but there are a couple that have the potential to move the market. This is NOT a list of ALL companies reporting this week, so please be sure to check for earnings of any companies that you own or add. Any companies in BOLD represent stocks in one of our Portfolios:
- Monday: ORCL ($393 billion)
- Tuesday: None
- Wednesday: None
- Thursday: ADBE ($252 billion), KR ($39 billion)
- Friday: None
Key Economic Reports:
- Monday: None
- Tuesday: August PMI manufacturing, August ISM manufacturing, July construction spending
- Wednesday: August CPI
- Thursday: Initial jobless claims, August PPI
- Friday: August consumer sentiment
Historical Data
I'm a true stock market historian. I am absolutely PASSIONATE about studying stock market history to provide us more clues about likely stock market direction and potential sectors/industries/stocks to trade. While I don't use history as a primary indicator, I'm always very aware of it as a secondary indicator. I love it when history lines up with my technical signals, providing me much more confidence to make particular trades.
Below you'll find the next two weeks of historical data and tendencies across the 3 key indices that I follow most closely:
S&P 500 (since 1950)
- Sep 9: -47.86%
- Sep 10: -23.57%
- Sep 11: +17.60%
- Sep 12: +11.56%
- Sep 13: +12.29%
- Sep 14: +35.62%
- Sep 15: -17.96%
- Sep 16: +78.05%
- Sep 17: -61.14%
- Sep 18: +24.48%
- Sep 19: +9.49%
- Sep 20: -48.23%
- Sep 21: -66.86%
- Sep 22: -20.86%
NASDAQ (since 1971)
- Sep 9: -15.68%
- Sep 10: -8.44%
- Sep 11: +52.98%
- Sep 12: -7.28%
- Sep 13: -2.76%
- Sep 14: +65.92%
- Sep 15: -50.69%
- Sep 16: +44.04%
- Sep 17: -94.47%
- Sep 18: +31.39%
- Sep 19: +77.18%
- Sep 20: -36.30%
- Sep 21: -95.89%
- Sep 22: -62.95%
Russell 2000 (since 1987)
- Sep 9: -27.30%
- Sep 10: +2.52%
- Sep 11: +85.94%
- Sep 12: +55.89%
- Sep 13: +22.12%
- Sep 14: +58.36%
- Sep 15: -35.64%
- Sep 16: +85.92%
- Sep 17: -141.79%
- Sep 18: +81.36%
- Sep 19: -17.94%
- Sep 20: -91.26%
- Sep 21: -172.80%
- Sep 22: -97.41%
The S&P 500 data dates back to 1950, while the NASDAQ and Russell 2000 information date back to 1971 and 1987, respectively.
Final Thoughts
Last week, we got a very quick reminder of what can happen in September. I would not be overly concerned about the long-term, though I do still feel the odds of further weakness and a potential correction across all of our major indices is quite possible.
- History. Every year plays out differently. Seasonality only provides us tendencies, so please don't view it as any sort of guarantee. Calling the market requires the collection of a LOT of puzzle pieces and, in the short-term, a lot of luck. With that said, the September tendencies are more bearish than any other calendar month and we've already seen what can happen during this month as last week's losses were among the largest weekly losses we've seen in years. Still, based on information provided above under "Historical Data", the next week or so tends to be fairly bullish, but the 2nd half of September can be extremely risky. The September 20-26 week is the 2nd worst week of the year historically, trailing only the October 21-27 period.
- Inflation. We'll get the latest monthly (August) CPI and PPI reports later this week. The Fed has already said that they've "stomped inflation" (my words, not theirs) and that their policy needs to change. As a result, I don't believe inflation reports will carry significant weight as we move forward. Ultimately, it will be about the economy and the likelihood of a recession.
- Volatility ($VIX). The VIX has now spiked through 20 twice in the past several weeks. ANY TIME the VIX jumps above 20, we need to be on our toes as traders. While we can see steady advances from time to time, a high VIX environment sets us up for IMPULSIVE periods of selling, which can be excruciatingly painful to a short-term trader trying to maintain and build capital. The VIX is down 13% today and at the time of this report, and currently below 20, but we know how quickly that can change. A decent finish today could signal the end of the short-term selling, but I still believe we have additional selling episodes ahead of us.
- The Fed. The upcoming Fed meeting (September 17-18) is very widely anticipated as it'll likely mark the first interest rate cut. The discussion is now likely to move from whether the Fed will cut rates to how much the Fed will cut rates. The larger the cuts, the less confidence traders will have in our economy short-term - in my opinion, but the better it'll be for longer-term economic growth.
- Rotation. Watch the QQQ:SPY, IWF:IWD, and XLY:XLP ratios to follow what Wall Street is doing in terms of growth vs. value rotation. These ratios currently are moving lower, but at some point, they'll reverse. When they do, it'll send us a much more bullish vibe.
Feedback
If you'd like to share your thoughts on our Weekly Market Report, positive or negative, you can reach us at "[email protected]".
Happy trading!
Tom