
EB Weekly Market Report - Monday, September 16, 2024
Vacation Schedule
I will be on vacation from Wednesday, September 18th through Monday, September 23rd. This will be our modified schedule until I return to work on Tuesday, September 24th:
- John Hopkins will provide a very brief market update each day the market is open from Wednesday, September 18th through Monday, September 23rd.
- I will provide an EB Daily Market Report next Tuesday, September 24th, so our next EB Weekly Market Report will be published on Monday, September 30th.
- As I mention below, ChartLists will not be updated until the weekend of Friday, September 27th, as there just won't be much activity (earnings) through that date.
- There will be no EB Digest newsletter article on Monday, September 23rd.
- We will have Trading Places LIVE tomorrow morning and next Tuesday, September 24th.
- There will be no StockCharts Weekly Recap video this Thursday. The next recording will be on Thursday, September 26th.
- There will be no EB Weekly Portfolio Report this weekend. It will return on the weekend of Friday, September 27th.
ChartLists NOT Updated
There were few earnings reports released last week and there'll be very few released through the end of September. As a result, we'll wait until the end of September to update the following primary ChartLists:
- Strong Earnings (SECL)
- Strong Future Earnings (SFECL)
- Raised Guidance (RGCL)
- Bullish Trifecta (BTCL)
Because there are very few key earnings reports that will be released ahead of the start of Q3 earnings season, we will not be providing our Upcoming Earnings ChartLists again until mid-October.
Weekly Market Recap
Major Indices
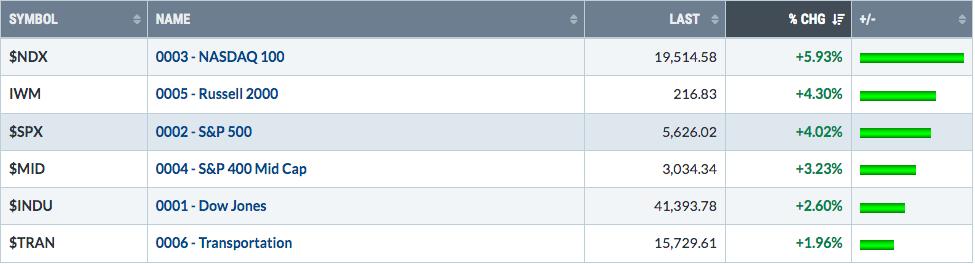
After starting September in defensive mode with aggressive areas lagging badly, this past week was exactly the opposite. The growth-laden NASDAQ 100 ($NDX) rebounded very nicely. Options expire this week, so it's quite possible that we're seeing temporary leadership as the value of net in-the-money put premium is significantly reduced by market makers.
Sectors
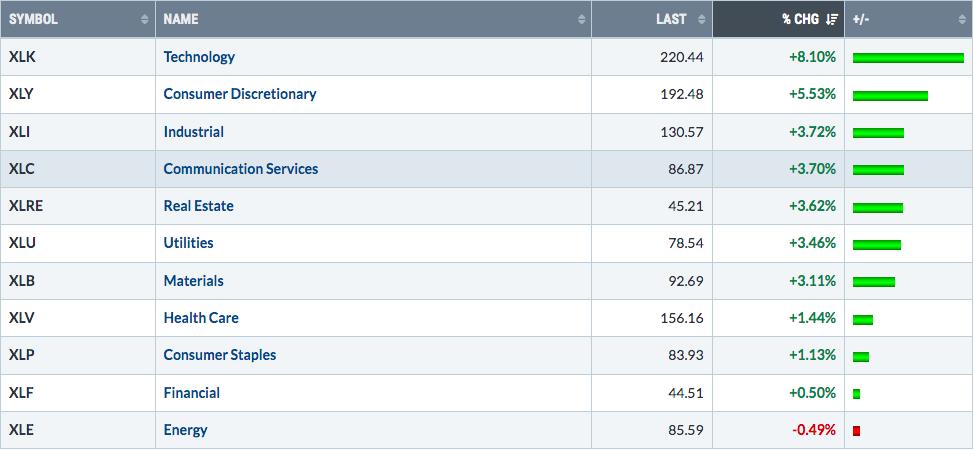
While much of the technology (XLK) gains can be attributed to short-term manipulation, I do have to say that I love what's going on with the AD line relating to the XLK:
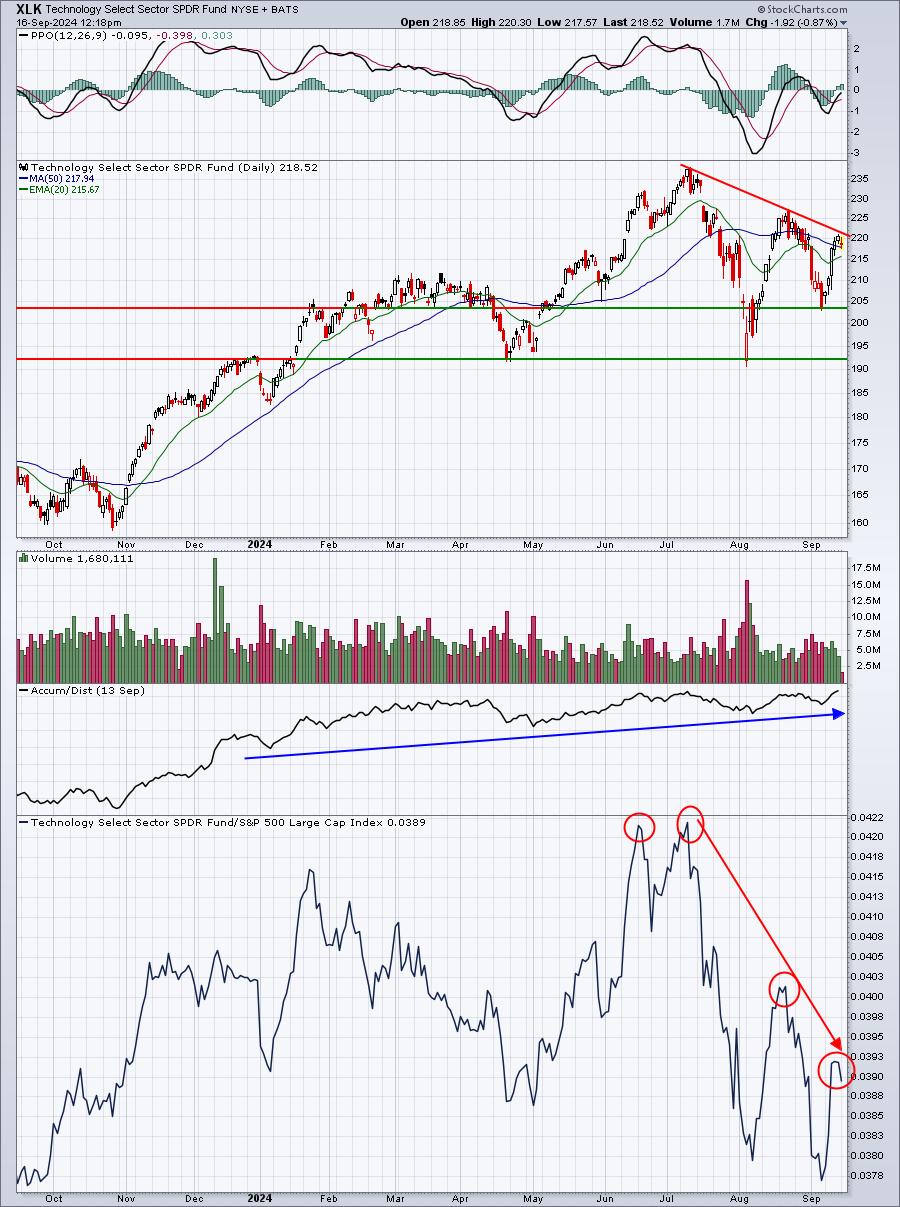
After taking one look at this chart, and knowing what we typically see in September/October, particularly during Presidential Election years, it's hard to be overly bullish short-term. The four red circles in the bottom relative strength panel highlight what's been happening when we start to see technology roll over. So I'm looking at this group, believing it's short-term bearish and long-term bullish.
Top 10 Industries Last Week
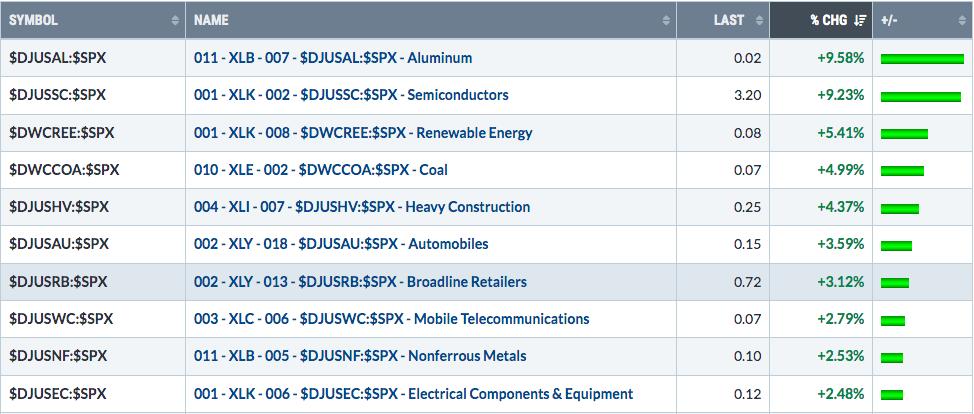
Aluminum ($DJUSAL) was very strong last week, but if it's to continue, it'll need to clear price resistance near 120 as that's where the buying stopped in August:
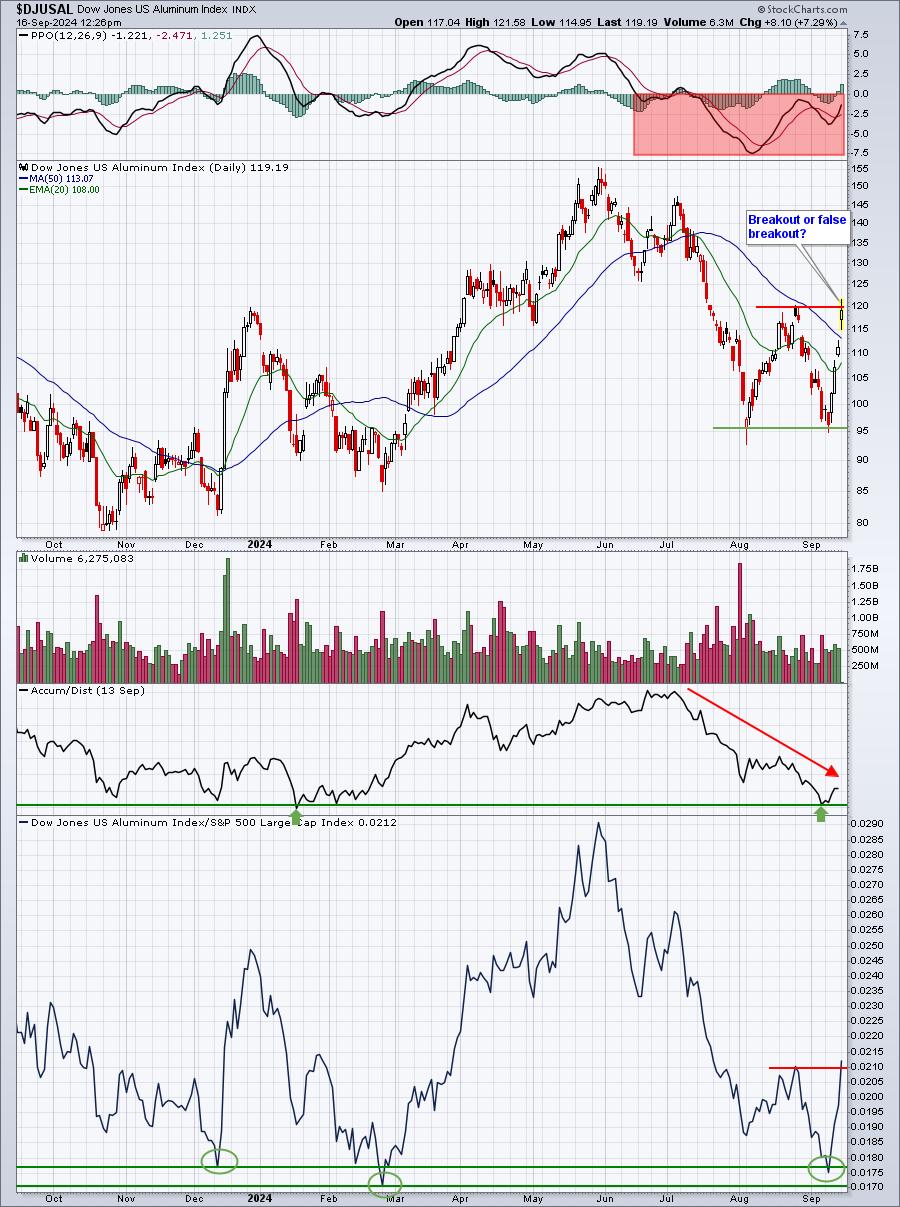
Aluminum traveled from key price support to key price resistance in just one week. This helps to illustrate the type of volatility that we can see during this time of the calendar year. It makes trading much, much more difficult. You have to be able to completely harness your emotions, trade with discipline, and be willing to accept plenty of whipsaw action. Watch the relative support area (bottom panel), the 52-week low support on the AD line, and the negative PPO. The first must hold, the second must improve, and the third must reverse in order for the DJUSAL to actually become bullish. That's a tall task.
Bottom 10 Industries Last Week
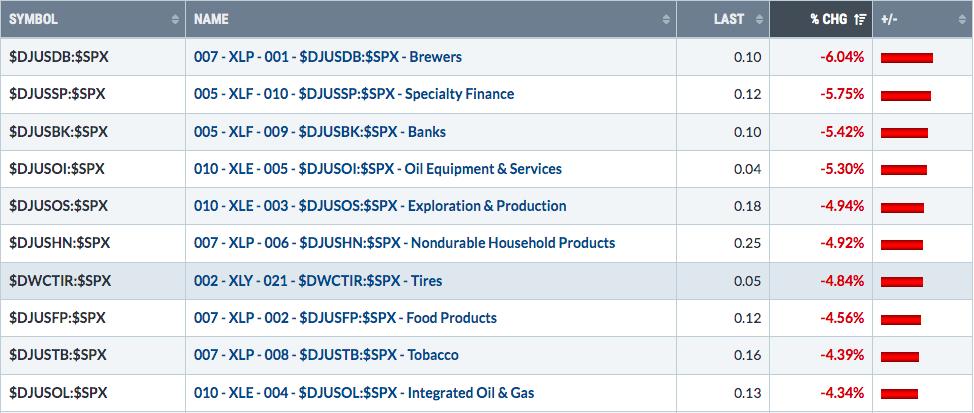
Specialty finance ($DJUSSP) was the 2nd worst-performing industry group last week. Some are showing breakdowns, while others are suggesting opportunity. We know financials LOVE the last 4 months of the year from both an absolute and relative perspective. So is this recent decline in the DJUSSP setting up opportunities in this space? I think probably so:
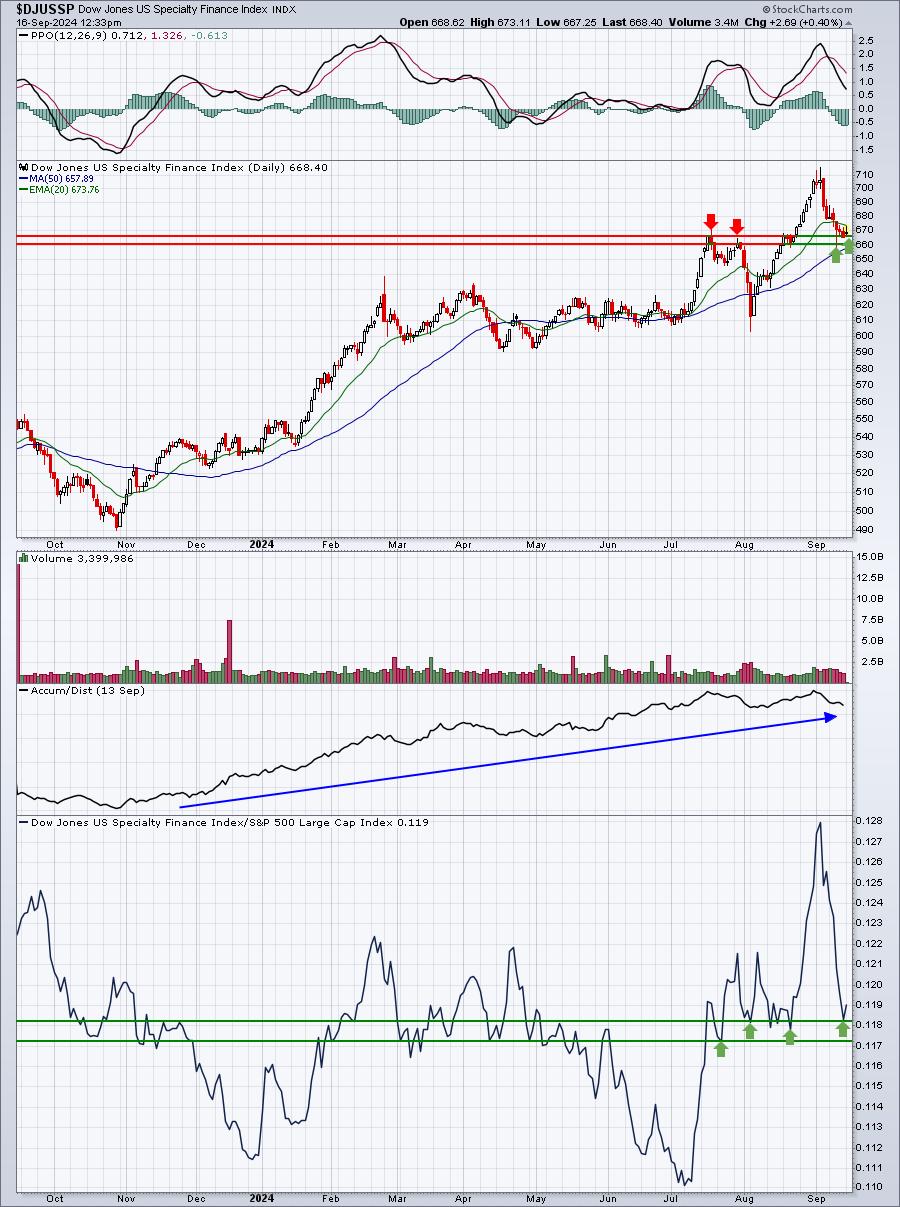
Over the past two months, the DJUSSP has found relative support in the 0.117-0.118 range and that's exactly where we're beginning to bounce again. Also, in terms of absolute price action, we saw this area of the market top twice in July. After breaking out in mid-August, we've now returned to the level of the breakout. While this doesn't provide us a guarantee of higher prices, the profit taking period has set us up beautifully with low risk trades in this space.
By the way, after 7 consecutive days of lower highs, the DJUSSP printed a higher high today. This could mark the beginning of a rally in the group.
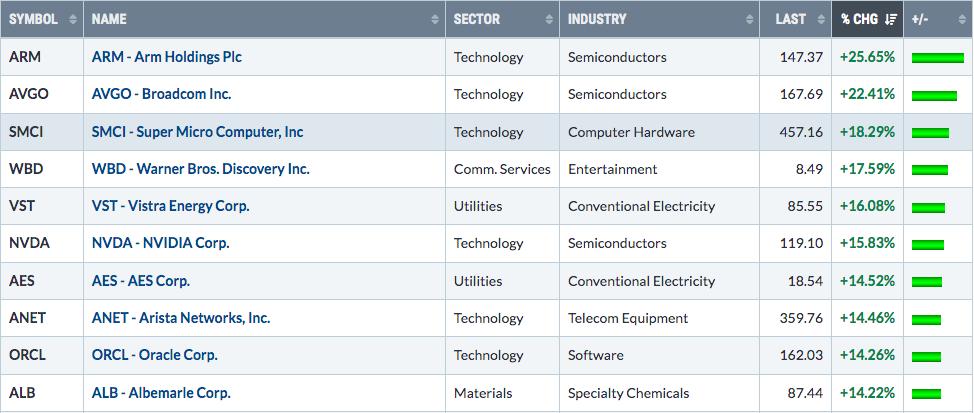
Top 10 Stocks - S&P 500/NASDAQ 100
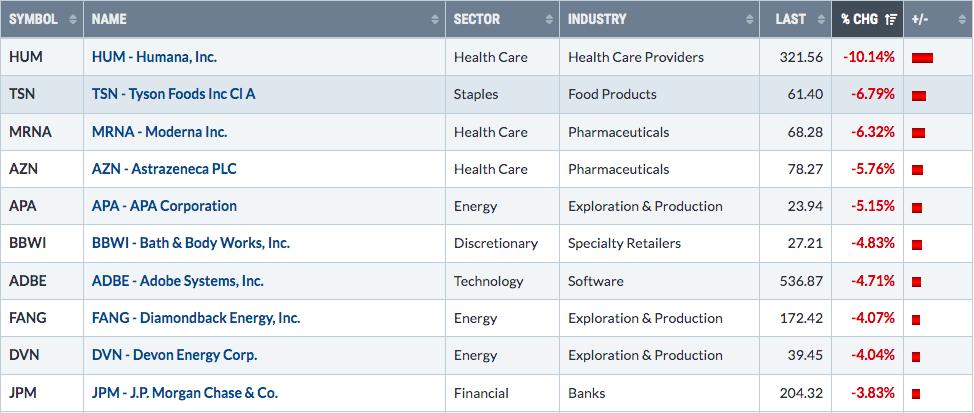
Bottom 10 Stocks - S&P 500/NASDAQ 100
Big Picture
Here's an update of the Big Picture, 100-year chart of the S&P 500:
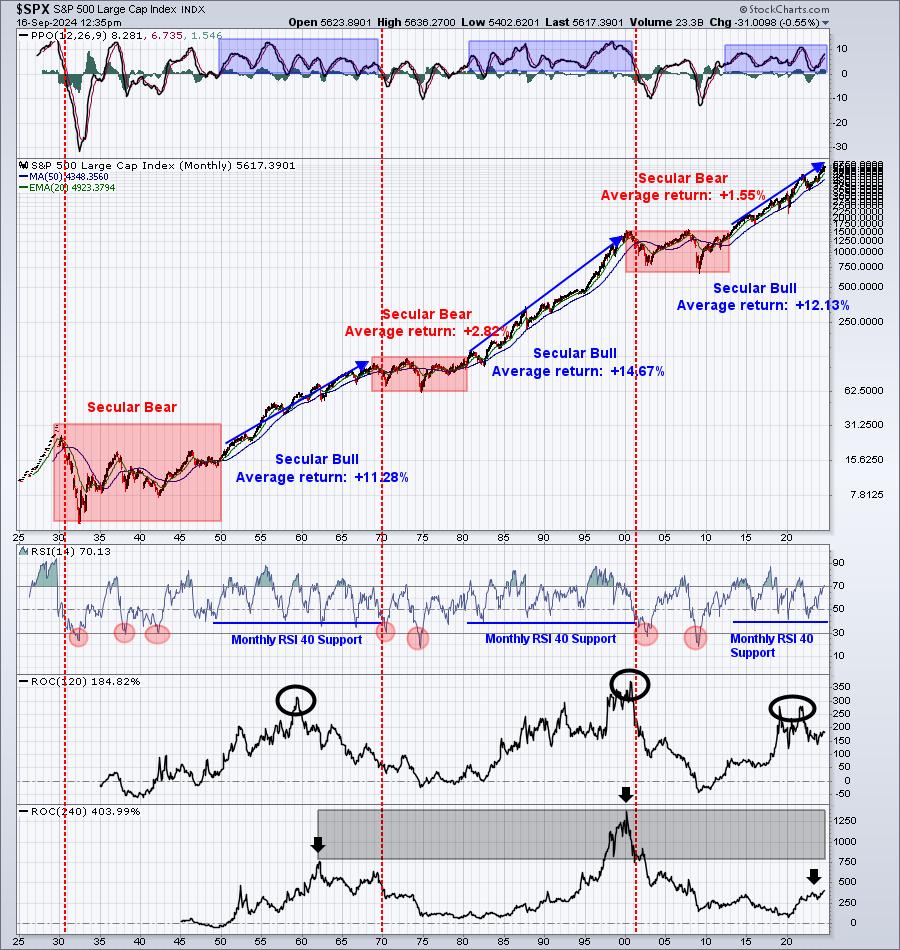
Last week, I mentioned how rough the week was, but how this Big Picture chart drowns out all of that short-term noise. This past week, we made a significant rebound and, really, nothing has changed on this chart. That's why it's so useful for those investors/traders that take a long-term approach to U.S. equities.
Rotation/Intermarket Analysis
Here's the latest look at our key intraday ratios as we follow where the money is traveling on an INTRADAY basis (ignoring gaps):
QQQ:SPY
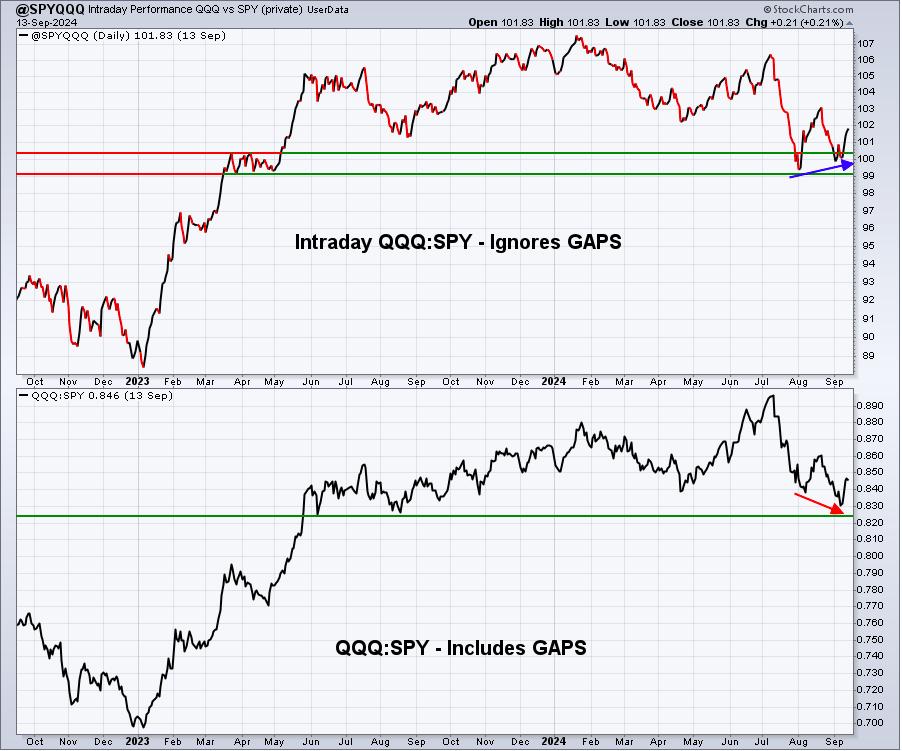
This is a type of negative divergence, where it appears the QQQ:SPY ratio is declining if we include gaps, which generally represent manipulation on the part of market makers. But if we strip out that manipulation and ONLY look at intraday action, the QQQ:SPY ratio is advancing, a much more bullish signal, in my view. Even if our major indices drop over the next several weeks, it appears that Wall Street is preparing for an eventual rally to all-time highs.
Remember, this chart is actually calculated QQQ:SPY, despite its "@SPYQQQ" name.
IWM:QQQ
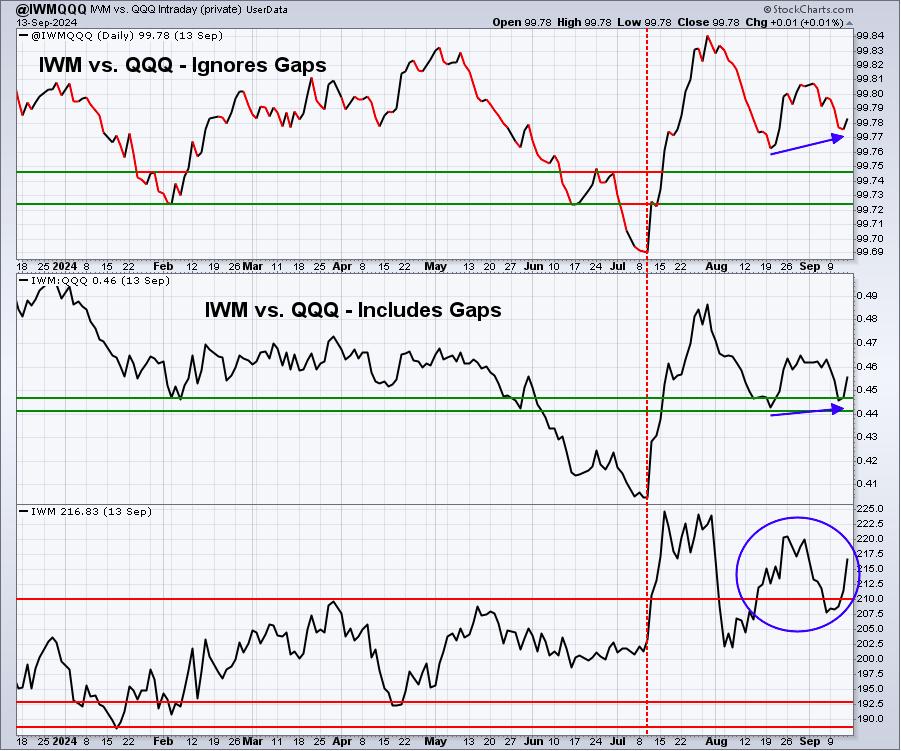
Last week saw the IWM underperform the QQQ, but it didn't really lose much ground, if we concentrate only on the IWM:QQQ ratio that ignores gaps. It'll be very interesting to see what happens to this ratio after the interest rate cut is announced this Wednesday.
XLY:XLP
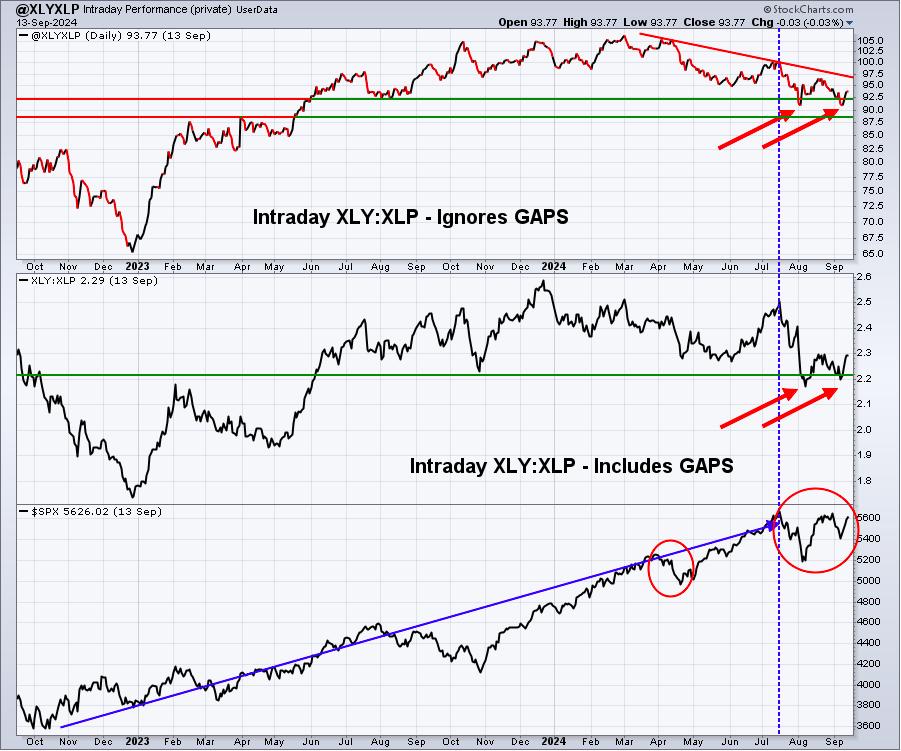
The blue-dotted vertical line marks the July high on the S&P 500. Notice that we keep attempting to break out on the S&P 500, but with less and less strength in the aggressive consumer discretionary sector (XLY). Because XLY performance is tied to economic activity, it stands to reason that lower interest rates will spur economic activity, and as a result, also spur discretionary stocks. I'd like to see renewed relative strength (rising XLY:XLP ratio) in the XLY to accompany a meaningful breakout in the S&P 500.
Sentiment
5-day SMA ($CPCE)
The CPCE gave us another signal that the options world was growing too bearish in early September. This is a contrarian indicator, so as traders grew more pessimistic, we bottomed - you can see the many times this has happened over the past two years:
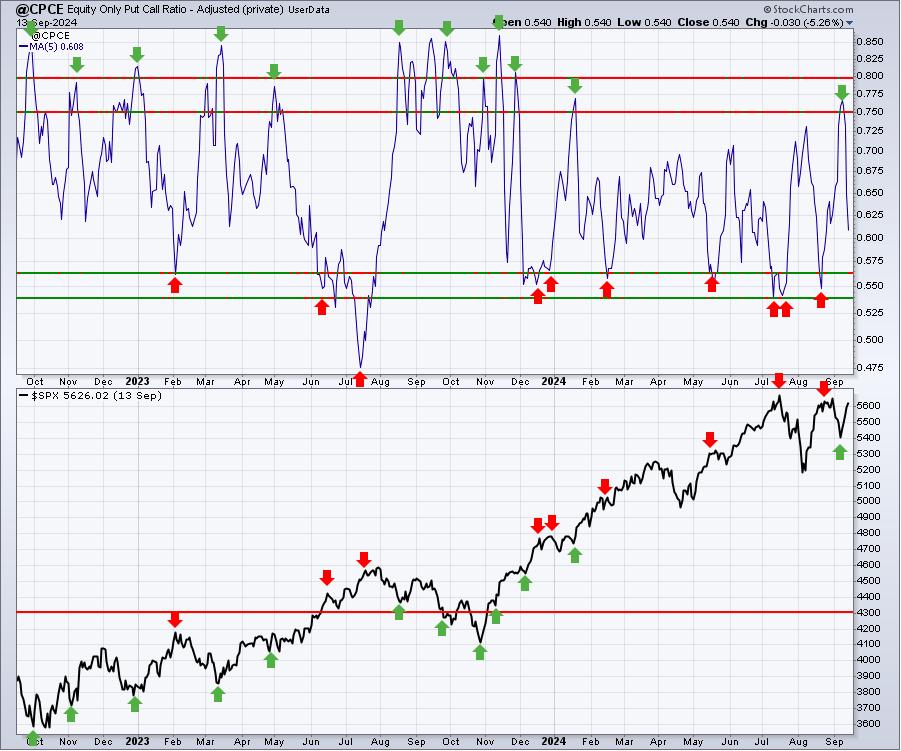
Readings of this 5-day SMA above .75, and especially .80, have a solid history of marking short-term bottoms, as you can see above. I expect September to be a very volatile month, with at least a few moves back and forth. Expect the unexpected.
253-day SMA ($CPCE)
This is my longer-term sentiment indicator to help provide long-term clues about the market. When this 1-year moving average is rising, stocks are generally in trouble and quite risky. But when the opposite occurs (falling 253-day SMA), you typically want to be long stocks. This is where we stand now:
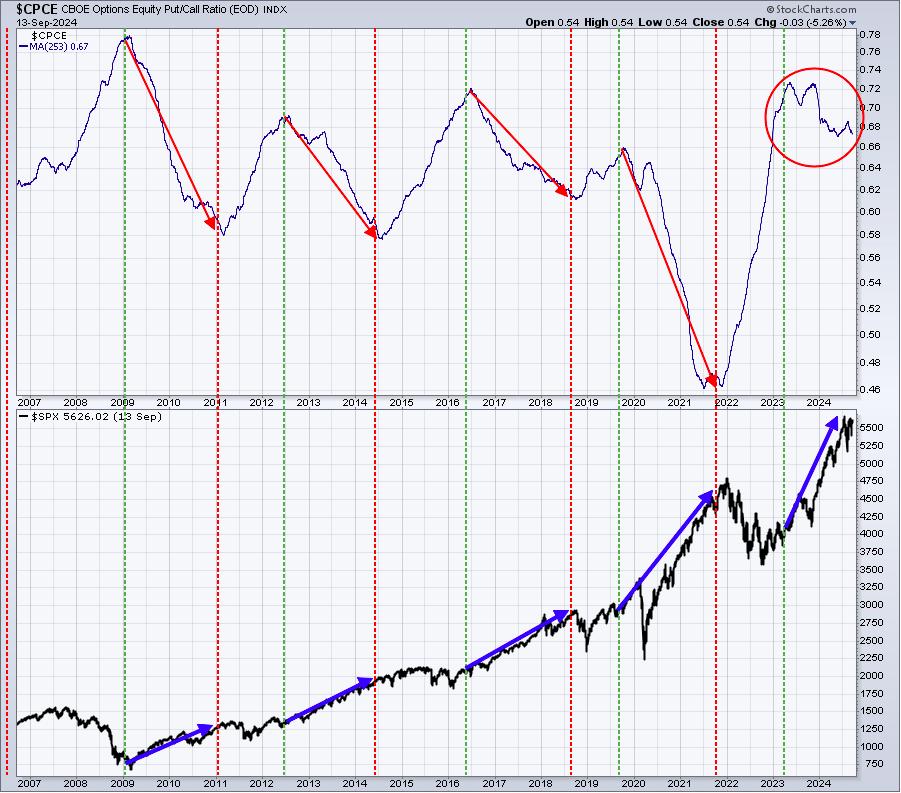
Listen, we know we have short-term issues that we'll need to face and deal with in September/October, but the above chart tells me that we're going higher if we look further out.
Long-Term Trade Setup
Since beginning this Weekly Market Report over one year ago, I've discussed the long-term trade candidates below that I really like. Generally, these stocks have excellent long-term track records and many pay nice dividends that mostly grow every year. Only in very specific cases (exceptions) would I consider a long-term entry into a stock that has a poor or limited long-term track record and/or pays no dividends. Below is a quick recap of what I see on each stock as of today's action (Monday, September 16th):
- JPM - bad day recently when net interest income guidance was lowered; still in nice uptrend
- BA - broke 160 price support, appears poised to potentially test the 120 support area from 2022
- FFIV - performing much better than peers, expect higher prices into year end
- MA - strong trend remains in play
- GS - short-term pullback looks buyable ahead of likely Q4 rally
- FDX - earnings this week, will it clear key price resistance from 300-310?
- AAPL - 200 looks like solid short-term support
- CHRW - lots of resistance in 100-110 range, need to clear to get higher prices
- JBHT - excellent price support in 150-160 range, consolidating for now
- STX - uptrend intact, looking for a sustained move through 110
- HSY - consolidating for a year now; AD line suggesting a potential breakout to the upside
- DIS - a definitive breakout above 92 would improve short-term chart, long-term remains weak
- MSCI - still slowly grinding to the upside
- SBUX - still trending higher from new CEO announcement in August
- KRE - nice uptrend in play; expect more upside with rate cuts on the horizon
- ED - solid dividend payer now adding up capital appreciation as well
- AJG - one of the steadiest 2024 uptrends that you'll find
- NSC - attempted to clear 260; ultimately doing so could set up major test at 280
- RHI - just added one week ago, so far moving slightly higher
Keep in mind that our Weekly Market Reports favor those who are more interested in the long-term market picture. Therefore, the list of stocks above are stocks that we believe are safer (but nothing is ever 100% safe) to own with the long-term in mind. Nearly everything else we do at EarningsBeats.com favors short-term momentum trading, so I wanted to provide an explanation of what we're doing with this list.
Because September is historically a very poor month in terms of stock performance, it should make sense that it's also a great time to be considering buying opportunities. We started our list last September and we added 5 stocks in September and another 4 in October. That's one reason why the performance of many of these stocks has been so strong. While I could see more market struggles ahead for perhaps the next few weeks, adding solid long-term performers is something we will do. We're adding nothing today, but will likely add a few more stocks in late September and another 3-4 in October. This is buying season for long-term investors and traders.
Please keep in mind that I'm not a Registered Investment Advisor and am only providing (mostly) what I believe to be solid dividend-paying stocks for the long-term. Companies periodically go through adjustments, new competition, restructuring, management changes, etc. that can have detrimental long-term impacts. The stock price nor the dividend is ever guaranteed. I simply point out interesting stock candidates for longer-term investors. Do your own due diligence and please consult with your financial advisor before making any purchases of securities.
Looking Ahead
Upcoming Earnings:
This is a very slow period for company earnings, as you can see below. This is NOT a list of ALL companies reporting this week, so please be sure to check for earnings of any companies that you own or add. Any companies in BOLD represent stocks in one of our Portfolios:
- Monday: None
- Tuesday: FERG ($38 billion)
- Wednesday: GIS ($41 billion)
- Thursday: FDX ($70 billion), LEN ($50 billion)
- Friday: None
Key Economic Reports:
- Monday: September empire state manufacturing index
- Tuesday: August retail sales, August industrial production & capacity utilization, July business inventories, September housing market index
- Wednesday: August housing starts & building permits, FOMC announcement
- Thursday: Initial jobless claims, September Philadelphia Fed manufacturing index, August existing home sales, August leading indicators
- Friday: None
Historical Data
I'm a true stock market historian. I am absolutely PASSIONATE about studying stock market history to provide us more clues about likely stock market direction and potential sectors/industries/stocks to trade. While I don't use history as a primary indicator, I'm always very aware of it as a secondary indicator. I love it when history lines up with my technical signals, providing me much more confidence to make particular trades.
Below you'll find the next two weeks of historical data and tendencies across the 3 key indices that I follow most closely:
S&P 500 (since 1950)
- Sep 16: +78.05%
- Sep 17: -61.14%
- Sep 18: +24.48%
- Sep 19: +9.49%
- Sep 20: -48.23%
- Sep 21: -66.86%
- Sep 22: -20.86%
- Sep 23: -48.93%
- Sep 24: -31.23%
- Sep 25: -25.84%
- Sep 26: -64.85%
- Sep 27: +6.14%
- Sep 28: +67.63%
- Sep 29: -89.54%
NASDAQ (since 1971)
- Sep 16: +44.04%
- Sep 17: -94.47%
- Sep 18: +31.39%
- Sep 19: +77.18%
- Sep 20: -36.30%
- Sep 21: -95.89%
- Sep 22: -62.95%
- Sep 23: -65.84%
- Sep 24: -25.77%
- Sep 25: -30.84%
- Sep 26: -69.22%
- Sep 27: -29.90%
- Sep 28: +57.82%
- Sep 29: -99.36%
Russell 2000 (since 1987)
- Sep 16: +85.92%
- Sep 17: -141.79%
- Sep 18: +81.36%
- Sep 19: -17.94%
- Sep 20: -91.26%
- Sep 21: -172.80%
- Sep 22: -97.41%
- Sep 23: -84.36%
- Sep 24: -57.57%
- Sep 25: -18.95%
- Sep 26: -56.18%
- Sep 27: +24.03%
- Sep 28: +78.91%
- Sep 29: -50.10%
The S&P 500 data dates back to 1950, while the NASDAQ and Russell 2000 information date back to 1971 and 1987, respectively.
Final Thoughts
Last week, we got a very quick reminder of what can happen in September. I would not be overly concerned about the long-term, though I do still feel the odds of further weakness and a potential correction across all of our major indices is quite possible.
- The Fed. The latest Fed meeting begins tomorrow morning and we'll likely get our first rate cut in years on Wednesday, when the Fed policy decision and statement is announced. I expect a .25 basis point cut and I expect the Fed to announce that they're expecting a series of rate cuts, with the timing and size dictated by data - both economic and inflation.
- Rotation. ANY time that we get a major report or announcement, I like to analyze the rotation that immediately follows. In particular, watch the cyclical stocks and whether they outperform. For me, it'd be the financials and industrials, including banks and transportation. These areas tend to lead in Q4, so a changing Fed policy that supports those areas should result in outperformance in those areas as we move towards year end.
- Options Expiration. Friday will mark monthly options expiration for the month of September. Don't be shocked to see volatility ($VIX) rise into week's end and into next week. Why? Well because of.....
- History. September 20th (this Friday) through September 26th (next Thursday) marks the 2nd worst week of the year historically on the S&P 500, NASDAQ, and Russell 2000, dating back 74 years, 53 years, and 36 years, respectively.
- Economy. Now that inflationary fears are subsiding, it's time for the bears to find something else to feast on for awhile. The economy could be a convenient target. I fully expect to hear much more about a potential recession ahead. If it materializes and stocks suffer short-term as a result, we'll likely be setting up for the "buy of the year", just before a more bullish historical period approaches.
Feedback
If you'd like to share your thoughts on our Weekly Market Report, positive or negative, you can reach us at "[email protected]".
Happy trading!
Tom