
EB Weekly Market Report - Monday, September 30, 2024
ChartLists Updated
The following ChartLists were updated late last week:
- Strong Earnings (SECL)
- Strong Future Earnings (SFECL)
- Raised Guidance (RGCL)
- Short Squeeze (SSCL)
- Bullish Trifecta (BTCL)
Our schedule for updating ChartLists will be this Friday, October 4th and two weeks later on Friday, October 18th. After October 18th, earnings reports will accelerate and we'll be looking to update our ChartLists weekly.
Weekly Market Recap
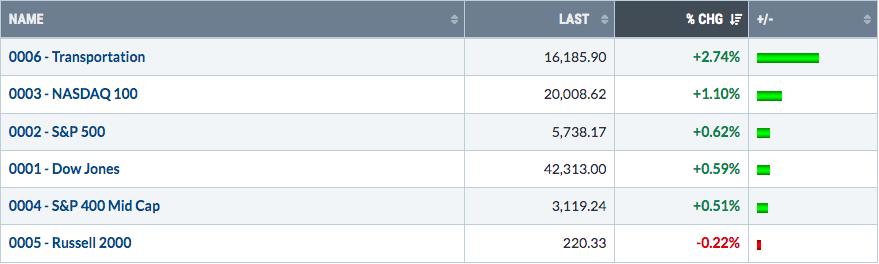
Major Indices
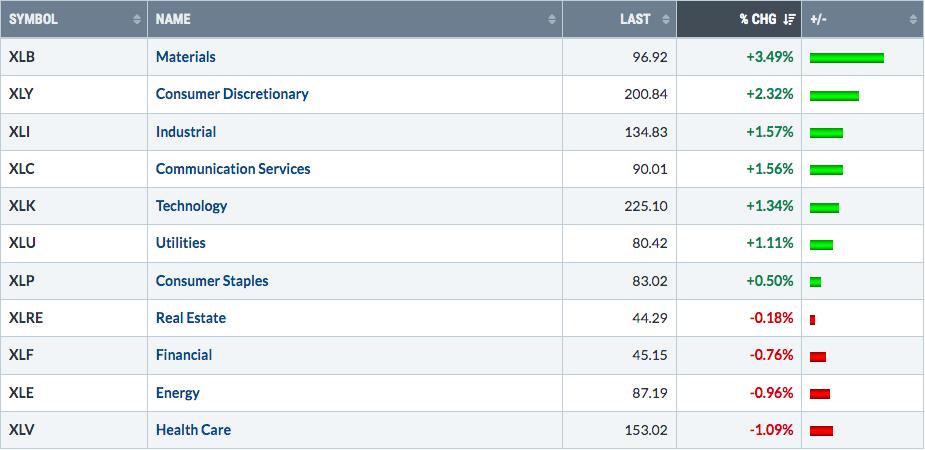
Sectors
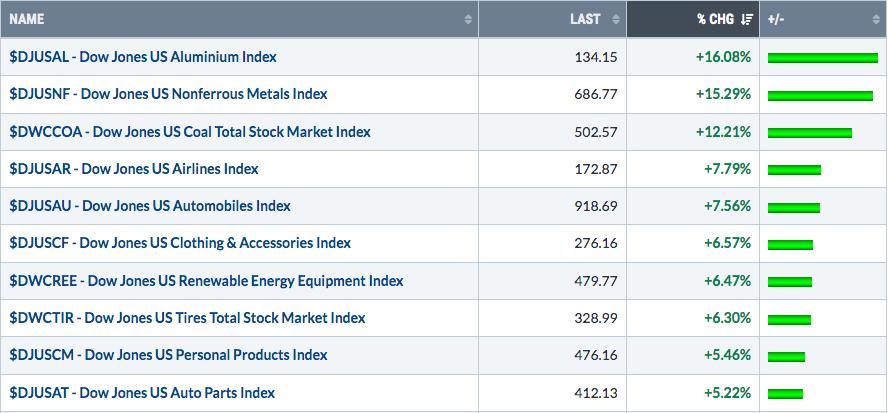
Top 10 Industries Last Week
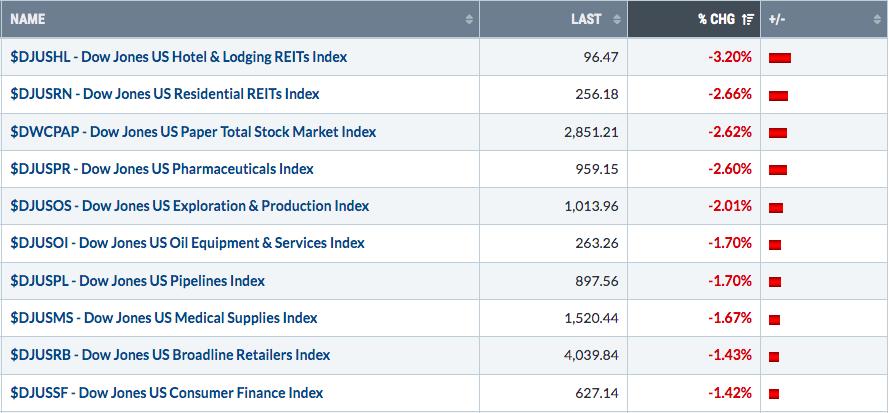
Bottom 10 Industries Last Week
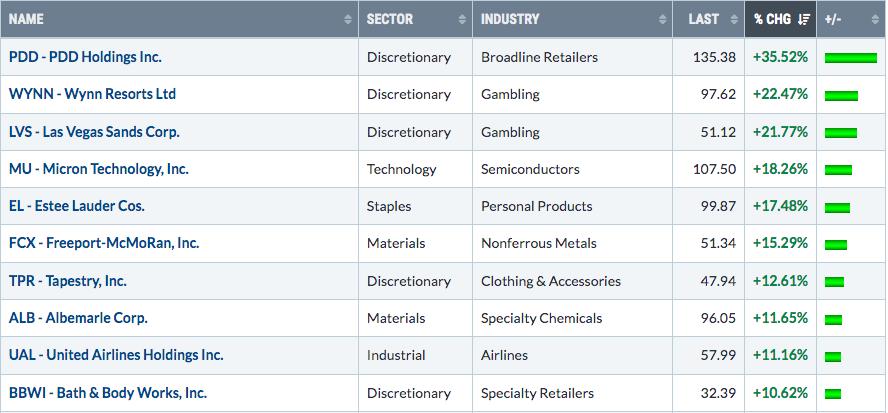
Top 10 Stocks - S&P 500/NASDAQ 100
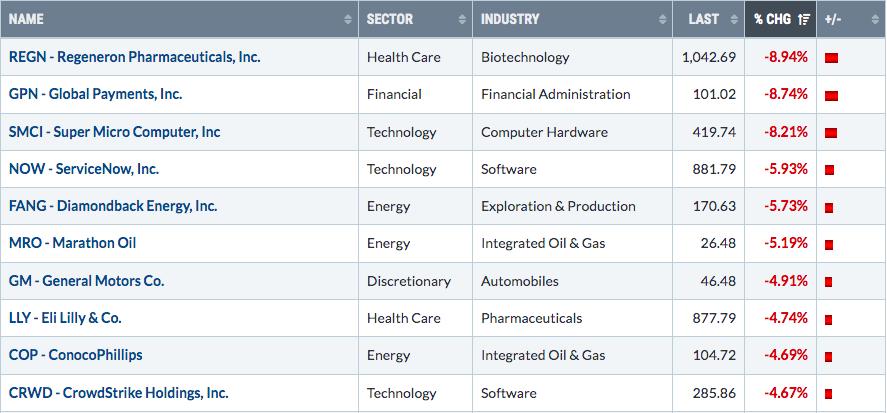
Bottom 10 Stocks - S&P 500/NASDAQ 100
Big Picture
Here's an update of the Big Picture, 100-year chart of the S&P 500:
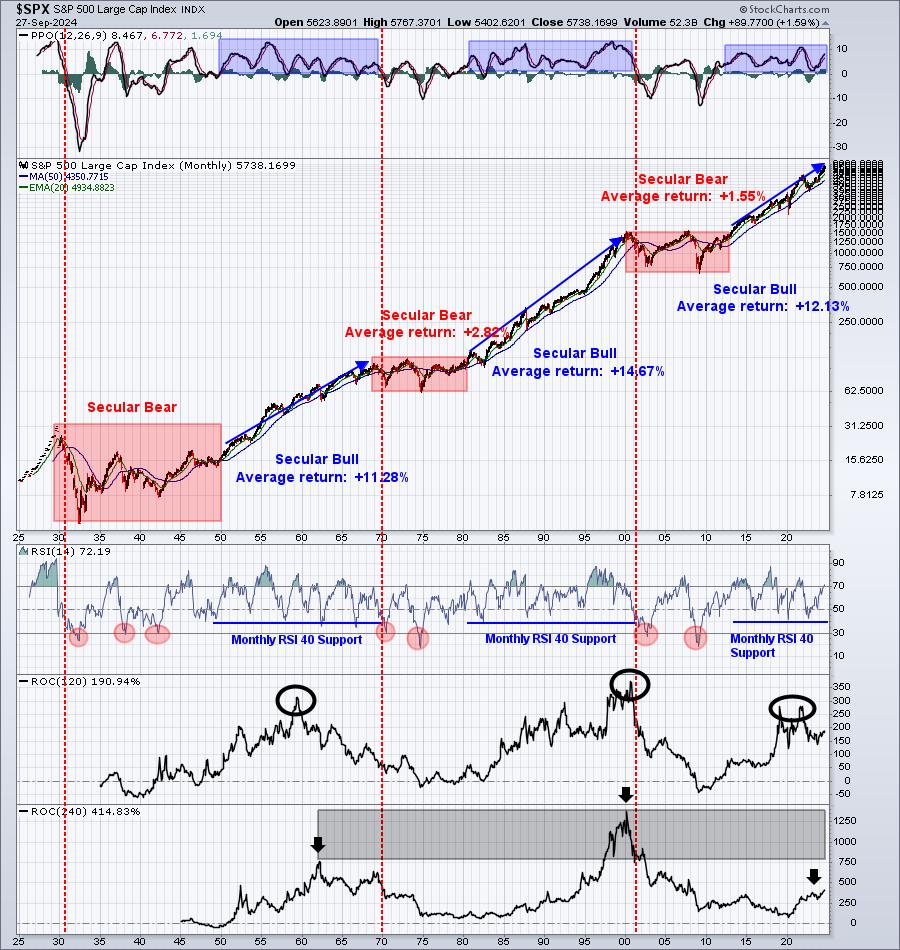
There are plenty of market participants that want to constantly call the end of the secular bull market, but these tend to last MUCH longer than anyone anticipates. That's why it's foolish to bet against them. Notice the monthly PPO is accelerating and the 240-month ROC is doing the same. These are signals given from secular bull markets, not bear markets. Even if you believe that a long-term top is forming, you need to see actual price weakness to confirm your bearish signals. Given our major indices at or near all-time highs, those confirming bearish price signals simply are not occurring.
Stay long-term bullish.
Rotation/Intermarket Analysis
Here's the latest look at our key intraday ratios as we follow where the money is traveling on an INTRADAY basis (ignoring gaps):
QQQ:SPY
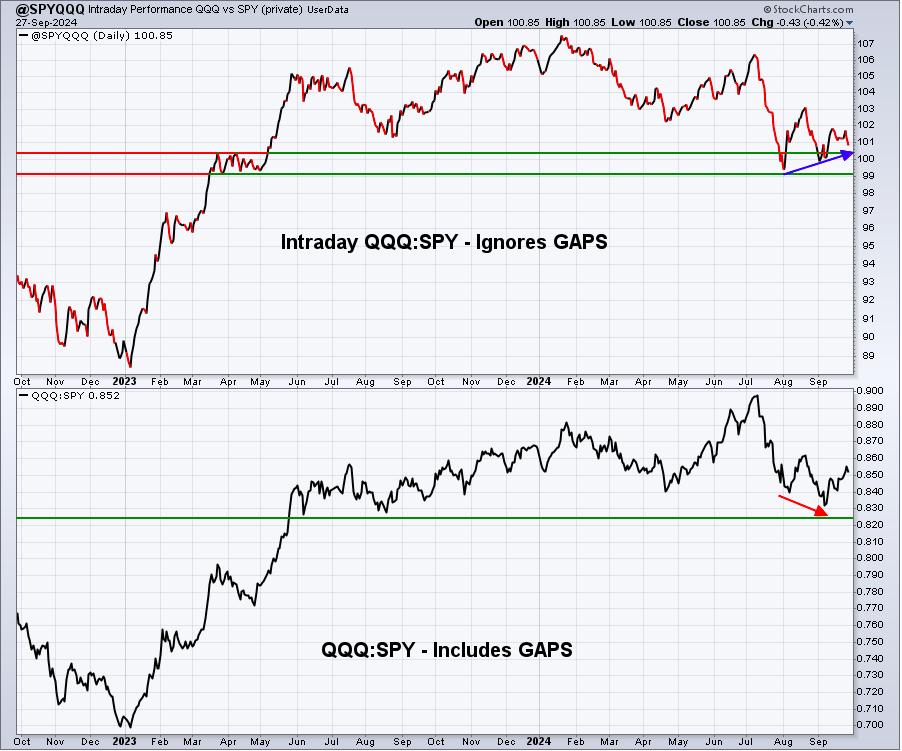
The latest rally in the S&P 500 is NOT being confirmed by stronger action in growth stocks. The QQQ:SPY ratio is nowhere near a breakout level to suggest that the current rally in sustainable in any meaningful way. This doesn't mean we won't go higher, it's just that it's very unlikely to see significant improvement when the most influential sector (technology) isn't showing relative strength.
Remember, this chart is actually calculated QQQ:SPY, despite its "@SPYQQQ" name.
IWM:QQQ
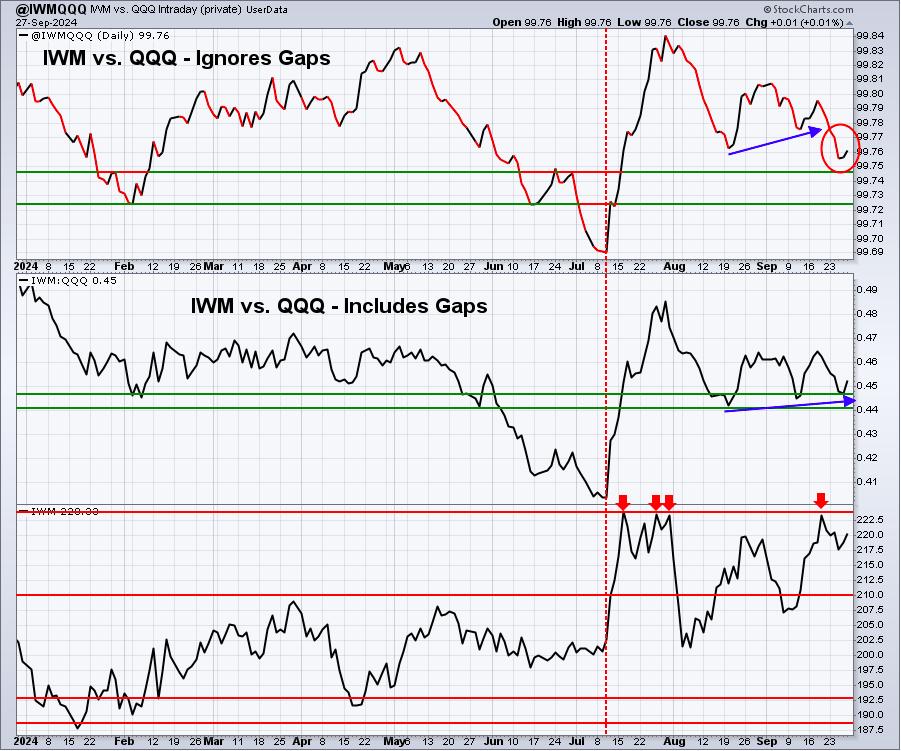
I've been a fan of small caps all year, patiently waiting for interest rate cuts to begin. A little over a week ago, we got exactly that - an interest rate cut - and yet small caps continue to struggle on a relative basis. The good news is that small caps have outperformed since July. The bad news is they haven't been able to sustain the relative move higher in recent weeks.
XLY:XLP
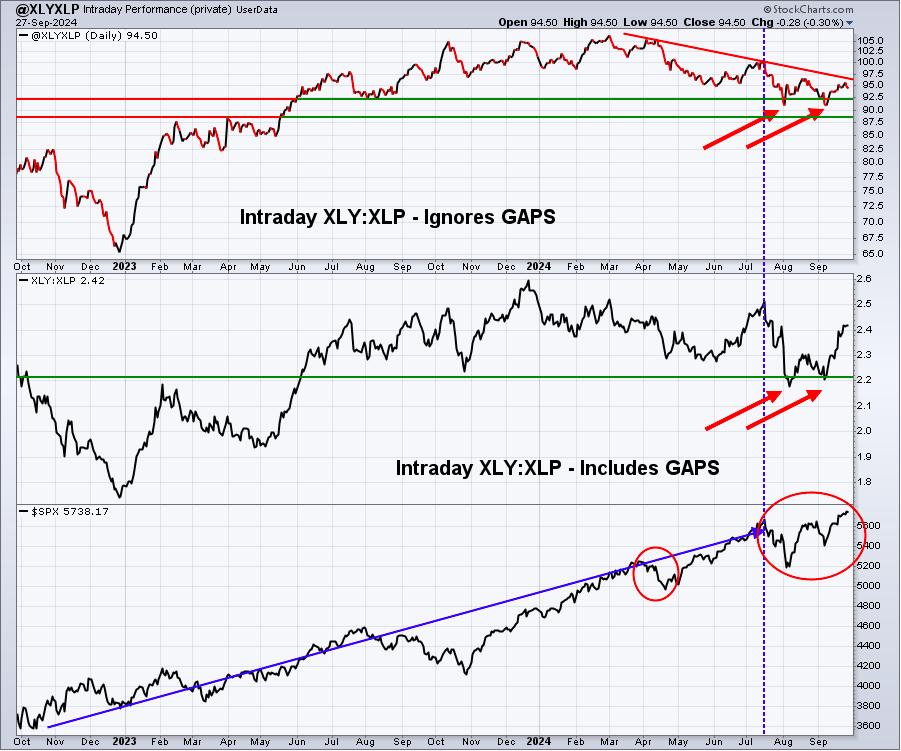
As the S&P 500 sets new highs, the XLY:XLP ratio has improved. But if we ignore gaps, we're still showing key overhead trendline resistance. Breaking above that would add significantly to the bullish action.
Sentiment
5-day SMA ($CPCE)
The CPCE is now telling us to be very, very careful. In fact, based on the 5-day moving average of the CPCE, a short-term top is likely at hand:
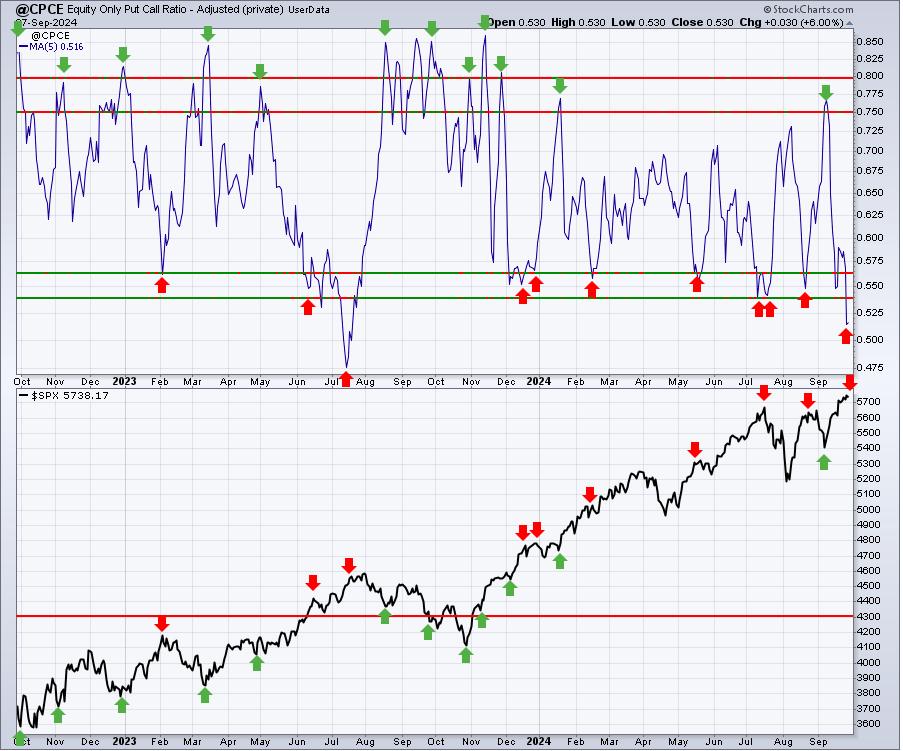
This 5-day moving average has hit its lowest level since July 2023, which coincided with a significant top, just before an oncoming correction. It doesn't suggest we'll see selling of that magnitude, but it does suggest that the risk of being long in the near-term has grown rather significantly.
253-day SMA ($CPCE)
Now the good news. The recent bullishness in the market has led to this 253-day moving average rolling over. These types of moves lower are indicative of a healthy stock market rise. While the 5-day moving average tells us to be cautious near-term, the drop in this 253-day moving average says this secular bull market advance is NOT over.
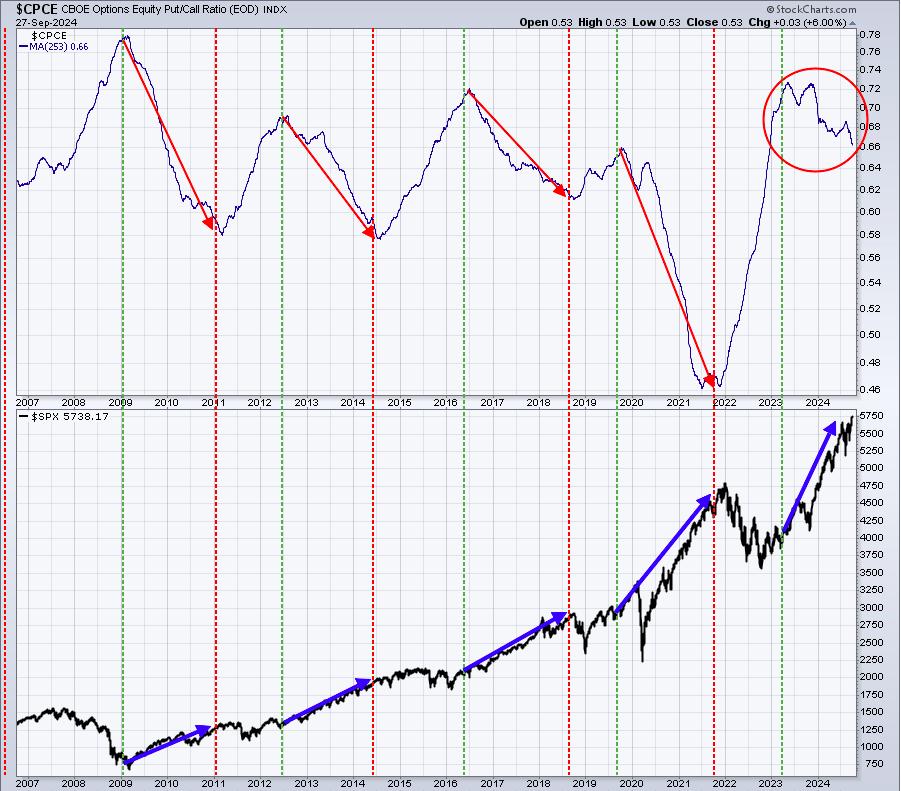
A short-term selloff would be buyable ahead of what I believe will be a strong rally into year end and/or early 2025.
Long-Term Trade Setup
Since beginning this Weekly Market Report over one year ago, I've discussed the long-term trade candidates below that I really like. Generally, these stocks have excellent long-term track records and many pay nice dividends that mostly grow every year. Only in very specific cases (exceptions) would I consider a long-term entry into a stock that has a poor or limited long-term track record and/or pays no dividends. Below is a quick recap of what I saw on each stock as of action last week:
- JPM - bad day recently when net interest income guidance was lowered; still in nice uptrend
- BA - broke 160 price support, appears poised to potentially test the 120 support area from 2022
- FFIV - performing much better than peers, expect higher prices into year end
- MA - strong trend remains in play
- GS - short-term pullback looks buyable ahead of likely Q4 rally
- FDX - earnings this week, will it clear key price resistance from 300-310?
- AAPL - 200 looks like solid short-term support
- CHRW - lots of resistance in 100-110 range, need to clear to get higher prices
- JBHT - excellent price support in 150-160 range, consolidating for now
- STX - uptrend intact, looking for a sustained move through 110
- HSY - consolidating for a year now; AD line suggesting a potential breakout to the upside
- DIS - a definitive breakout above 92 would improve short-term chart, long-term remains weak
- MSCI - still slowly grinding to the upside
- SBUX - still trending higher from new CEO announcement in August
- KRE - nice uptrend in play; expect more upside with rate cuts on the horizon
- ED - solid dividend payer now adding up capital appreciation as well
- AJG - one of the steadiest 2024 uptrends that you'll find
- NSC - attempted to clear 260; ultimately doing so could set up major test at 280
- RHI - just added one week ago, so far moving slightly higher
Keep in mind that our Weekly Market Reports favor those who are more interested in the long-term market picture. Therefore, the list of stocks above are stocks that we believe are safer (but nothing is ever 100% safe) to own with the long-term in mind. Nearly everything else we do at EarningsBeats.com favors short-term momentum trading, so I wanted to provide an explanation of what we're doing with this list.
Because September is historically a very poor month in terms of stock performance, it should make sense that it's also a great time to be considering buying opportunities. We started our list last September and we added 5 stocks in September and another 4 in October. That's one reason why the performance of many of these stocks has been so strong. While I could see more market struggles ahead for perhaps the next few weeks, adding solid long-term performers is something we will do. Given the short-term warning sign from options, we won't add any long-term stocks today, but I do expect to add at least a few additional stocks to this long-term portolio during October.
Please keep in mind that I'm not a Registered Investment Advisor and am only providing (mostly) what I believe to be solid dividend-paying stocks for the long-term. Companies periodically go through adjustments, new competition, restructuring, management changes, etc. that can have detrimental long-term impacts. The stock price nor the dividend is ever guaranteed. I simply point out interesting stock candidates for longer-term investors. Do your own due diligence and please consult with your financial advisor before making any purchases of securities.
Looking Ahead
Upcoming Earnings:
This is a very slow period for company earnings, as you can see below. This is NOT a list of ALL companies reporting this week, so please be sure to check for earnings of any companies that you own or add. Any companies in BOLD represent stocks in one of our Portfolios:
- Monday: CCL ($21 billion)
- Tuesday: NKE ($134 billion), PAYX ($48 billion)
- Wednesday: None
- Thursday: STZ ($46 billion)
- Friday: None
Key Economic Reports:
- Monday: September Chicago PMI
- Tuesday: September PMI manufacturing, August construction spending, August JOLTS
- Wednesday: September ADP employment report
- Thursday: Initial jobless claims, August factory orders, September ISM services index
- Friday: September nonfarm payrolls
Historical Data
I'm a true stock market historian. I am absolutely PASSIONATE about studying stock market history to provide us more clues about likely stock market direction and potential sectors/industries/stocks to trade. While I don't use history as a primary indicator, I'm always very aware of it as a secondary indicator. I love it when history lines up with my technical signals, providing me much more confidence to make particular trades.
Below you'll find the next two weeks of historical data and tendencies across the 3 key indices that I follow most closely:
S&P 500 (since 1950)
- Sep 30: -24.02%
- Oct 1: +58.69%
- Oct 2: +39.47%
- Oct 3: -10.67%
- Oct 4: +42.34%
- Oct 5: +66.17%
- Oct 6: +35.15%
- Oct 7: -31.55%
- Oct 8: +1.83%
- Oct 9: -65.58%
- Oct 10: +12.19%
- Oct 11: +25.83%
- Oct 12: +10.11%
- Oct 13: +66.86%
NASDAQ (since 1971)
- Sep 30: -1.20%
- Oct 1: +26.47%
- Oct 2: -45.81%
- Oct 3: -7.64%
- Oct 4: +50.70%
- Oct 5: +41.24%
- Oct 6: +0.80%
- Oct 7: -72.97 %
- Oct 8: -6.14%
- Oct 9: -55.75%
- Oct 10: +15.76%
- Oct 11: +79.41%
- Oct 12: +38.25%
- Oct 13: +124.64%
Russell 2000 (since 1987)
- Sep 30: +46.51%
- Oct 1: -16.74%
- Oct 2: -76.72%
- Oct 3: -79.35%
- Oct 4: +74.54%
- Oct 5: +31.68%
- Oct 6: -24.21%
- Oct 7: -159.66%
- Oct 8: -69.95%
- Oct 9: -152.21%
- Oct 10: +111.11%
- Oct 11: +11.78%
- Oct 12: +8.61%
- Oct 13: +80.92%
The S&P 500 data dates back to 1950, while the NASDAQ and Russell 2000 information date back to 1971 and 1987, respectively.
Final Thoughts
We've seen a few strong weeks in U.S. stocks after opening up the month of September in very weak fashion. While it's unusual to see this type of September strength, it's not unprecedented. August, September, and October are typically the months when market weakness fades and a strong Q4 follows. Heading into October 2004, here are a few things to consider
- The Fed. While there won't be any Fed meetings during the month of October, there'll be plenty of discussion about what they'll do at their next scheduled meeting on November 6th and 7th.
- Banks. The lowering of rates on the short end of the yield curve should help banks, especially small banks. This anticipated strength, however, is continuing to be met with a ton of resistance.
- Jobs. Friday will mark the next nonfarm payrolls report, this time for September. Economists continue to expect a solid, if not robust, report with new jobs expected to come in at 132,500, just slightly below the prior month's reading of 142,000.
- Election. We're now within 5 weeks of the 2024 Presidential Election. If uncertainties are going to be a problem for the stock market, I'd expect to see that uncertainty kick in over the next 1-2 weeks
- Options. The 5-day CPCE has fallen to .52, which is the lowest 5-day reading since July 2023. While this certainly does not guarantee us a period of selling, the chart shown earlier does tell us the odds have increased that perhaps we're at or very close to a short-term market top.
Feedback
If you'd like to share your thoughts on our Weekly Market Report, positive or negative, you can reach us at "[email protected]".
Happy trading!
Tom