
EB Weekly Market Report - Monday, October 14, 2024
ChartLists Updated
There were no ChartLists updated over the weekend as there was little earnings activity last week. ChartLists will be updated later this week.
Weekly Market Recap
Major Indices
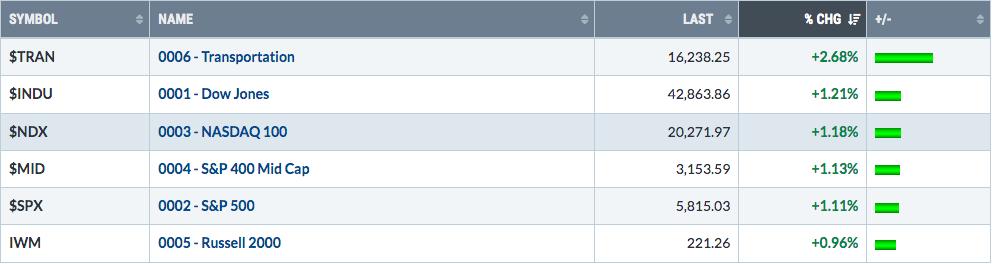
The Dow Jones set a new all-time high close on Friday, as it approached 43000. Likewise, the S&P 500 set a new all-time high, eclipsing the 5800 level for the first time ever on Friday. There was a 3rd major index to set an all-time high on Friday - the S&P 400 Mid Cap Index - as it finally managed to clear four previous tops:
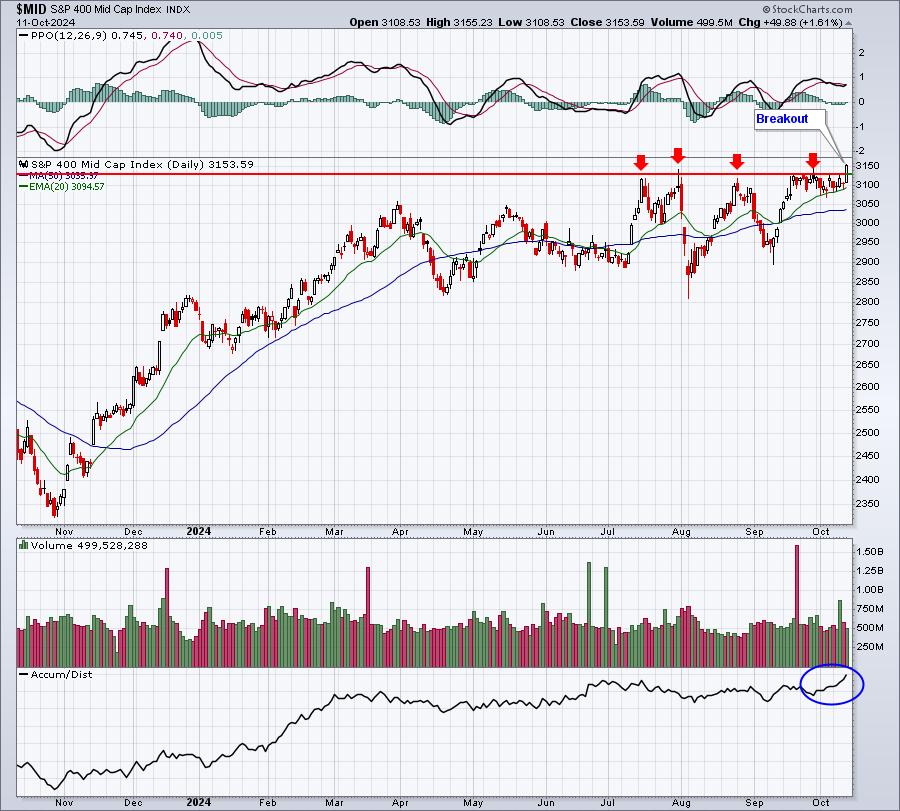
The AD line, which had been struggling, also moved higher to confirm this breakout. While many think of mid-cap stocks as having market valuations between $2 and $10 billion, in reality the largest company in the S&P 400 Mid Cap Index is Illumina, Inc. (ILMN), which currently has a market cap of $23.1 billion.
Sectors
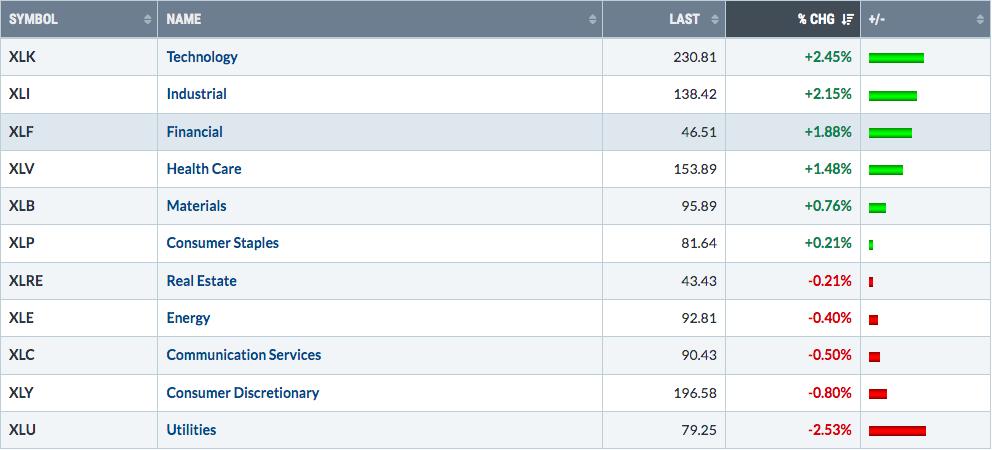
The two most interesting sector charts to me are real estate (XLRE), bouncing off 50-day SMA support, and communication services (XLC), breaking out to another all-time high:
XLRE:
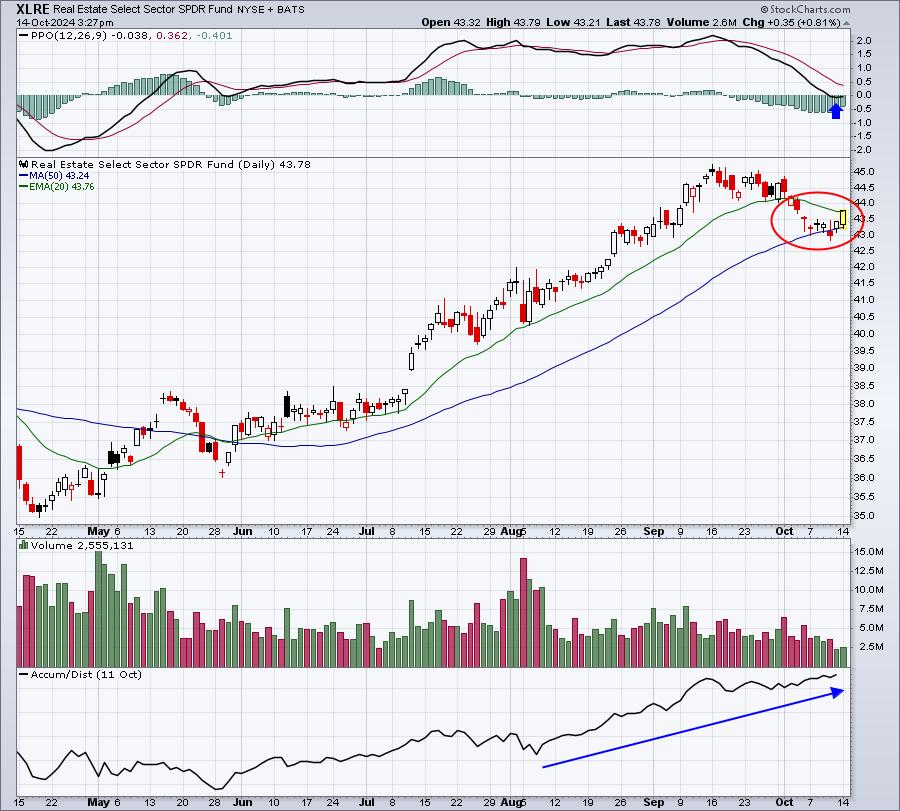
Despite the recent pullback in real estate, check out that AD line. It didn't budge lower. Sure seems like this sector is being accumulated, which makes sense if interest rates are expected to drop.
XLC:
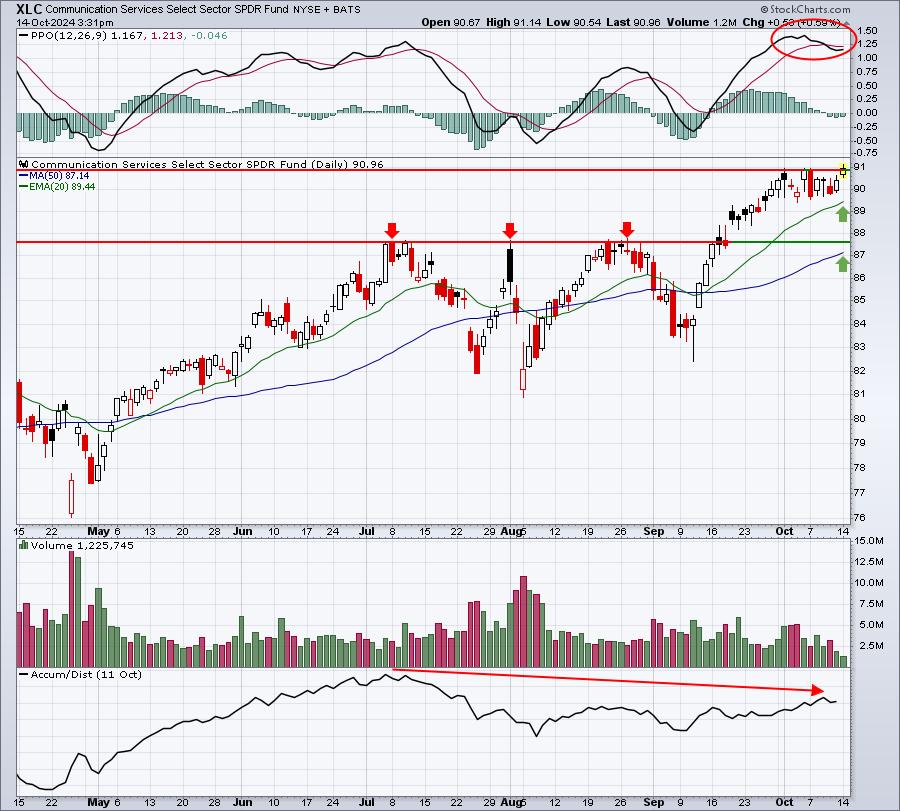
The XLC set a new record intraday, but will it hold into the close? If not, the PPO has rolled over and the AD line is clearly much weaker on the XLC than it is on the XLRE. If we do run into any sort of short-term market trouble, the XLC is a sector that I could easily see test moving average or price support.
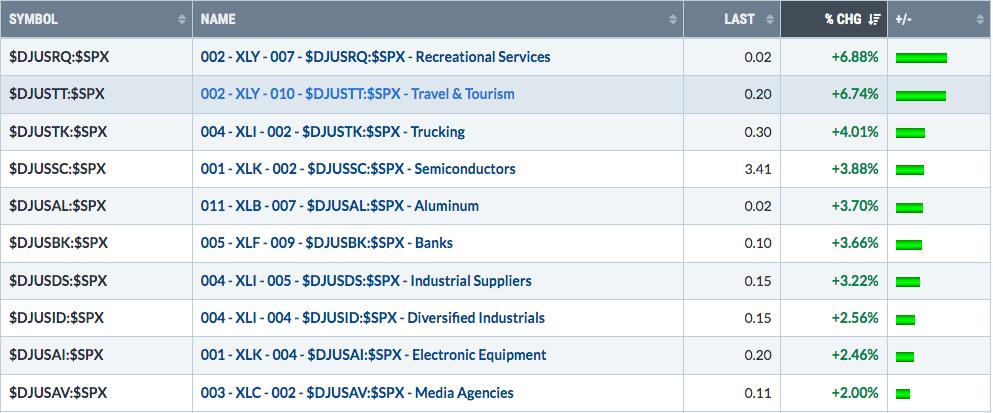
Top 10 Industries Last Week
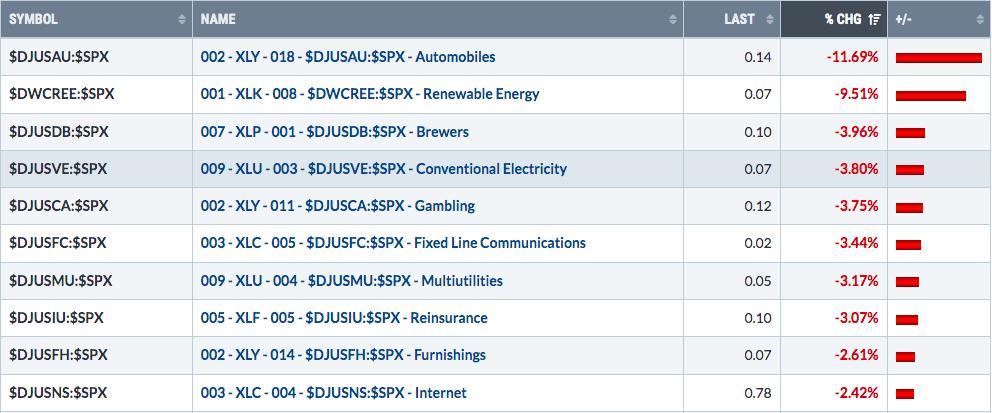
Bottom 10 Industries Last Week
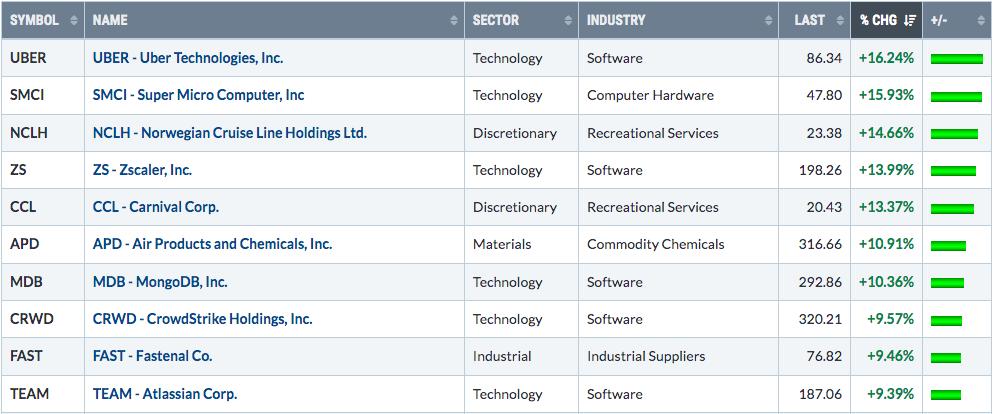
Top 10 Stocks - S&P 500/NASDAQ 100
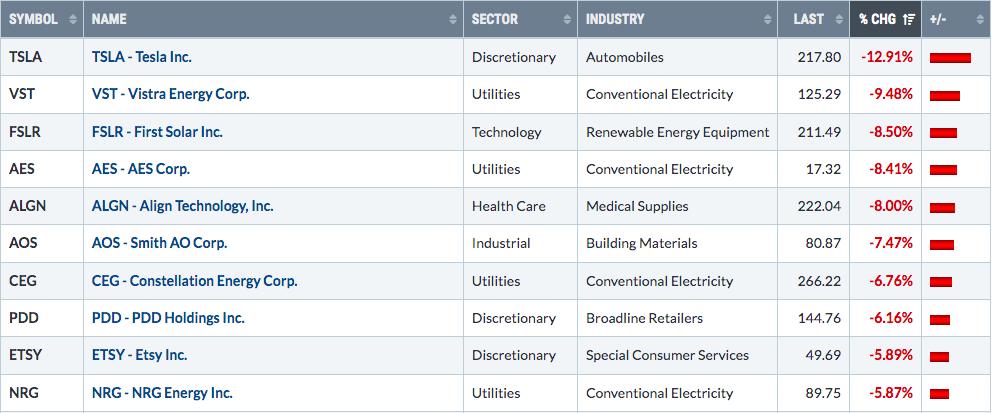
Bottom 10 Stocks - S&P 500/NASDAQ 100
Big Picture
Here's an update of the Big Picture, 100-year chart of the S&P 500:
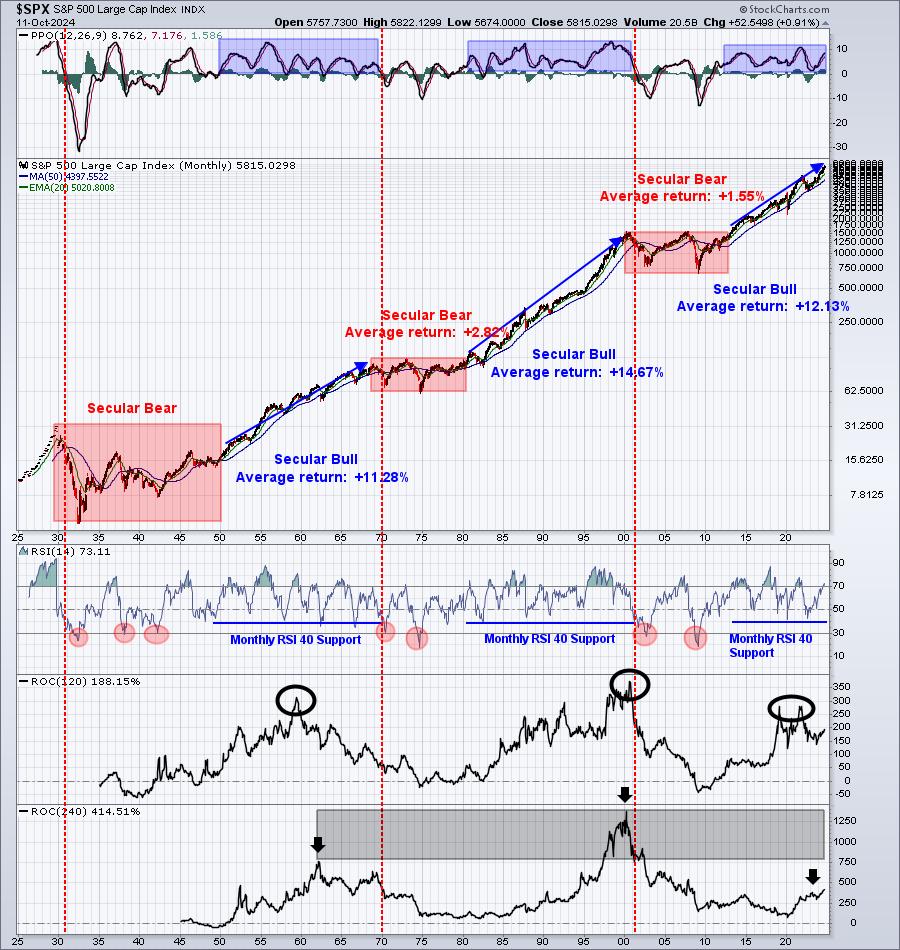
The long-term chart remains perfectly intact from a long perspective. The monthly PPO is approaching 9, but we've seen it reach anywhere from 10 to 13 in the past, before taking a break. So my guess is that we'll likely see strength continue in the S&P 500, possibly reaching the 6000-6250 level this quarter, and then cooling a bit in Q1 2025.
Stay long-term bullish.
Rotation/Intermarket Analysis
Here's the latest look at our key intraday ratios as we follow where the money is traveling on an INTRADAY basis (ignoring gaps):
QQQ:SPY
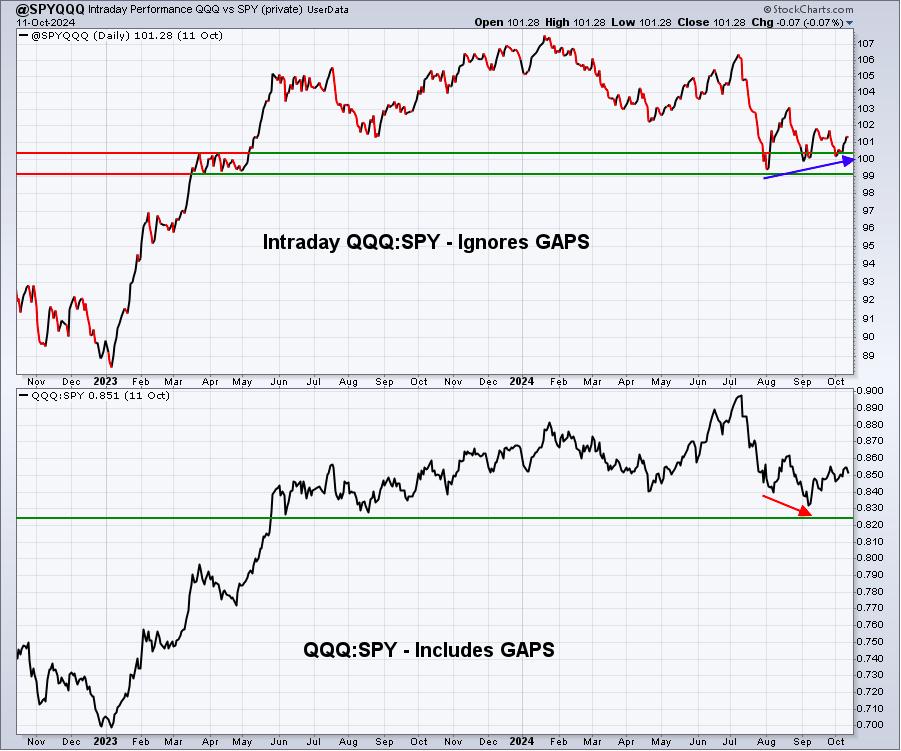
We saw slight improvement in this QQQ:SPY ratio last week, so it does appear that the QQQ is playing "catch up" with its more value-oriented counterpart. Overall, I see this chart at bullish.
Remember, this chart is actually calculated QQQ:SPY, despite its "@SPYQQQ" name.
IWM:QQQ
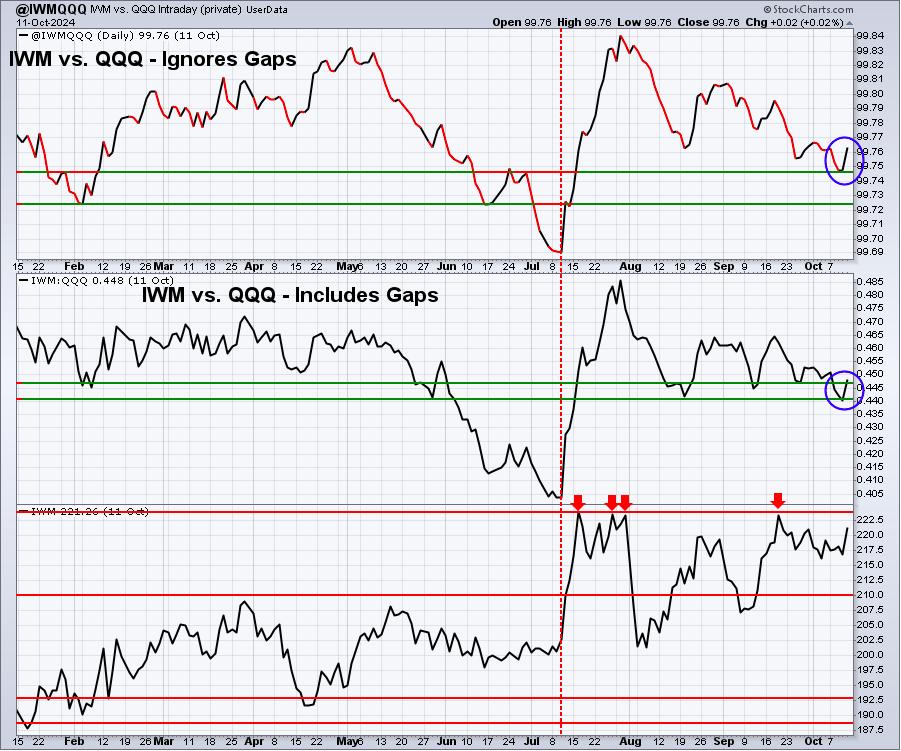
I like the turn higher in this IWM:QQQ ratio near support. I'd like to see this continue higher into the foreseeable future.
XLY:XLP
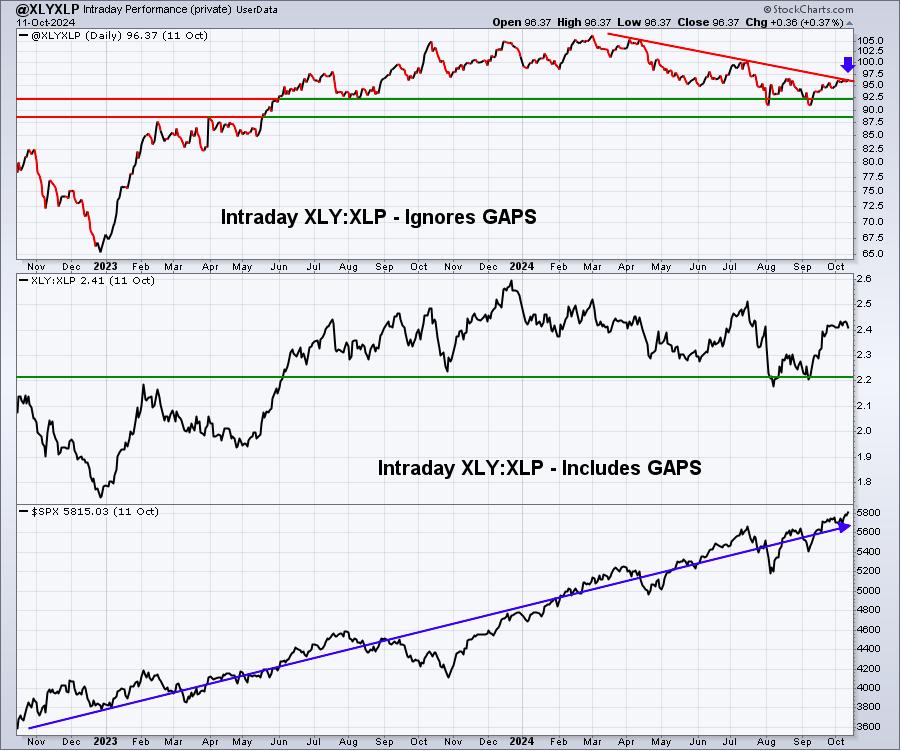
The rally in the S&P 500 is quite evident. The XLY:XLP ratio moved higher until early 2024, at which time we've seen some relative weakness/consolidation. That can make a further advance quite difficult. However, the top panel shows the intraday XLY:XLP ratio on the verge of a possible relative breakout. If it occurs, it would be a bullish development.
Sentiment
5-day SMA ($CPCE)
The 5-day moving average of the CPCE remains very low and generally coincides with short-term market tops. Low readings indicate complacency, which typically tells us that the S&P 500 has run too far. Here's the current reading:
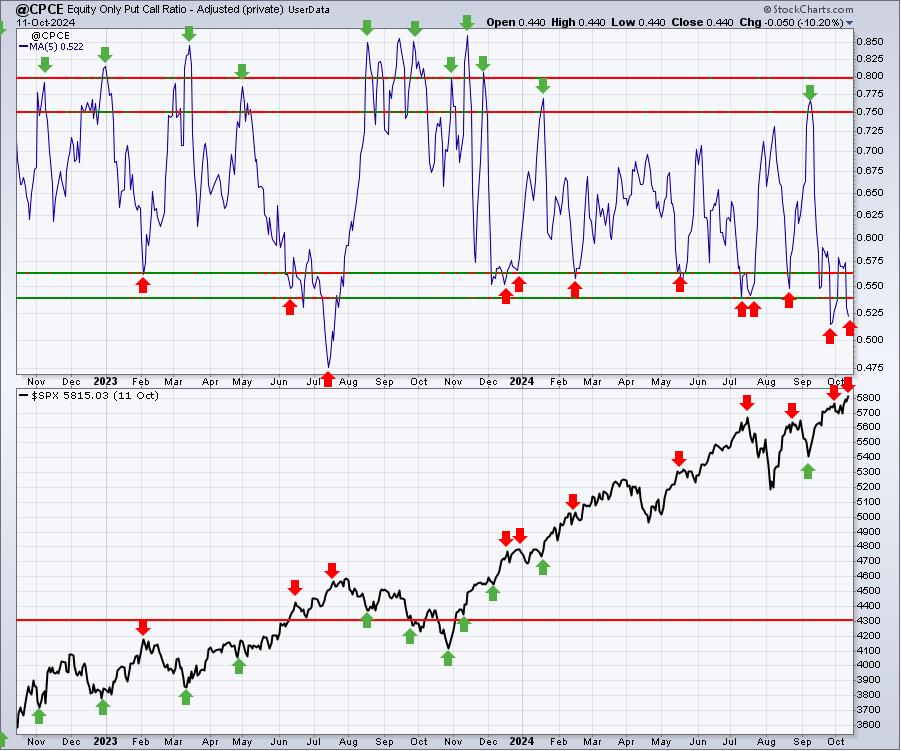
But here's the problem. We have many short-term signals and the CPCE is only one of them. This particular signal says a top very well could be at hand, but others remain quite bullish. And the key signal is the combination of price/volume. Right now, price action says we're going higher and secular bull markets are hard to argue with.
253-day SMA ($CPCE)
The long-term 253-day moving average keeps pushing lower and that, historically, has been undeniably bullish. These types of moves lower are indicative of a healthy stock market rise. This chart absolutely supports higher prices later this quarter and into 2025:
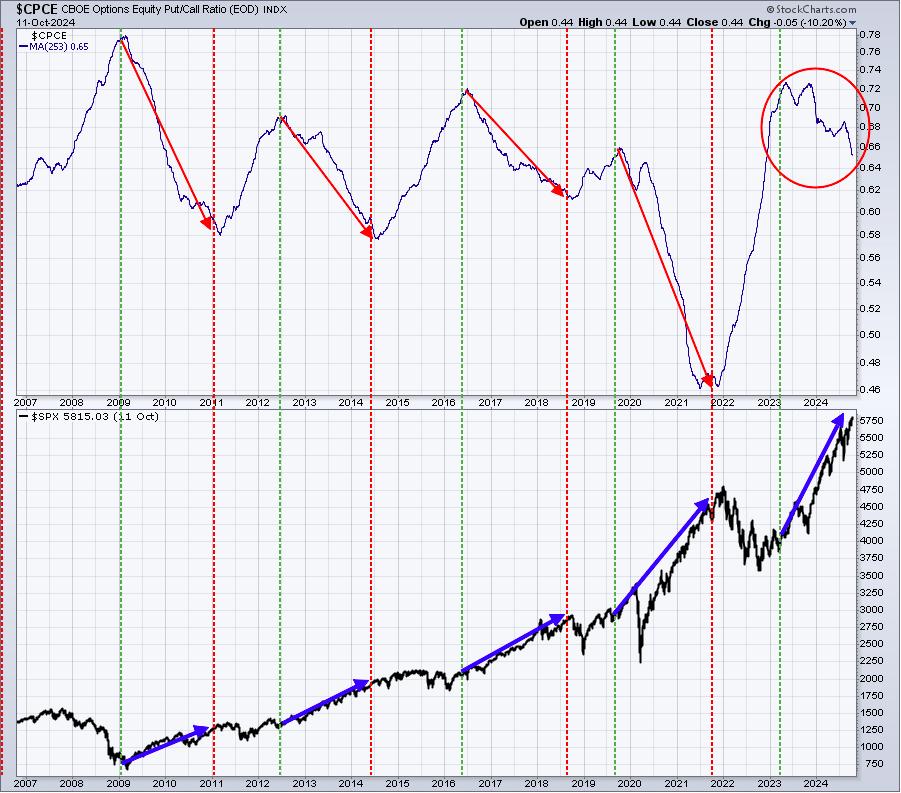
Near-term market weakness would be a buying opportunity, in my opinion.
Divergences
Momentum can play a key role in whether an advance continues or not. While I just discussed weakness and a possible short-term top with respect to sentiment, divergences are suggesting quite the opposite. Daily PPOs (not pictured below) are strengthening and appear to support higher prices ahead, but this is a longer-term review of the market. So let's look at the S&P 500's monthly PPO:
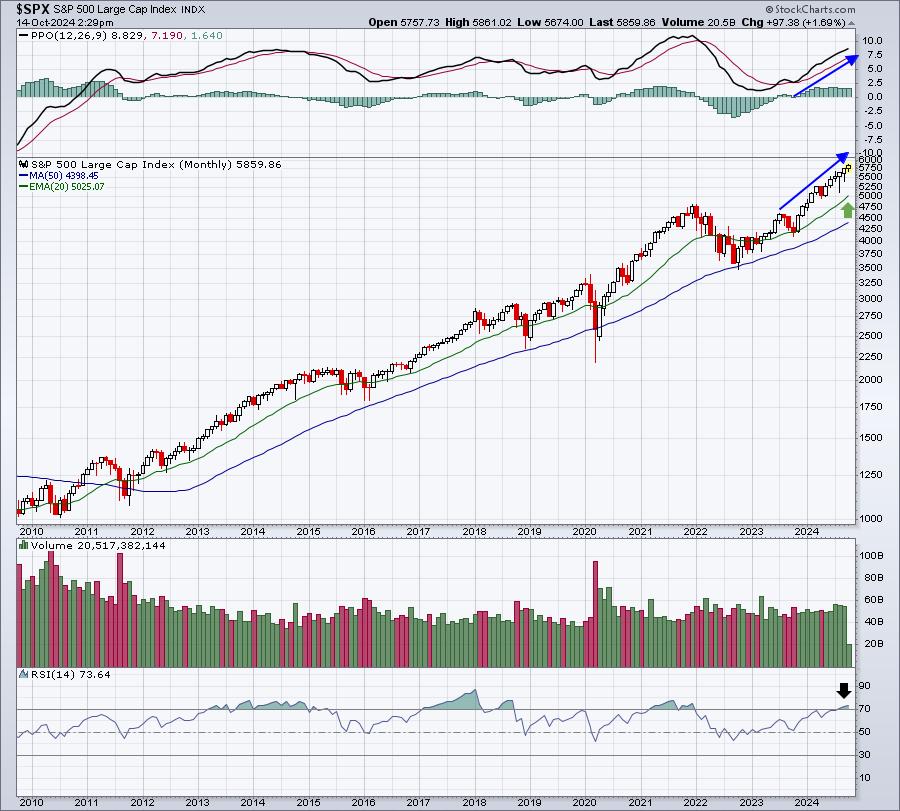
I see an excellent PPO, quite bullish, as it keeps rising off of its recent near center line test from the beginning of 2023. The cyclical bear market did its job and now the secular bull market is firmly in charge. Are we overbought? The monthly RSI would say yes, but we know that overbought can remain overbought for a long time.
Long-Term Trade Setup
Since beginning this Weekly Market Report over one year ago, I've discussed the long-term trade candidates below that I really like. Generally, these stocks have excellent long-term track records and many pay nice dividends that mostly grow every year. Only in very specific cases (exceptions) would I consider a long-term entry into a stock that has a poor or limited long-term track record and/or pays no dividends. Below is a quick recap as of last week:
- JPM - weekly chart shows negative divergence, but rising 20-week EMA shows great support thus far
- BA - remains one of the weakest stocks since the pandemic began, test of 120 price support is possible
- FFIV - uptrend and bullish momentum remains in play
- MA - July 50-week SMA test has led to solid action for past 10-11 weeks or so
- GS - looks a lot like JPM technically, as rising 20-week EMA continues to provide support during advance
- FDX - earnings helped FDX test overhead support near 301, now 240-250 support looks solid
- AAPL - price support at 200 should be solid and the 20-week EMA held earlier in September
- CHRW - hit 110 this week to test key overhead price resistance from August 2022
- JBHT - rough week, but 150-160 support still looks solid
- STX - been trending higher for nearly 2 years now
- HSY - lengthy sideways consolidation continues; dividend remains healthy
- DIS - a BA-type chart, wandering not too far above MAJOR long-term support at 80
- MSCI - I seen building strength in MSCI and expect a rally to 650 by year end
- SBUX - definitely much better off technically since the new CEO from Chipotle was announced
- KRE - still trending higher and I love this area of the market in Q4 and into 2025
- ED - struggling to clear 105 currently, but uptrend remains intact
- AJG - bouncing off recent 20-week EMA test
- NSC - railroads strong off the June low, NSC following suit
- RHI - recent push higher cleared 20-week EMA, a short-term positive development
Keep in mind that our Weekly Market Reports favor those who are more interested in the long-term market picture. Therefore, the list of stocks above are stocks that we believe are safer (but nothing is ever 100% safe) to own with the long-term in mind. Nearly everything else we do at EarningsBeats.com favors short-term momentum trading, so I wanted to provide an explanation of what we're doing with this list.
We're now into October and this is usually a great month to buy stocks as the best historical period of the calendar year is rapidly approaching. Before we get to that period, however, we also need to be aware of the October 21st close - October 27th close, as this is the worst 1-week period of the year historically. Check out the historical upcoming returns in the "Looking Ahead" section below.
Please keep in mind that I'm not a Registered Investment Advisor (and neither is EarningsBeats.com nor any of its employees) and am only providing (mostly) what I believe to be solid dividend-paying stocks for the long-term. Companies periodically go through adjustments, new competition, restructuring, management changes, etc. that can have detrimental long-term impacts. The stock price nor the dividend is ever guaranteed. I simply point out interesting stock candidates for longer-term investors. Do your own due diligence and please consult with your financial advisor before making any purchases of securities.
Looking Ahead
Upcoming Earnings:
Q3 earnings season is just starting. This is NOT a list of ALL companies reporting this week, so please be sure to check for earnings of any companies that you own or add. Any companies in BOLD represent stocks in one of our Portfolios:
- Monday: None
- Tuesday: UNH ($552 billion), JNJ ($386 billion), BAC ($310 billion), GS ($159 billion)
- Wednesday: ASML ($328 billion), ABT ($201 billion), CSX ($68 billion)
- Thursday: TSM ($964 billion), NFLX ($313 billion), ISRG ($172 billion)
- Friday: PG ($399 billion), AXP ($192 billion), SLB ($63 billion)
Key Economic Reports:
- Monday: None
- Tuesday: October empire state manufacturing index
- Wednesday: None
- Thursday: Initial jobless claims, September retail sales, October Philadelphia Fed Manufacturing Index, September industrial production & capacity utilization, August business inventories, October housing market index
- Friday: September housing starts & building permits
Historical Data
I'm a true stock market historian. I am absolutely PASSIONATE about studying stock market history to provide us more clues about likely stock market direction and potential sectors/industries/stocks to trade. While I don't use history as a primary indicator, I'm always very aware of it as a secondary indicator. I love it when history lines up with my technical signals, providing me much more confidence to make particular trades.
Below you'll find the next two weeks of historical data and tendencies across the 3 key indices that I follow most closely:
S&P 500 (since 1950)
- Oct 14: +2.82%
- Oct 15: -10.14%
- Oct 16: -4.60%
- Oct 17: -0.19%
- Oct 18: +62.86%
- Oct 19: -131.47%
- Oct 20: +85.59%
- Oct 21: +62.18%
- Oct 22: -90.58%
- Oct 23: -5.88%
- Oct 24: -28.56%
- Oct 25: -42.80%
- Oct 26: -60.52%
- Oct 27: -26.14%
NASDAQ (since 1971)
- Oct 14: +20.39%
- Oct 15: +4.64%
- Oct 16: -0.13%
- Oct 17: -33.41%
- Oct 18: +29.25%
- Oct 19: -83.58%
- Oct 20: +0.19%
- Oct 21: +148.28%
- Oct 22: -58.57%
- Oct 23: -37.77%
- Oct 24: -61.34%
- Oct 25: -40.09%
- Oct 26: -115.08%
- Oct 27: -73.58%
Russell 2000 (since 1987)
- Oct 14: +37.61%
- Oct 15: +10.16%
- Oct 16: +132.83%
- Oct 17: -43.28%
- Oct 18: +8.28%
- Oct 19: -18.45%
- Oct 20: +59.74%
- Oct 21: +50.68%
- Oct 22: -40.78%
- Oct 23: -41.09%
- Oct 24: -62.67%
- Oct 25: +6.43%
- Oct 26: -13.96%
- Oct 27: -132.36%
The S&P 500 data dates back to 1950, while the NASDAQ and Russell 2000 information date back to 1971 and 1987, respectively.
Final Thoughts
Mid caps ($MID) have joined both the Dow Jones and S&P 500 in all-time record high territory. The NASDAQ 100 and Russell 2000 aren't too far behind. This suggests that Wall Street loves what it sees during the balance of Q4 and into 2025 as the Fed likely cuts rates further. Investors recently have been ditching treasuries as the 10-year treasury yield has jumped to 4.10%, though the bond market is closed today. Looking into the balance of this week, here's what I'm watching:
- Financials (XLF) and Industrials (XLI). I've mentioned many times over the past several weeks how much financials and industrials love Q4. Well, it's happening again as the XLF and XLI keep trading higher and higher, setting new all-time highs in the process. Nearly every industry group in the XLF is on fire right now.
- Banks ($DJUSBK). This group broke out on Friday and set a new 52-week high. The DJUSBK appears poised to challenge its 2022 high near 645. Currently, it's trading at 611.
- Retail Sales. Let's keep watching for economic deterioration. It looks to me like the Fed might be able to pull off a soft landing, which is essentially raising rates to fight inflation and then bringing down those rates without the higher rates causing an economic recession. Jobs remain strong, but retail sales should be watched closely as well.
- Initial Claims. We saw initial claims spike to nearly 260,000 last week and the forecast this Thursday is for another 265,000 initial claims. Hurricane Helene is being blamed for the temporary surge in claims, so it's be interesting to see if initial claims remain high for several weeks or if they quickly return to the 200,000-225,000 range.
- Election. Let's don't forget there's a Presidential Election in a few weeks. Historically, this has caused a bit of market weakness, but this year has been different than most election years - at least so far.
- Sentiment. Talk about a mixture of signals! The 5-day moving average of the equity only put call ratio ($CPCE) says SELL NOW, but the 253-day moving average of the CPCE tells us the market is still very likely to move much higher. So which risk is bigger - being on the sidelines while new all-time highs are established, or being invested full throttle with the potential of near-term weakness? That's a question to be answered by each individual. What I'll continue saying, however, is that I remain VERY bullish U.S. equities for the long-term.
Feedback
If you'd like to share your thoughts on our Weekly Market Report, positive or negative, you can reach us at "[email protected]".
Happy trading!
Tom