
EB Weekly Market Report - Monday, October 21, 2024
ChartLists Updated
Many of our ChartLists were updated over the weekend and are available for viewing/downloading on our website:
- Strong Earnings (SECL)
- Strong Future Earnings (SFECL)
- Raised Guidance (RGCL)*
- Strong AD (SADCL)
- Bullish Trifecta (BTCL)
- Short Squeeze (SSCL)
- Strong ETF (SETFCL)
- Model ETF Portfolio (MODETFCL)
- Daily Earnings ChartLists
- Upcoming Earnings Relative Strength ChartList
*Many earnings dates were changed as StockCharts seems to provide an "estimated" earnings date until companies formally announce when their earnings will be released. If you use the earnings dates on the RGCL, you definitely want to make sure you have the latest RGCL, because many have changed.
Weekly Market Recap
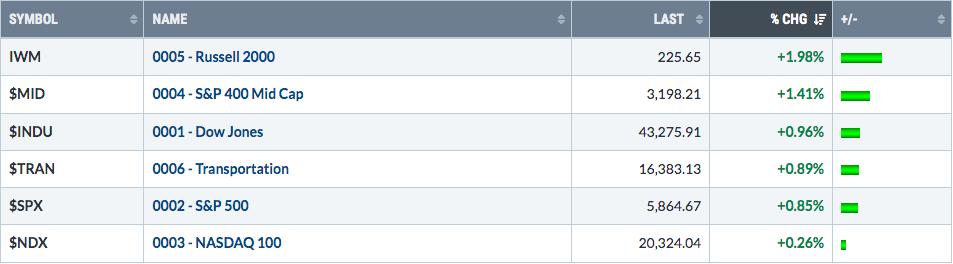
Major Indices
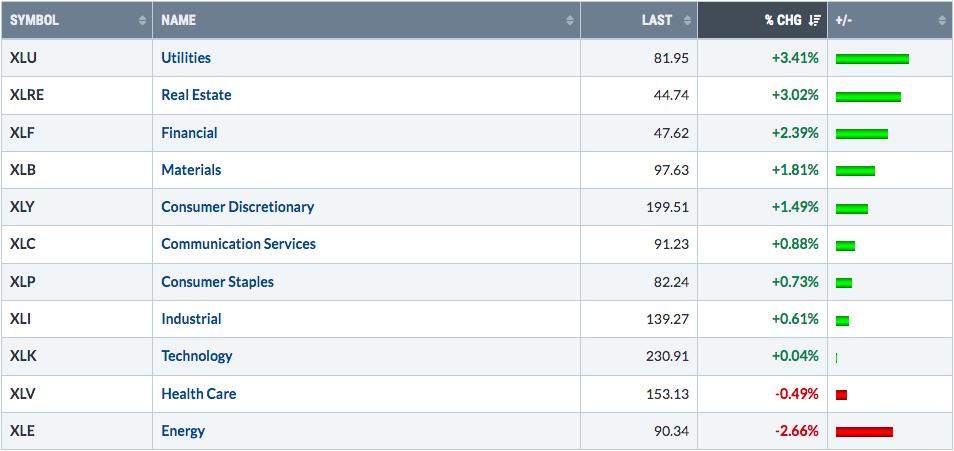
Sectors
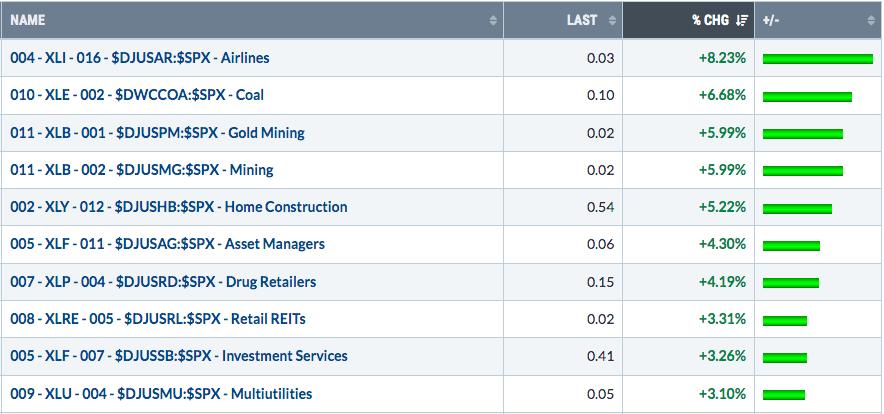
Top 10 Industries Last Week
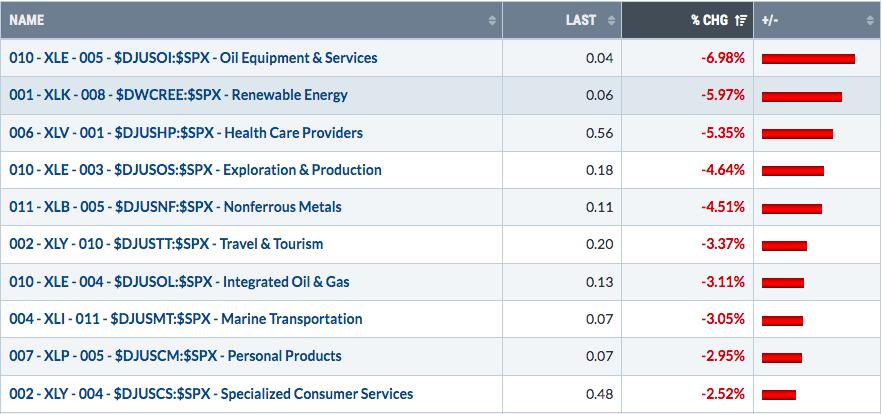
Bottom 10 Industries Last Week
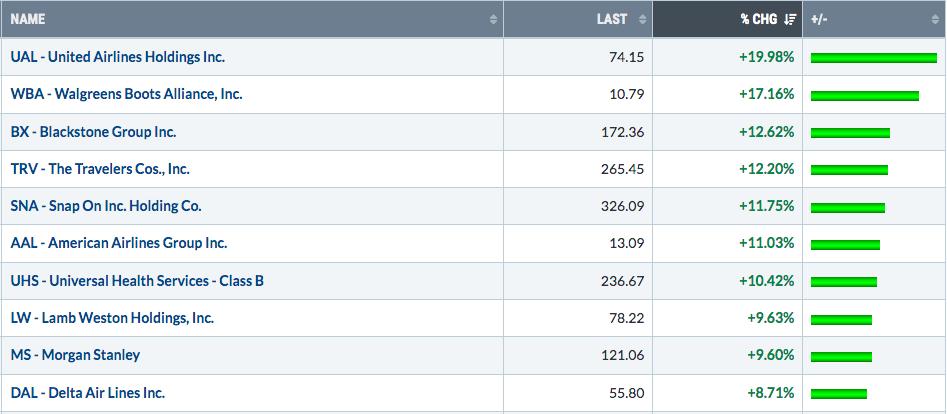
Top 10 Stocks - S&P 500/NASDAQ 100
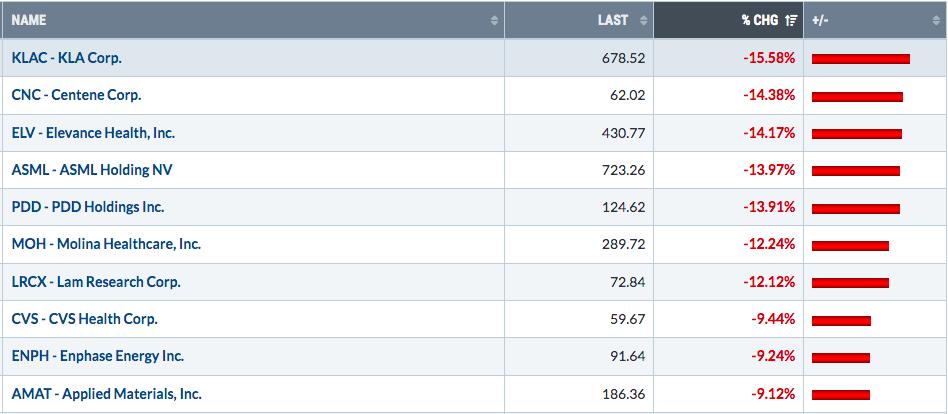
Bottom 10 Stocks - S&P 500/NASDAQ 100
Big Picture
Here's an update of the Big Picture, 100-year chart of the S&P 500:
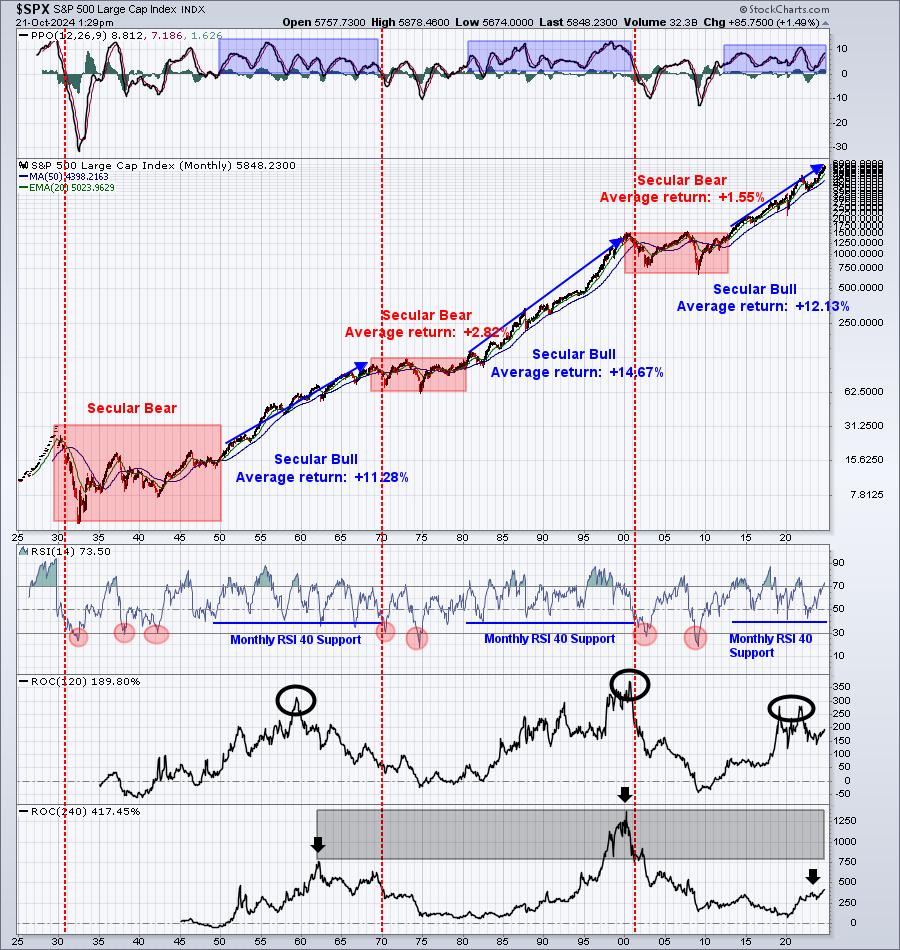
The strength continues as the S&P 500 climbs closer and closer to the psychological 6000 level.
Stay long-term bullish.
Rotation/Intermarket Analysis
Here's the latest look at our key intraday ratios as we follow where the money is traveling on an INTRADAY basis (ignoring gaps):
QQQ:SPY
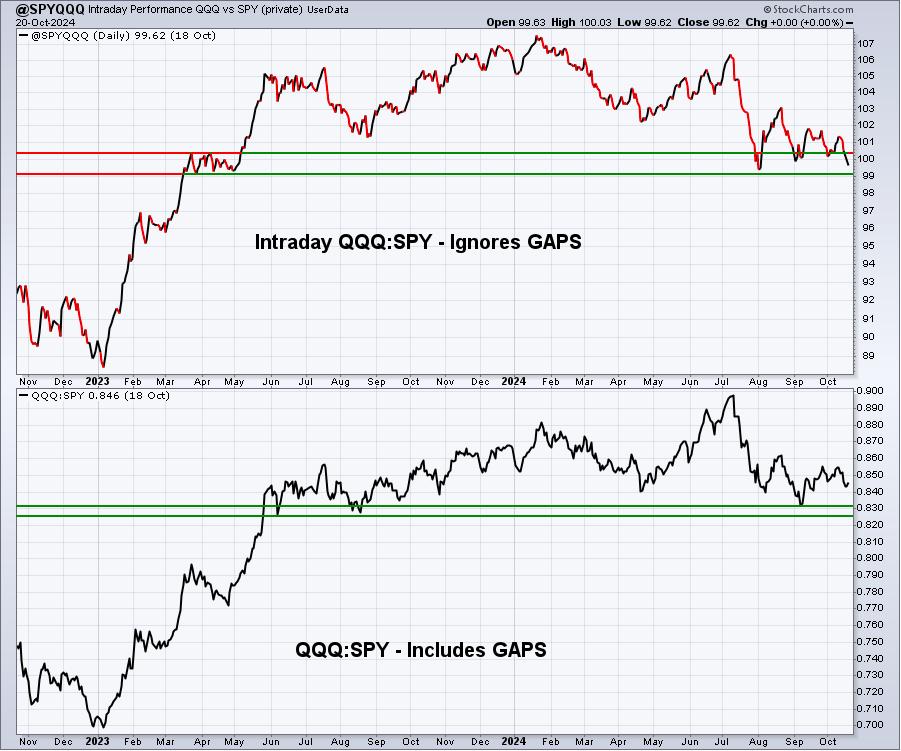
There was more rotation during the trading day last week from the QQQ to the SPY, but it's not too shocking considering that the October to December period typically favors more value-oriented stocks.
Remember, this chart is actually calculated QQQ:SPY, despite its "@SPYQQQ" name.
IWM:QQQ
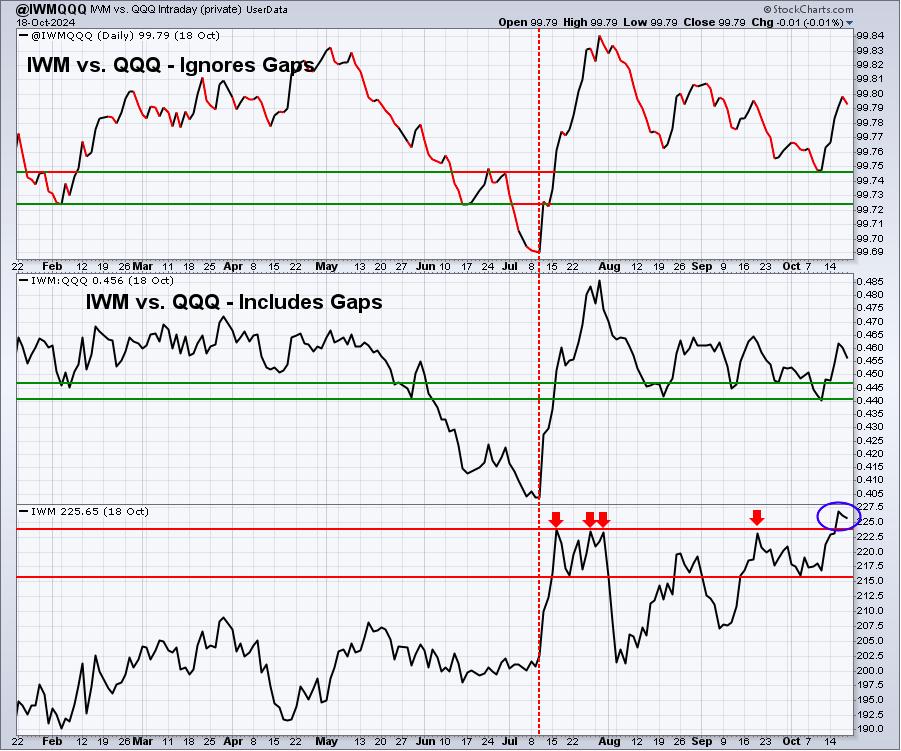
We've seen a very nice pop to the upside in the intraday IWM:QQQ ratio, helping to support the breakout we saw last week.
XLY:XLP
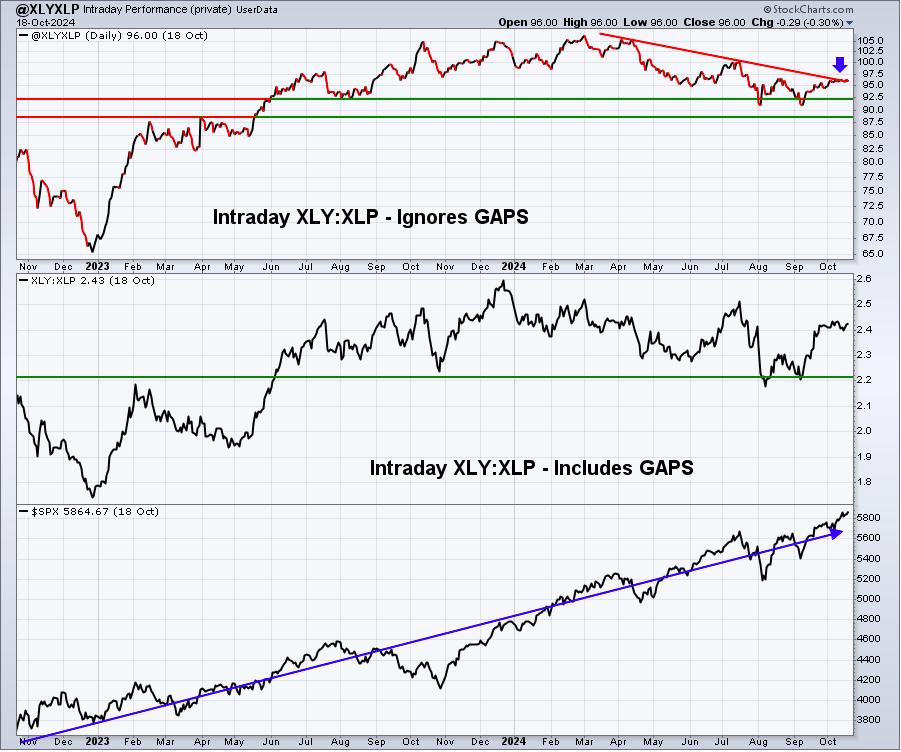
This ratio continues to hover on the 7-month downtrend line. I'd consider a break above this trendline to be bullish, if it occurs.
Sentiment
5-day SMA ($CPCE)
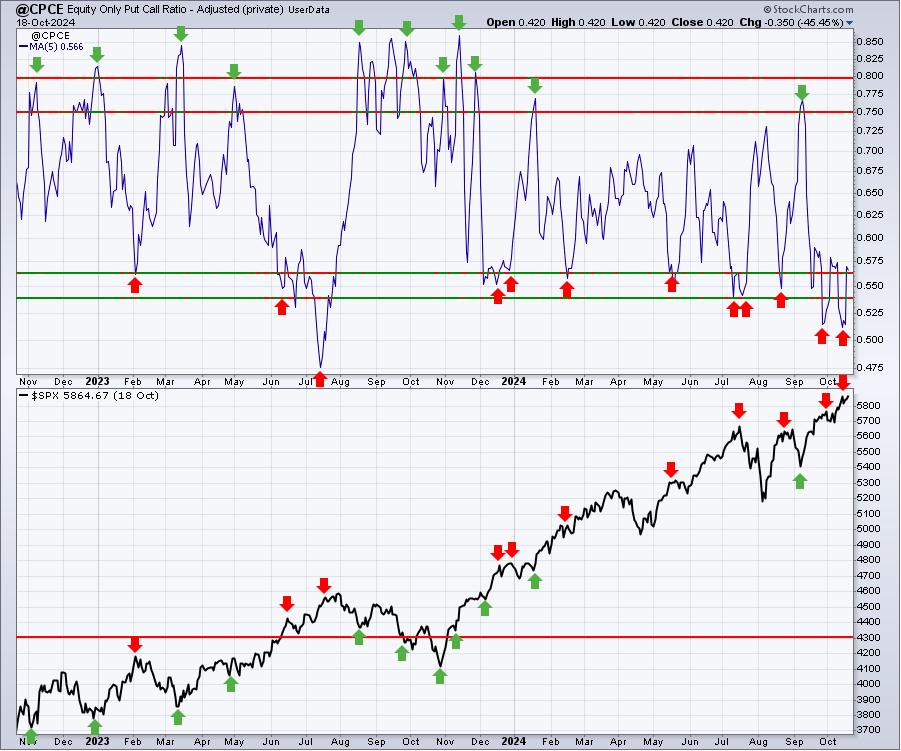
The complacency really hasn't budged much and stock prices kept moving higher last week. This signal is only a short-term signal, but it is clearly bearish.
253-day SMA ($CPCE)
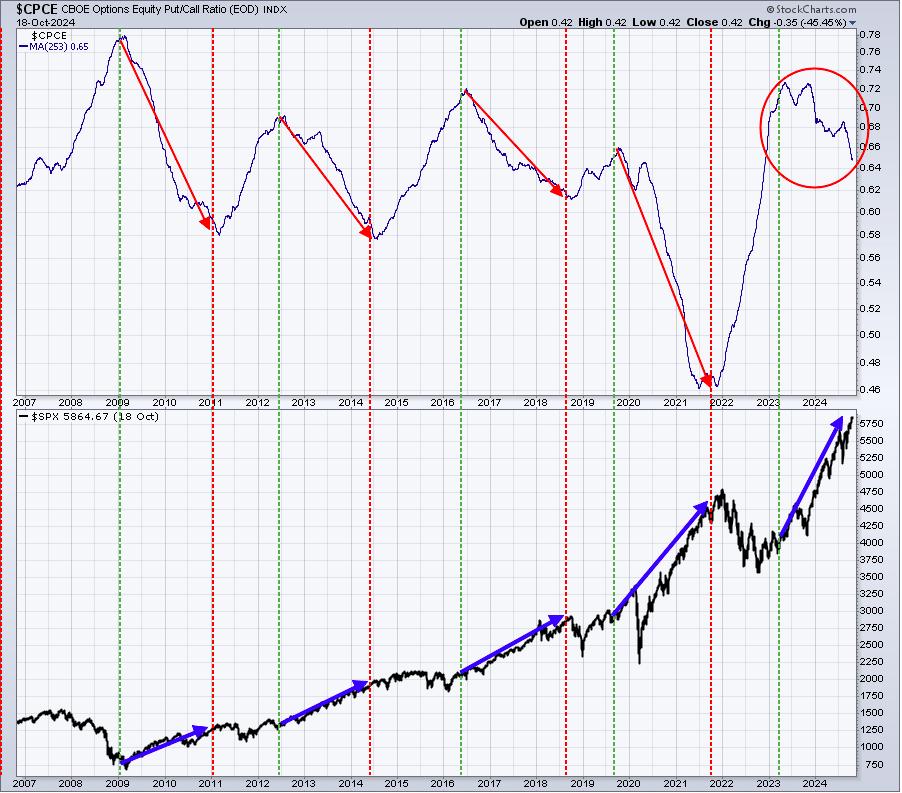
One big reason that stocks continue to rise is this long-term sentiment signal. It is in a very constructive downtrend as sentiment shifts from overwhelmingly bearish (which helps establish key market bottoms) to a more neutral state.
International Stocks
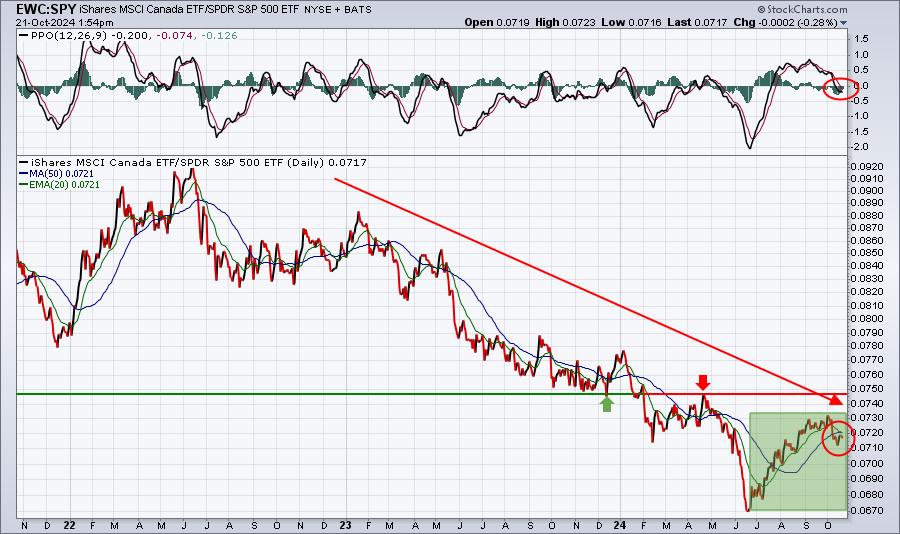
We don't generally talk much about international stocks, instead focusing on U.S. stocks. However, simply reviewing foreign indices against our benchmark S&P 500 is a very quick and simple way of remaining aware of the relative strength/weakness of foreign stocks. Currently, foreign stocks remain very weak relative to U.S. stocks, so being underweight foreign stocks still makes a lot of sense to me. Even the big China (FXI) run has worn off. Below are the two foreign ETFs that have perhaps the best charts relative to the SPY:
Canada (EWC):
China (FXI):
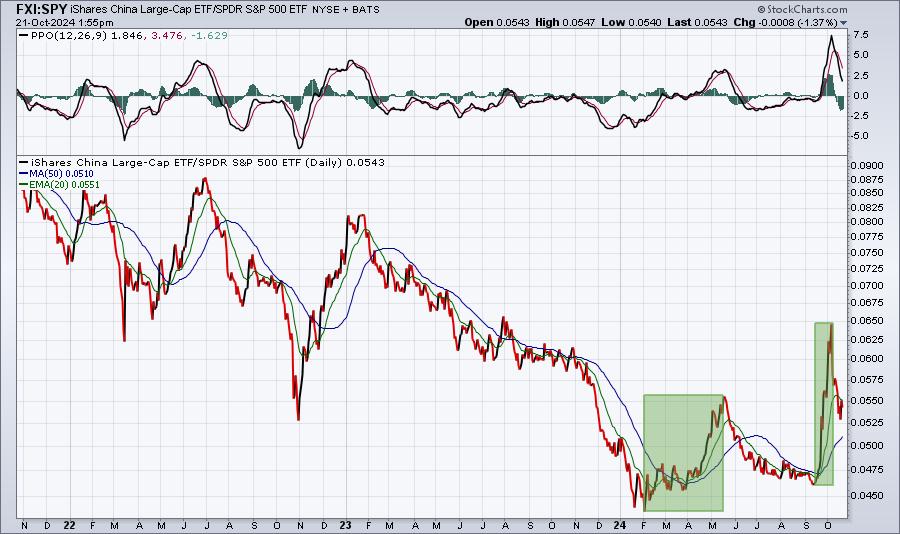
Both the EWC and the FXI have had their relative moments in 2024 and FXI actually has a better year-to-date return than the SPY, but it sure seems to me that the longer-term relative trend on both charts remains down.
Long-Term Trade Setup
Since beginning this Weekly Market Report over one year ago, I've discussed the long-term trade candidates below that I really like. Generally, these stocks have excellent long-term track records and many pay nice dividends that mostly grow every year. Only in very specific cases (exceptions) would I consider a long-term entry into a stock that has a poor or limited long-term track record and/or pays no dividends. Below is a quick recap from a couple weeks back:
- JPM - weekly chart shows negative divergence, but rising 20-week EMA shows great support thus far
- BA - remains one of the weakest stocks since the pandemic began, test of 120 price support is possible
- FFIV - uptrend and bullish momentum remains in play
- MA - July 50-week SMA test has led to solid action for past 10-11 weeks or so
- GS - looks a lot like JPM technically, as rising 20-week EMA continues to provide support during advance
- FDX - earnings helped FDX test overhead support near 301, now 240-250 support looks solid
- AAPL - price support at 200 should be solid and the 20-week EMA held earlier in September
- CHRW - hit 110 this week to test key overhead price resistance from August 2022
- JBHT - rough week, but 150-160 support still looks solid
- STX - been trending higher for nearly 2 years now
- HSY - lengthy sideways consolidation continues; dividend remains healthy
- DIS - a BA-type chart, wandering not too far above MAJOR long-term support at 80
- MSCI - I seen building strength in MSCI and expect a rally to 650 by year end
- SBUX - definitely much better off technically since the new CEO from Chipotle was announced
- KRE - still trending higher and I love this area of the market in Q4 and into 2025
- ED - struggling to clear 105 currently, but uptrend remains intact
- AJG - bouncing off recent 20-week EMA test
- NSC - railroads strong off the June low, NSC following suit
- RHI - recent push higher cleared 20-week EMA, a short-term positive development
Keep in mind that our Weekly Market Reports favor those who are more interested in the long-term market picture. Therefore, the list of stocks above are stocks that we believe are safer (but nothing is ever 100% safe) to own with the long-term in mind. Nearly everything else we do at EarningsBeats.com favors short-term momentum trading, so I wanted to provide an explanation of what we're doing with this list.
We're now into October and this is usually a great month to buy stocks as the best historical period of the calendar year is rapidly approaching. Before we get to that period, however, we also need to be aware of the October 21st close - October 27th close, as this is the worst 1-week period of the year historically. Check out the historical upcoming returns in the "Looking Ahead" section below. I'll look to add at least 3-4 stocks to this list next week as this bearish period comes to a close.
Please keep in mind that I'm not a Registered Investment Advisor (and neither is EarningsBeats.com nor any of its employees) and am only providing (mostly) what I believe to be solid dividend-paying stocks for the long-term. Companies periodically go through adjustments, new competition, restructuring, management changes, etc. that can have detrimental long-term impacts. The stock price nor the dividend is ever guaranteed. I simply point out interesting stock candidates for longer-term investors. Do your own due diligence and please consult with your financial advisor before making any purchases of securities.
Looking Ahead
Upcoming Earnings:
Q3 earnings season is just starting. This is NOT a list of ALL companies reporting this week, so please be sure to check for earnings of any companies that you own or add. Any companies in BOLD represent stocks in one of our Portfolios:
- Monday: SAP ($281 billion)
- Tuesday: GE ($209 billion), DHR ($196 billion), TXN ($181 billion)
- Wednesday: TSLA ($706 billion), KO ($301 billion), IBM ($68 billion), NOW ($189 billion)
- Thursday: SPGI ($964 billion), HON ($143 billion), UPS ($116 billion)
- Friday: HCA ($105 billion), CL ($82 billion)
Key Economic Reports:
- Monday: September leading indicators
- Tuesday: None
- Wednesday: September existing home sales
- Thursday: Initial jobless claims, October PMI composite flash, September new home sales
- Friday: September durable goods, October consumer sentiment
Historical Data
I'm a true stock market historian. I am absolutely PASSIONATE about studying stock market history to provide us more clues about likely stock market direction and potential sectors/industries/stocks to trade. While I don't use history as a primary indicator, I'm always very aware of it as a secondary indicator. I love it when history lines up with my technical signals, providing me much more confidence to make particular trades.
Below you'll find the next two weeks of historical data and tendencies across the 3 key indices that I follow most closely:
S&P 500 (since 1950)
- Oct 21: +62.18%
- Oct 22: -90.58%
- Oct 23: -5.88%
- Oct 24: -28.56%
- Oct 25: -42.80%
- Oct 26: -60.52%
- Oct 27: -26.14%
- Oct 28: +126.68%
- Oct 29: +77.49%
- Oct 30: +60.46%
- Oct 31: +18.59%
- Nov 1: +46.81%
- Nov 2: +79.69%
- Nov 3: +98.11%
NASDAQ (since 1971)
- Oct 21: +148.28%
- Oct 22: -58.57%
- Oct 23: -37.77%
- Oct 24: -61.34%
- Oct 25: -40.09%
- Oct 26: -115.08%
- Oct 27: -73.58%
- Oct 28: +164.31%
- Oct 29: +63.91%
- Oct 30: +33.60%
- Oct 31: +97.68%
- Nov 1: +42.72%
- Nov 2: +101.17%
- Nov 3: +97.89%
Russell 2000 (since 1987)
- Oct 21: +50.68%
- Oct 22: -40.78%
- Oct 23: -41.09%
- Oct 24: -62.67%
- Oct 25: +6.43%
- Oct 26: -13.96%
- Oct 27: -132.36%
- Oct 28: +186.46%
- Oct 29: +69.99%
- Oct 30: +9.54%
- Oct 31: +148.88%
- Nov 1: +2.49%
- Nov 2: +133.34%
- Nov 3: +170.75%
The S&P 500 data dates back to 1950, while the NASDAQ and Russell 2000 information date back to 1971 and 1987, respectively.
Final Thoughts
All of our major indices were higher last week and most of our sectors were as well. I like to see the wide participation when the stock market advances. It's certainly a sign of health. Also, earnings have been coming in mostly ahead of schedule as I've noticed a healthy number of companies beating both revenue and earnings estimates. Here's what I'll be watching in the week ahead:
- History. At today's close, the worst historical week of the year kicks off. U.S. stocks have been quite resilient and history does not provide us any guarantee, but we do need to at least be aware of the tendency for stocks to decline this week.
- Support. Should we see selling, do rising 20-day EMAs offer support?
- Volatility ($VIX). It's come down quite a bit, but is still elevated as it now trades in the "cautious" 17-20 range. If we do see market weakness and a spike in volatility, does the VIX remain below the two recent highs near 23.
- 10-Year Treasury Yield ($TNX). The TNX surprisingly jumped above 4.15% today as traders have now been collectively selling bonds for the past 5 weeks. I expected a spike to the 4.05%-4.15% yield resistance zone, but if these long-term rates keep rising, that could put a lid on equity prices in the very near-term.
- Earnings. They'll be pouring in this week as we hear from the likes of TSLA, TXN, and IBM. Next week, we'll hear the latest results from a slew of market-moving stocks like Apple (AAPL) and Microsoft (MSFT).
Feedback
If you'd like to share your thoughts on our Weekly Market Report, positive or negative, you can reach us at "[email protected]".
Happy trading!
Tom