
EB Weekly Market Report - Monday, November 4, 2024
ChartLists Updated
The following ChartLists were updated over the weekend and are available for viewing/downloading on our website:
- Strong Earnings (SECL)
- Strong Future Earnings (SFECL)
- Seasonality - November (SEASCL)
- Daily Earnings ChartLists + Upcoming Earnings Rel Strength ChartList
Note: My source has changed in identifying companies that have raised guidance, making it much more difficult to update the Raised Guidance ChartList (RGCL) in a timely fashion. Last week, without updating the RGCL, I still updated the Bullish Trifecta ChartList (BTCL) using the old RGCL. This week, I have updated neither the RGCL nor the BTCL. I'm hoping to have both updated as soon as possible. I'll keep you posted, but I'm hoping to have both by Wednesday.
Weekly Market Recap
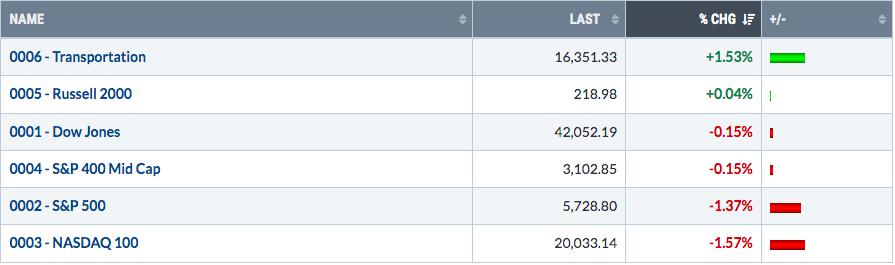
Major Indices
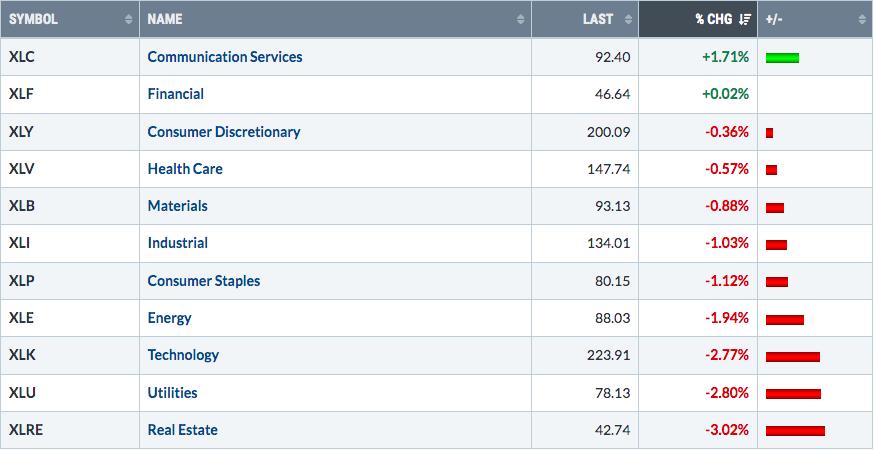
Sectors
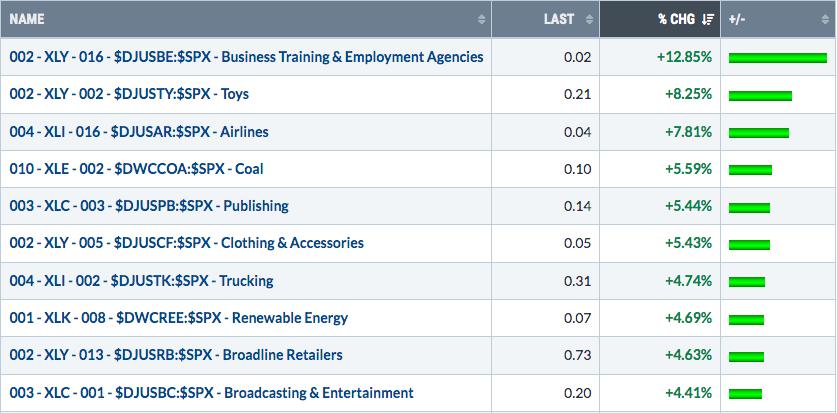
Top 10 Industries Last Week
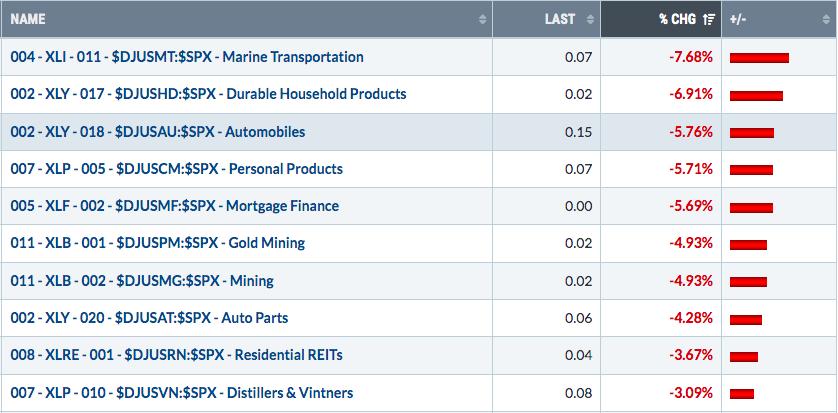
Bottom 10 Industries Last Week
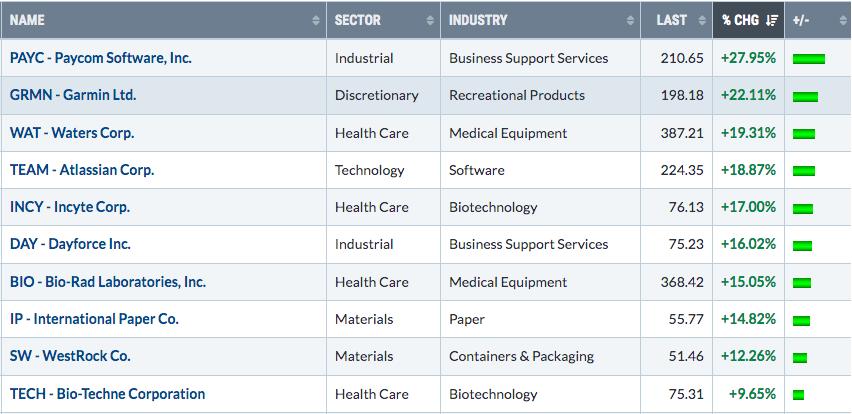
Top 10 Stocks - S&P 500/NASDAQ 100
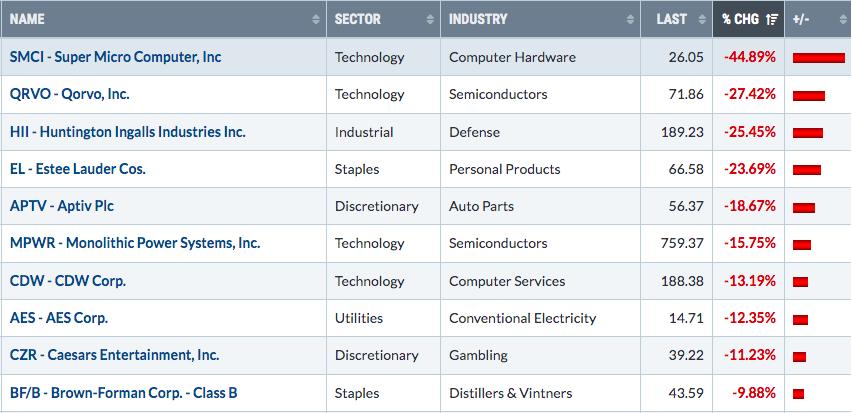
Bottom 10 Stocks - S&P 500/NASDAQ 100
Big Picture
Here's an update of the Big Picture, 100-year chart of the S&P 500:
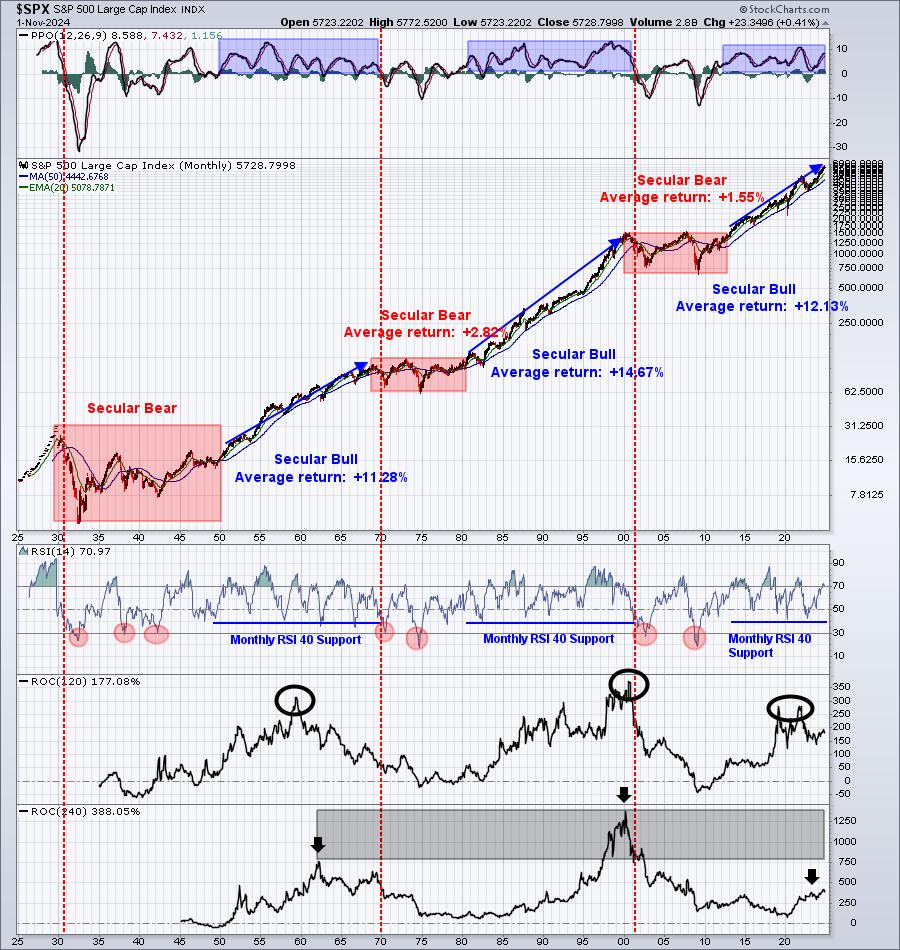
As this bull market continues, one thing to watch for down the road, possibly in 2025, is a monthly PPO reaching 12-13, while the monthly RSI moves closer to 80. If you look at the above chart, that combination could lead to a top, not THE top, but a top nonetheless. I wouldn't grow LONG-TERM bearish, but it could be sign of the next cyclical bear market, or possibly just time for a more significant pause. I'd also check to see if the 253-day SMA of the equity only put call ratio drops to the 60 level or below. That would be another signal that we've probably gone too far too fast.
Until then, carry on bulls.
Rotation/Intermarket Analysis
Here's the latest look at our key intraday ratios as we follow where the money is traveling on an INTRADAY basis (ignoring gaps):
QQQ:SPY
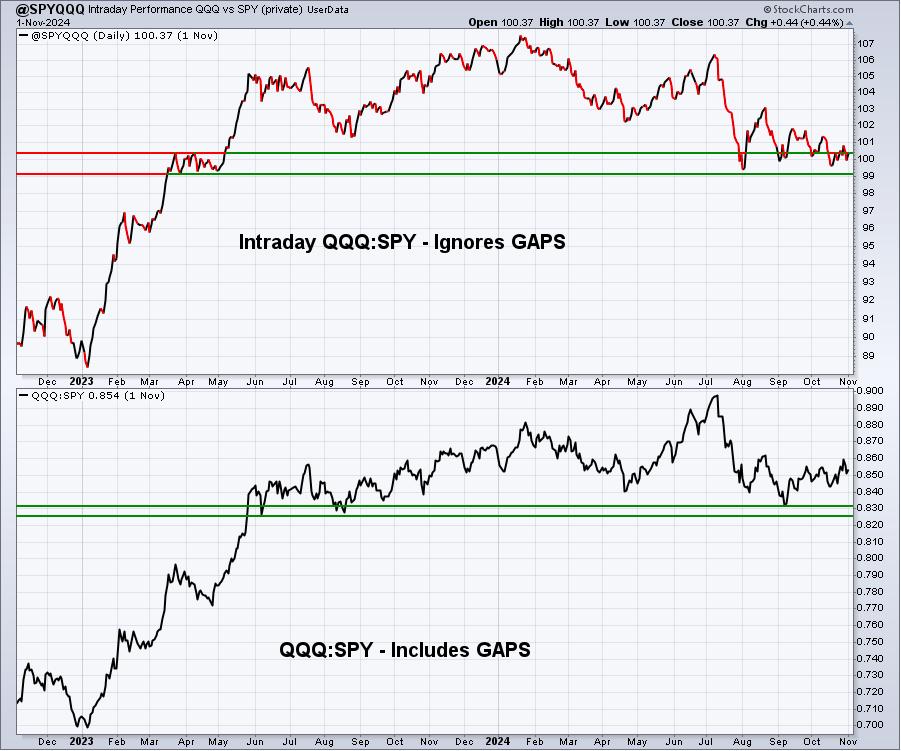
The sideways churn continues, providing us little in the way of directional clues.
Remember, this chart is actually calculated QQQ:SPY, despite its "@SPYQQQ" name.
IWM:QQQ
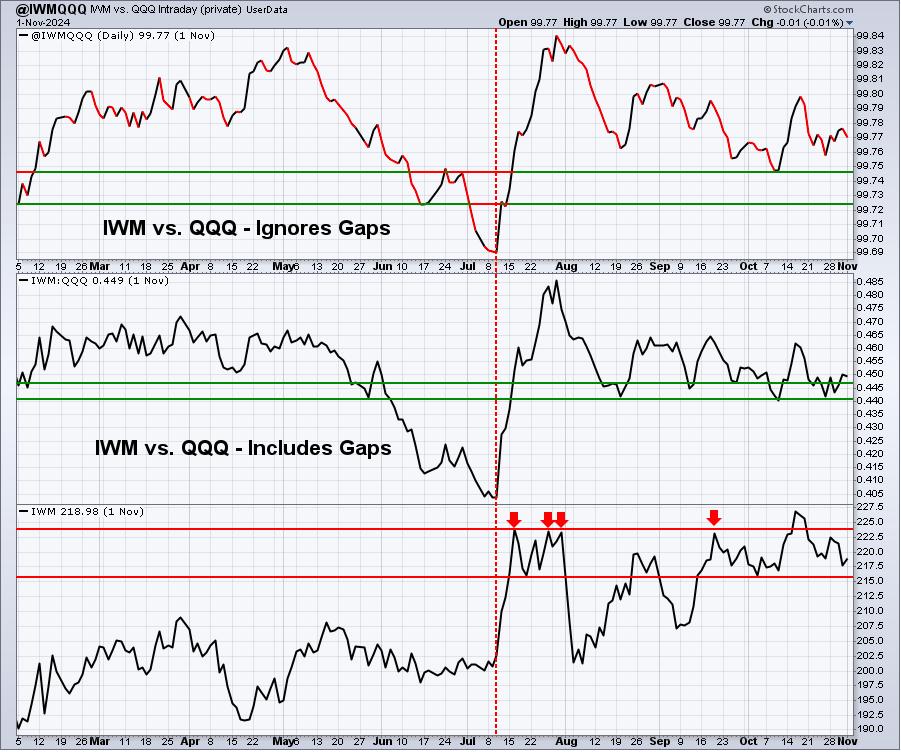
The good news is that relative support is holding for the "including" and "excluding" gap panels. The bad news, though, is that we're really not uptrending.
XLY:XLP
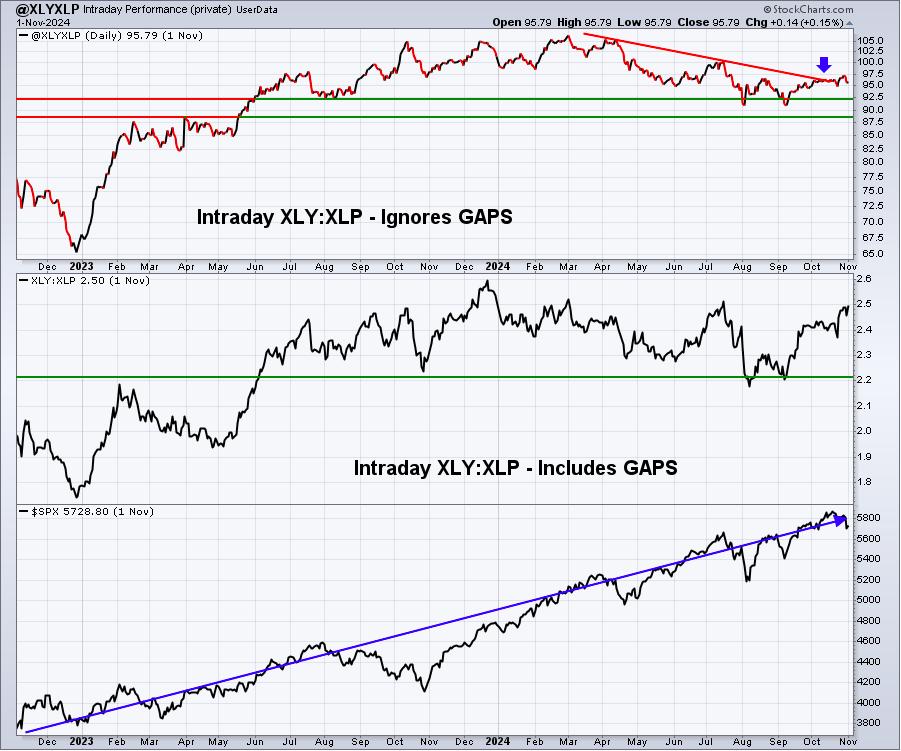
"This is likely the most bullish development from last week. Consumer discretionary (XLY) was first in performance last week among all major indices and sectors and we're seeing a relative downtrend break vs. consumer staples (XLP). Further confirmation is what I'd expect and look for in the week ahead."
That was last week's comment. I really wanted to see this intraday rotation INTO the XLY from the XLP to not only continue, but perhaps accelerate. That hasn't happened yet, but I'll keep providing you weekly updates. The panel showing "including gaps", however, did continue to rise. So this tells me that the XLY is being manipulated higher based on strong relative gaps vs. the XLP to the upside.
Sentiment
5-day SMA ($CPCE)
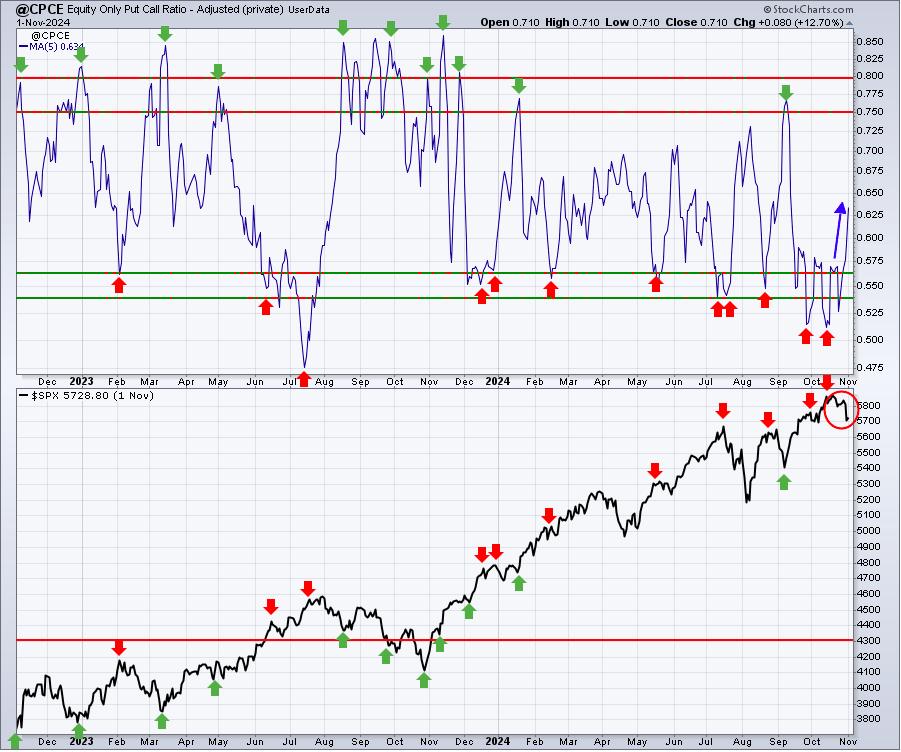
FINALLY! This 5-day CPCE has been screaming for some relief and, in order to get that relief, we usually need to see some short-term selling in U.S. equities. It hasn't been a TON of selling, but any selling to relieve this sentiment indicator is helpful. I certainly wouldn't say the stock market is ready to explode higher because of this development, but we're no longer in a situation where this 5-day moving average resides at point that signals caution.
We wouldn't get a true buy signal until this 5-day CPCE reading hit .75. But being in the middle of the .55-.75 range is much, much better than being at the bottom of it.
253-day SMA ($CPCE)
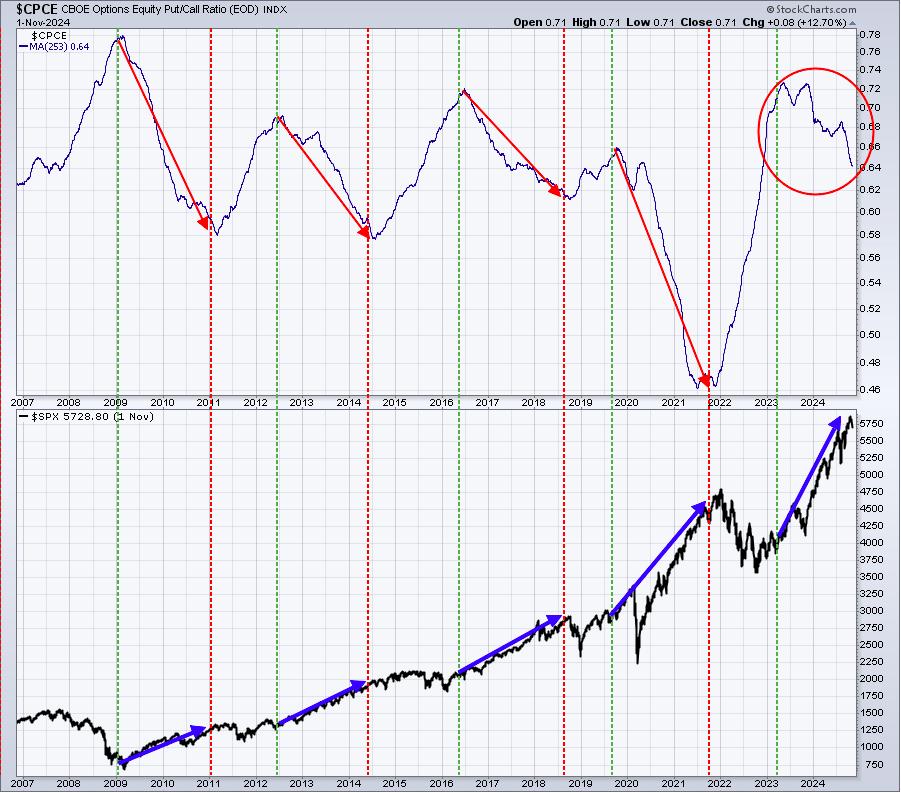
Here's what I posted last week regarding this 253-day SMA of the CPCE and I haven't changed my thoughts at all:
"This remains a very consistent and very bullish indicator. The long-term 253-day SMA of the CPCE keeps falling from what used to be extreme pessimism. There's no doubt that this reading needs to fall further, perhaps much further. For now, however, it suggests U.S. equities are much more likely to push higher through year end as opposed to lower."
Sustainability Ratios
I wanted to follow up on one of the ratio charts I highlighted last week, given that the S&P 500 was so weak since then:
Growth vs. Value:
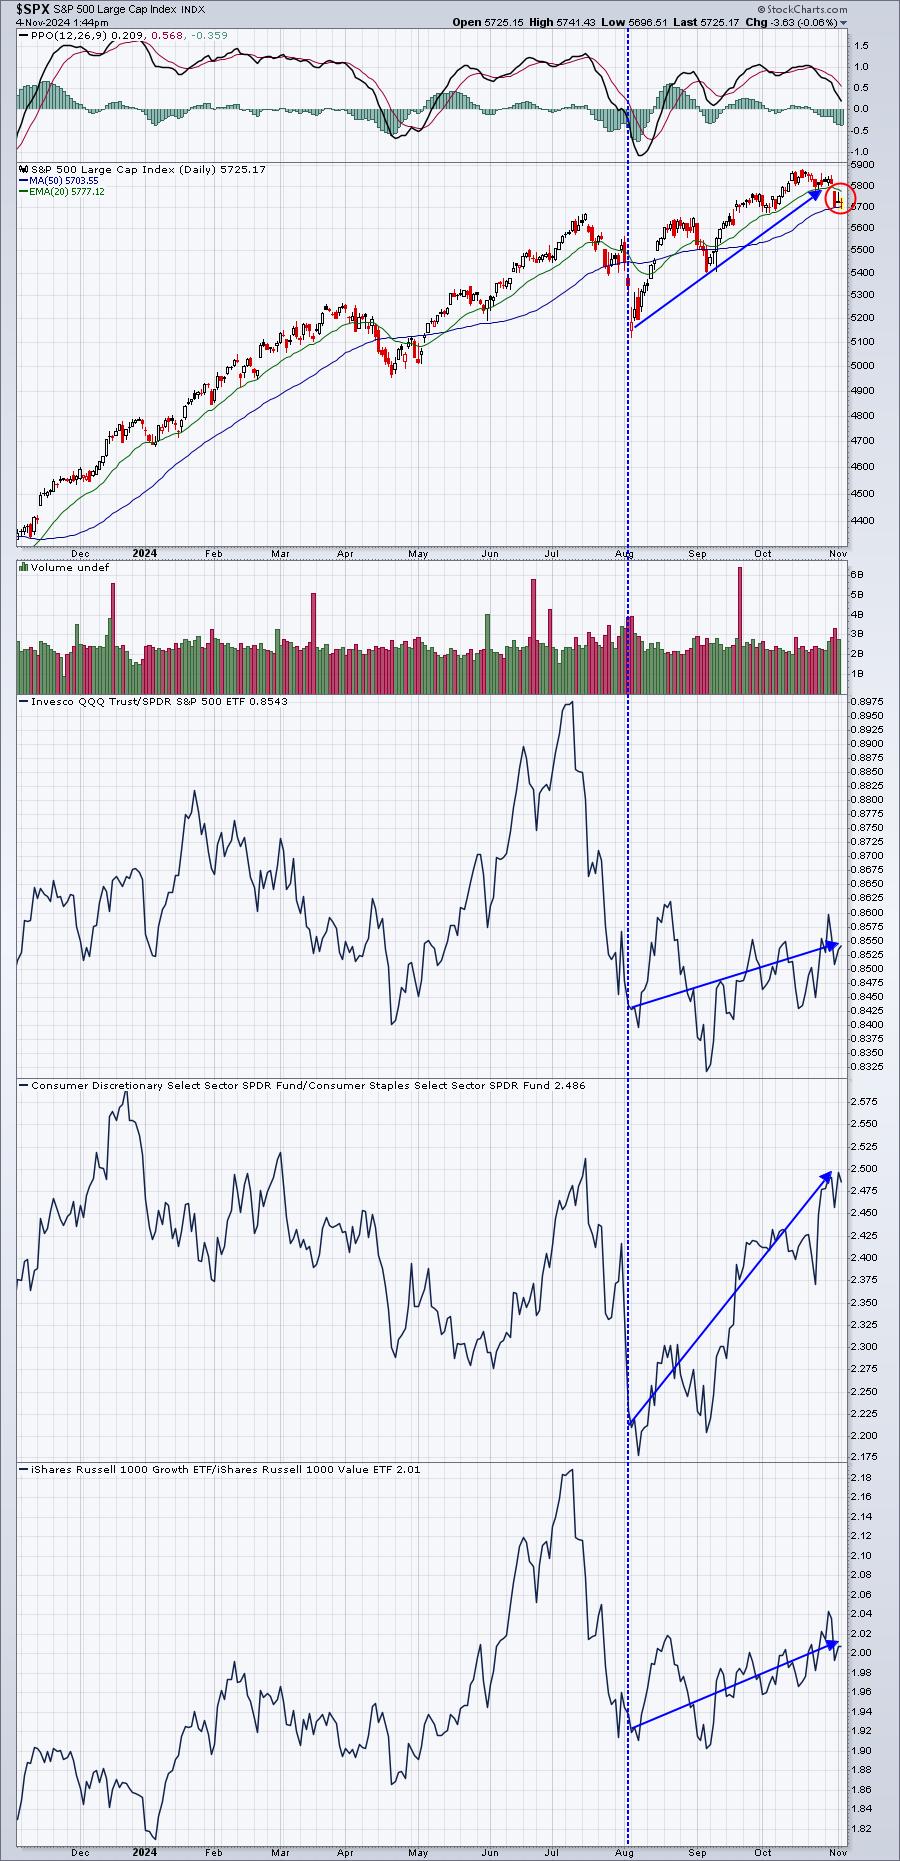
I find it comforting that none of these sustainability ratios plunged over the course of the past week. Rather, the majority of the selling occurred on Thursday and our ratios moved higher, then back down during the latter part of the week. In other words, we didn't see a mass exodus out of aggressive areas, a positive signal.
Aggressive vs. Defensive Sectors:
Now for an update on the aggressive sectors:
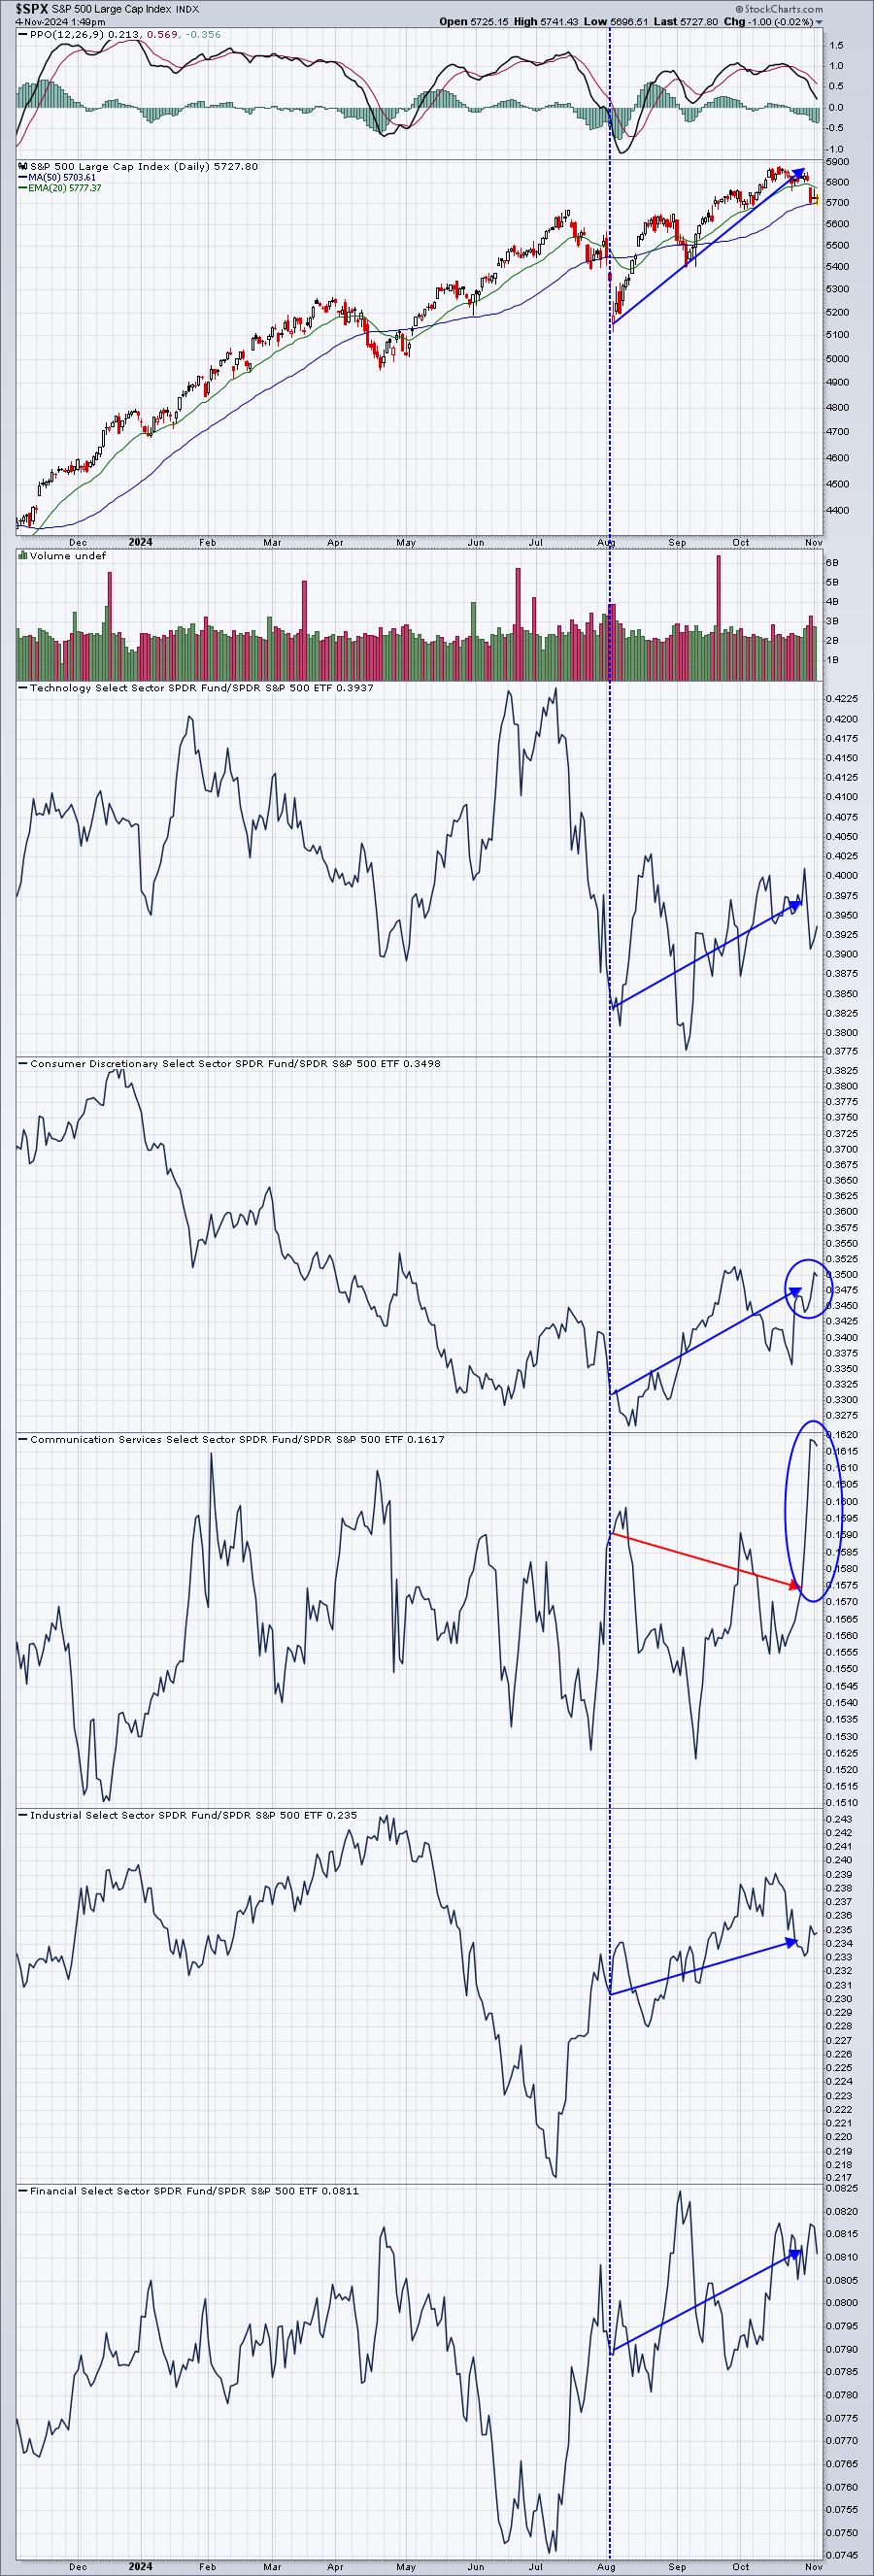
I circled two bullish developments last week. Both the XLY and XLC shot higher last week on a relative basis, despite the selling. Normally, during profit taking periods, aggressive sectors take the brunt of the selling, but not last week. Technology wasn't great, but the other aggressive sectors held up quite well.
Finally, you can see that most defensive sectors deteriorated further last week:
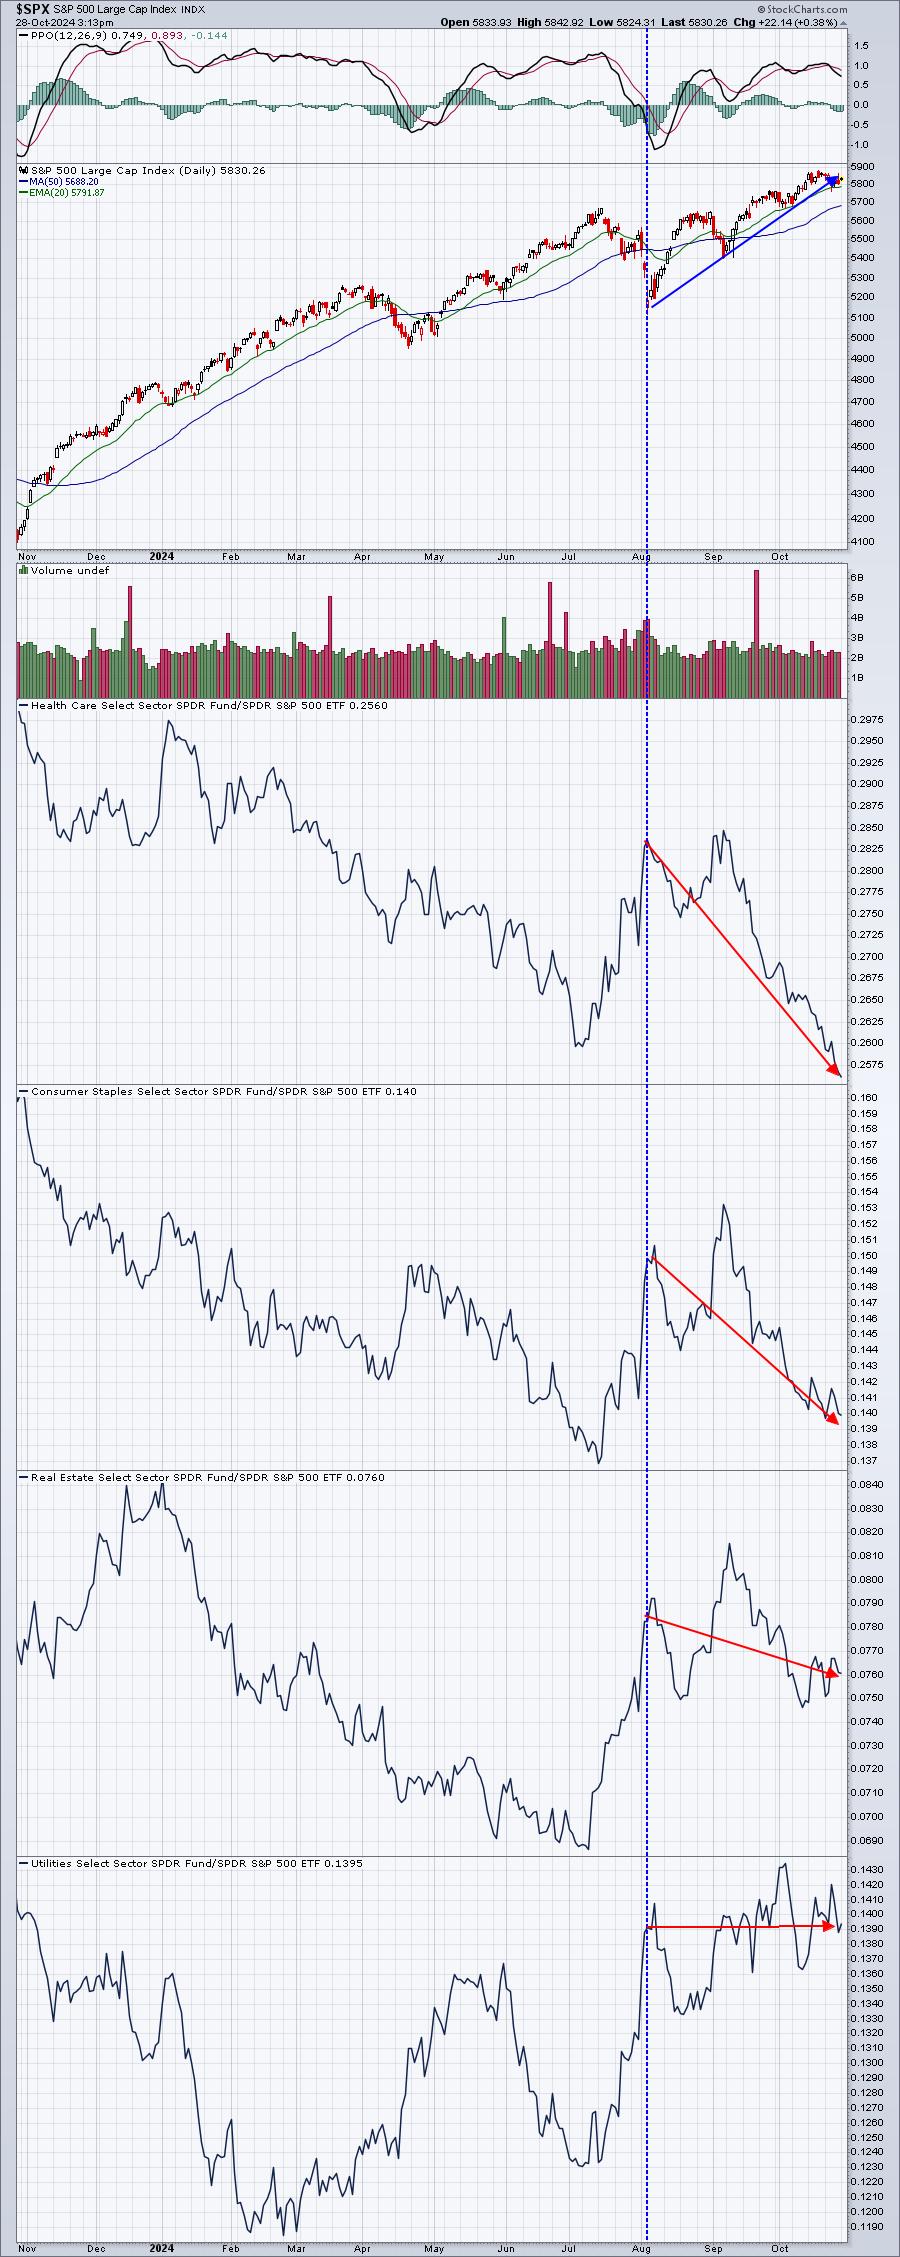
I grow much more concerned when aggressive stocks are weakening on a relative basis during RALLIES. In this case, we saw weakness last week and aggressive stocks mostly led on a relative basis. That certainly doesn't sound to me like Wall Street is bailing on this secular bull market.
Long-Term Trade Setup
Since beginning this Weekly Market Report over one year ago, I've discussed the long-term trade candidates below that I really like. Generally, these stocks have excellent long-term track records and many pay nice dividends that mostly grow every year. Only in very specific cases (exceptions) would I consider a long-term entry into a stock that has a poor or limited long-term track record and/or pays no dividends. Below is a quick recap of what I'm seeing currently on the 5-year weekly and 20-year monthly charts:
- JPM - strong price action, resilient at 20-week EMA support
- BA - 5-year downtrend remains in play, but I don't believe weakness will penetrate the 10-year support range from 100-125
- FFIV - has hit key resistance near 250 and back pedaled; still looks very solid
- MA - very bullish and very consistent pattern here
- GS - 1-year uptrend remains beautifully intact
- FDX - overhead price resistance from 300-310 needs to eventually be cleared, but chart is solid
- AAPL - is there a better long-term chart?
- CHRW - excellent long-term track record, bounced nicely off monthly RSI 40 test, now threatening breakout
- JBHT - price support and monthly RSI 40-50 range test represented great entry in May/June
- STX - pulling back slightly after setting fresh all-time high recently
- HSY - monthly RSI at 42, great brand and solid dividend history; nice entry point right here, in my opinion
- DIS - a BA-type chart, wandering not too far above MAJOR long-term support at 80
- MSCI - few weeks ago was calling for a trip to 650...it hit 631, don't be surprised by a breakout upcoming here
- SBUX - like HSY, great brand and excellent long-term chart (note the recent monthly RSI test at 40)
- KRE - uptrending nicely on monthly chart and lots of fundamentals point to further gains ahead to 70
- ED - pulling back, but rising 20-month EMA would represent solid entry
- AJG - what a steady performer
- NSC - railroads love November from a seasonal perspective, I'm expecting move to 280
- RHI - we've seen recent gains since monthly RSI 40 test; key resistance is 20-month EMA near 71
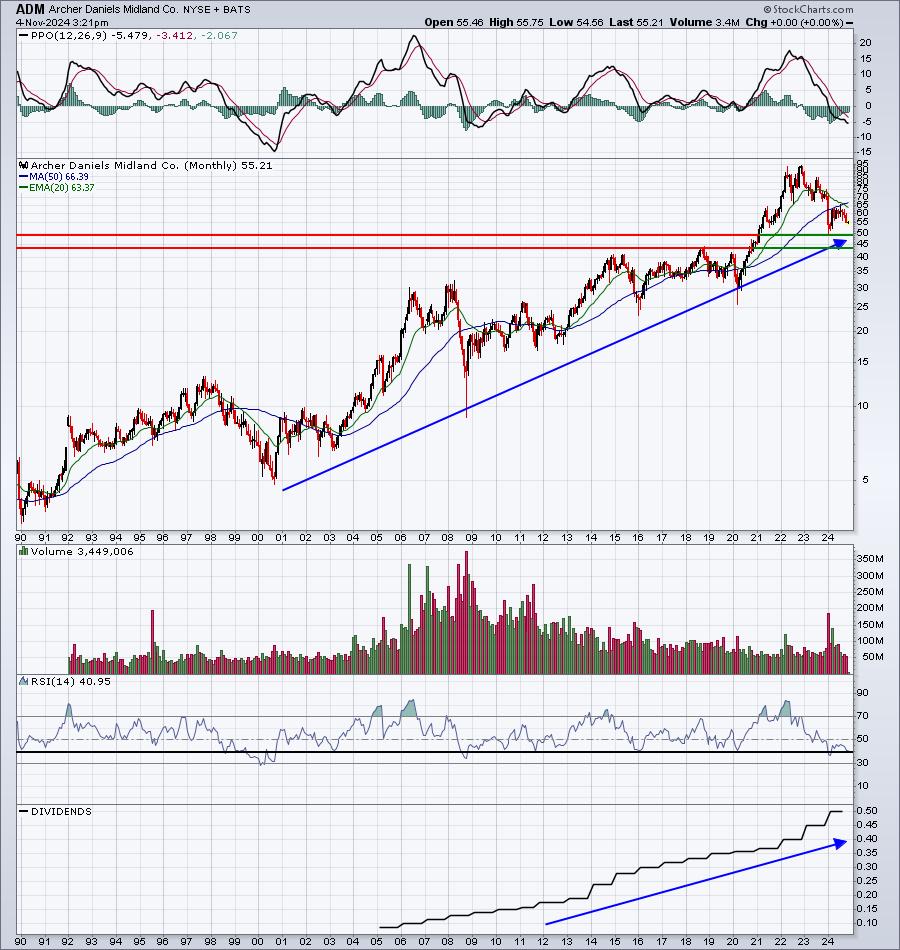
- ADM - added last week with monthly RSI currently at 41
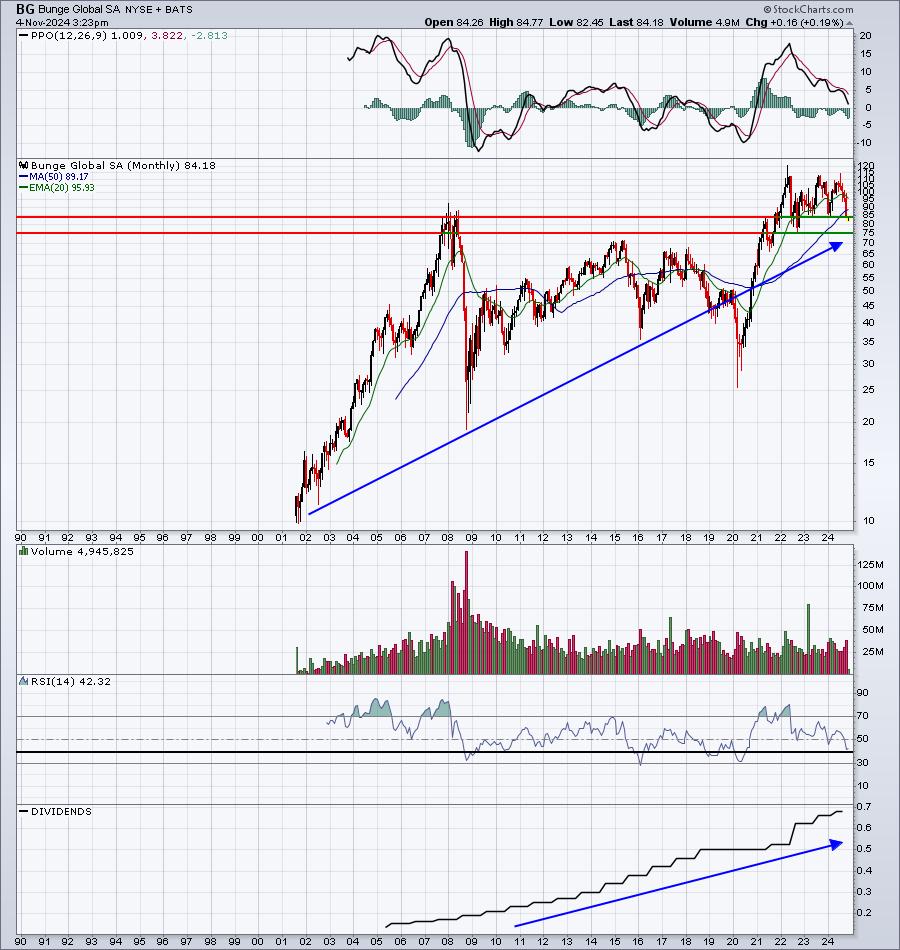
- BG - another solid long-term track record with monthly RSI at 42
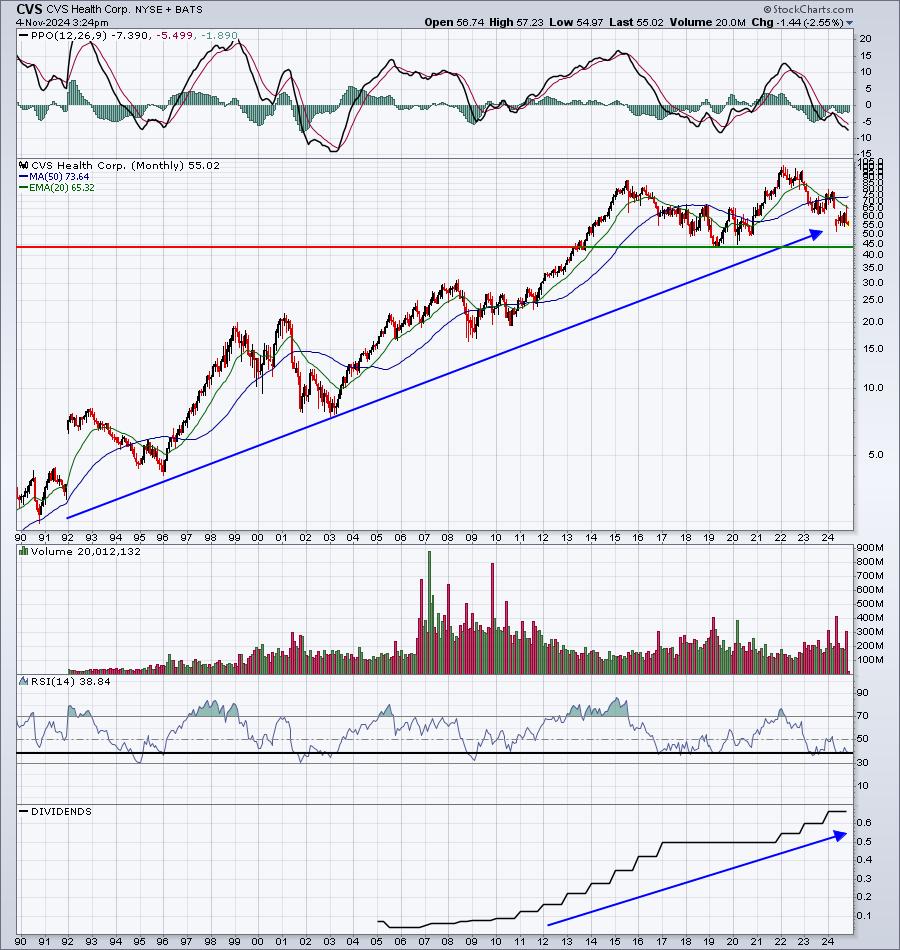
- CVS - dividend nearly 5% and stock 45% off from its early-2022 high
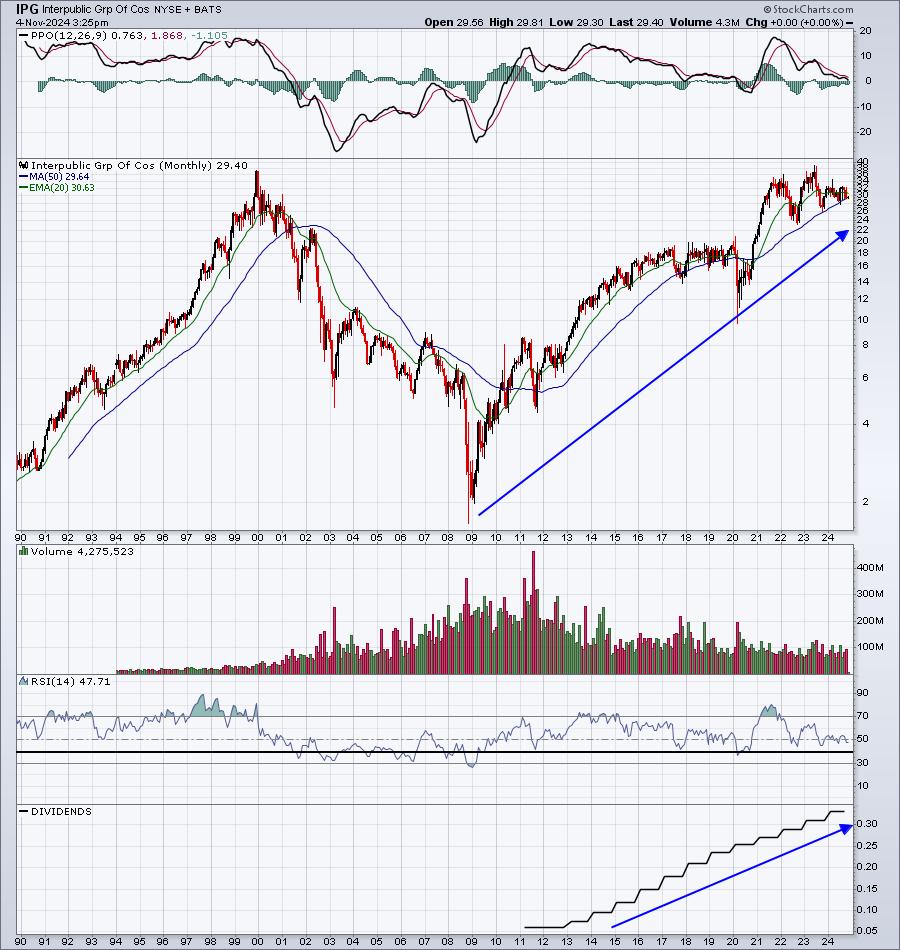
- IPG - look at the solid dividend growth on chart below, along with price action that's gone sideways since 2021
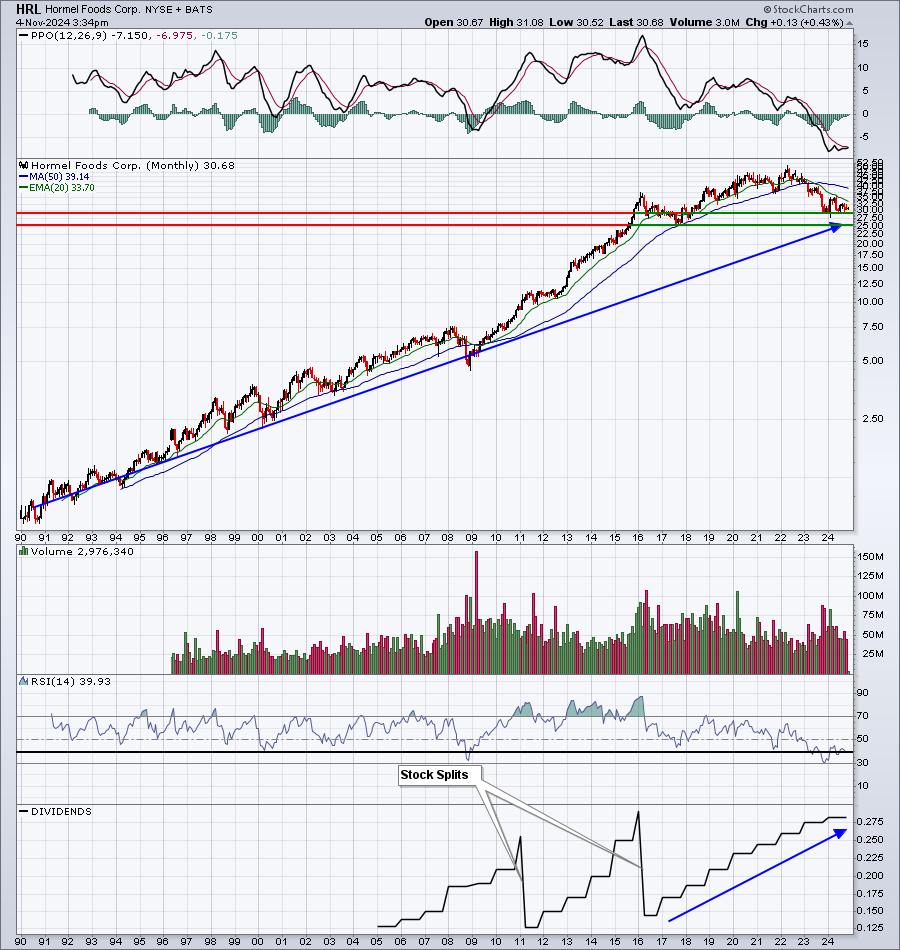
- HRL - lengthy weakness in a stock with an excellent 35-year track record; oh, and the dividend yield is 3.65%.
I added these last 5 stocks last week, because of their LONG-TERM track record in terms of price and dividends, NOT because of recent price strength. The thought process here is that longer-term investors are willing to wait awhile to unlock the potential value of these exceptional long-term performers that have simply encountered recent (last 1-2 years) selling. Here are long-term monthly charts for each of these 5, along with a panel below highlighting each company's dividend history. Please keep in mind that any significant drops in dividends is quite likely due to a stock split. The price chart accounts for the split, the dividend panel does not.
ADM:
BG:
CVS:
IPG:
HRL:
Keep in mind that our Weekly Market Reports favor those who are more interested in the long-term market picture. Therefore, the list of stocks above are stocks that we believe are safer (but nothing is ever 100% safe) to own with the long-term in mind. Nearly everything else we do at EarningsBeats.com favors short-term momentum trading, so I wanted to provide an explanation of what we're doing with this list.
Please keep in mind that I'm not a Registered Investment Advisor (and neither is EarningsBeats.com nor any of its employees) and am only providing (mostly) what I believe to be solid dividend-paying stocks for the long-term. Companies periodically go through adjustments, new competition, restructuring, management changes, etc. that can have detrimental long-term impacts. The stock price nor the dividend is ever guaranteed. I simply point out interesting stock candidates for longer-term investors. Do your own due diligence and please consult with your financial advisor before making any purchases of securities.
Looking Ahead
Upcoming Earnings:
Q3 earnings season is really kicking into gear this week as we'll see the most earnings reports released of any week this quarter. This is NOT a list of ALL companies reporting this week, however, just key reports, so please be sure to check for earnings of any companies that you own or add. Any company in BOLD represents a stock in one of our Portfolios:
- Monday: VRTX ($123 billion), PLTR ($93 billion)
- Tuesday: TRI ($74 billion), MCHP ($39 billion)
- Wednesday: NVO ($502 billion), QCOM ($181 billion), ARM ($148 billion)
- Thursday: ANET ($121 billion), ABNB ($86 billion), TDG ($73 billion), FTNT ($60 billion), TTD ($59 billion)
- Friday: None
Key Economic Reports:
- Monday: September factory orders
- Tuesday: October ISM services index
- Wednesday: FOMC meeting begins
- Thursday: Initial jobless claims, Q3 productivity & costs, FOMC announcement (2pm ET)
- Friday: November consumer sentiment
Historical Data
I'm a true stock market historian. I am absolutely PASSIONATE about studying stock market history to provide us more clues about likely stock market direction and potential sectors/industries/stocks to trade. While I don't use history as a primary indicator, I'm always very aware of it as a secondary indicator. I love it when history lines up with my technical signals, providing me much more confidence to make particular trades.
Below you'll find the next two weeks of historical data and tendencies across the 3 key indices that I follow most closely:
S&P 500 (since 1950)
- Nov 4: +52.85%
- Nov 5: +72.97%
- Nov 6: -24.52%
- Nov 7: -11.42%
- Nov 8: +20.69%
- Nov 9: -10.78%
- Nov 10: +35.74%
- Nov 11: +49.64%
- Nov 12: -18.61%
- Nov 13: +26.87%
- Nov 14: +7.94%
- Nov 15: -7.54%
- Nov 16: +12.22%
- Nov 17: +0.74%
NASDAQ (since 1971)
- Nov 4: +109.07%
- Nov 5: +102.06%
- Nov 6: +24.45%
- Nov 7: -42.34%
- Nov 8: -5.53%
- Nov 9: -62.87%
- Nov 10: +10.01%
- Nov 11: +70.44%
- Nov 12: -3.62%
- Nov 13: +74.06%
- Nov 14: +1.36%
- Nov 15: -15.63%
- Nov 16: -28.72%
- Nov 17: -12.31%
Russell 2000 (since 1987)
- Nov 4: +56.95%
- Nov 5: +67.17%
- Nov 6: +23.04%
- Nov 7: -67.45%
- Nov 8: +20.32%
- Nov 9: -54.42%
- Nov 10: +71.71%
- Nov 11: +9.59%
- Nov 12: -101.72%
- Nov 13: +135.86%
- Nov 14: -3.15%
- Nov 15: -0.42%
- Nov 16: -17.55%
- Nov 17: -10.61%
The S&P 500 data dates back to 1950, while the NASDAQ and Russell 2000 information date back to 1971 and 1987, respectively.
Final Thoughts
What a crazy ride we may find ourselves on this week. Here are a few things to consider in the week ahead:
- History. November is the best calendar month for the S&P 500 historically. I am NOT guaranteeing an outcome of higher prices. Please understand this is nothing more than a historical compilation and should be considered a SECONDARY indicator in terms of S&P 500 directional clues. Nothing trumps the combination of price and volume.
- Earnings. While many of the largest companies in the world have already reported results (NVDA is an exception as it will report on November 21st), this week is chock full of "next-tier" companies. This is the busiest week of the quarter in terms of earnings reports.
- Volatility ($VIX). The VIX should never be ignored, especially when it resides above 20. It tells us that there is a TON of fear still out there and bad news may not be handled well. I always say to be much more careful in the stock market when the VIX trades above 20. The 23 level is very critical resistance, because that's where the fear has rolled over on two recent market selloffs. If last week's selling were to escalate and the VIX moves decisively through 23, we could see LARGE selloff in the near-term. That's a very real possibility.
- Fed Meeting. Given that the 10-year treasury yield ($TNX) has climbed considerably in the past 6-7 weeks, listening to what the Fed is saying will be very important. And just as important will be Wall Street's reaction the Thursday FOMC announcement. What's the rotation look like? Do growth stocks sell off or are they bought. These things will need to be evaluated for clues as to where we're likely heading into year end.
- Technical Conditions. Most key indices, sectors, industry groups, etc., have been holding onto either 20-day EMA or 50-day SMA support. Does that continue? If it does not, and the VIX is climbing well into the 20s, we'll need to be exceptionally nimble.
Feedback
If you'd like to share your thoughts on our Weekly Market Report, positive or negative, you can reach us at "[email protected]".
Happy trading!
Tom