
EB Weekly Market Report - Monday, November 11, 2024
Veterans Day
We would like to say THANK YOU to all the men and women that are serving or have served our nation. Your sacrifice makes our nation a better place to live.
ChartLists Updated
The following ChartLists were updated over the weekend and are available for viewing/downloading on our website:
- Strong Earnings (SECL)
- Strong Future Earnings (SFECL)
- Raised Guidance (RGCL)
- Bullish Trifecta (BTCL)
- Daily Earnings ChartLists + Upcoming Earnings Rel Strength ChartList
Weekly Market Recap
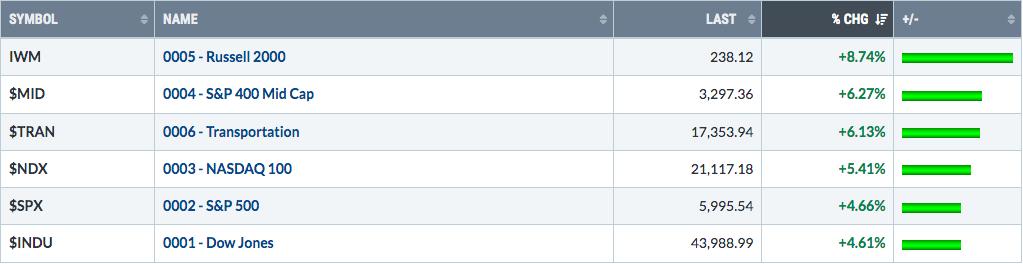
Major Indices
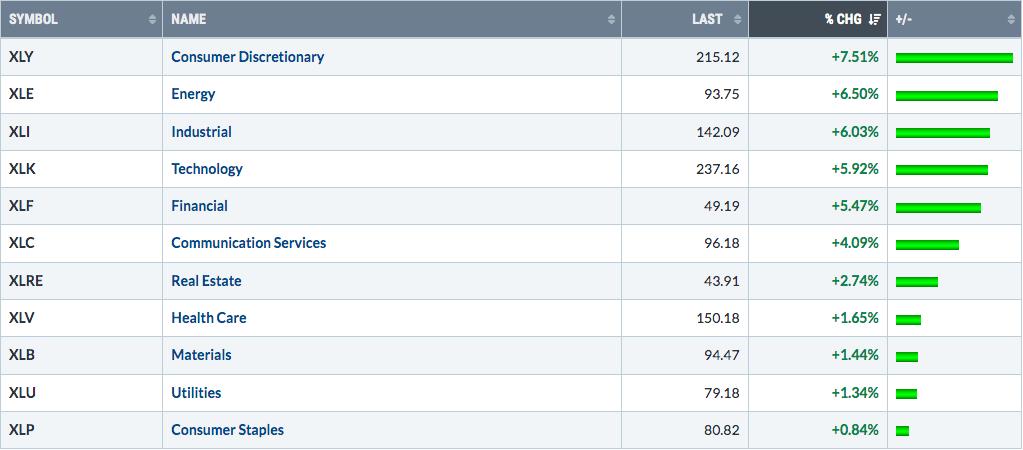
Sectors
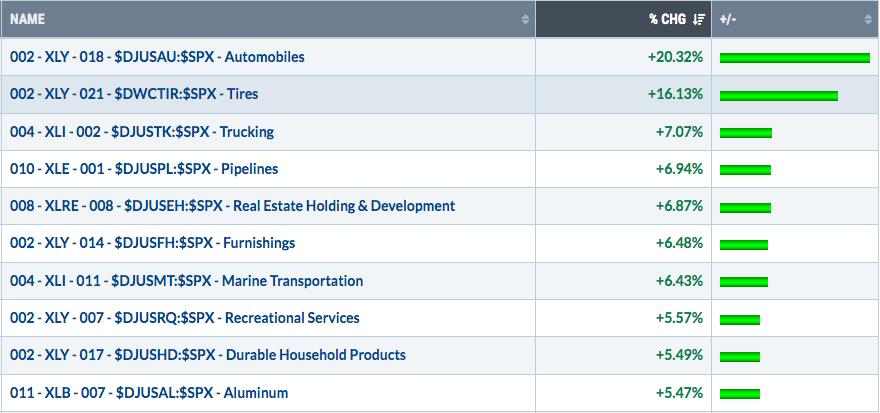
Top 10 Industries Last Week
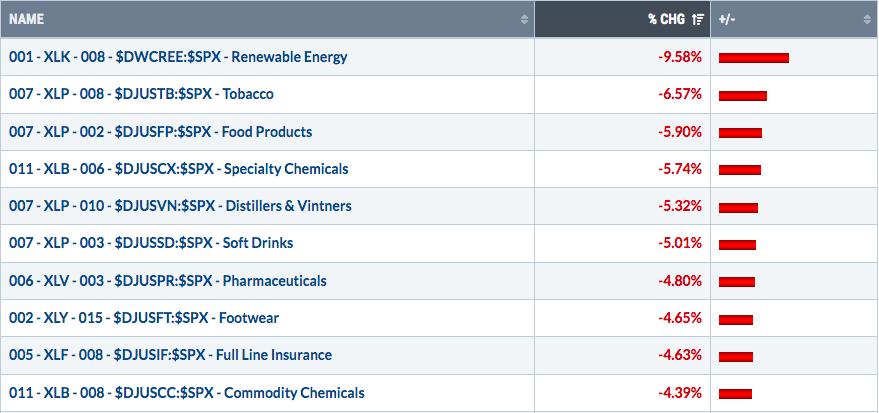
Bottom 10 Industries Last Week
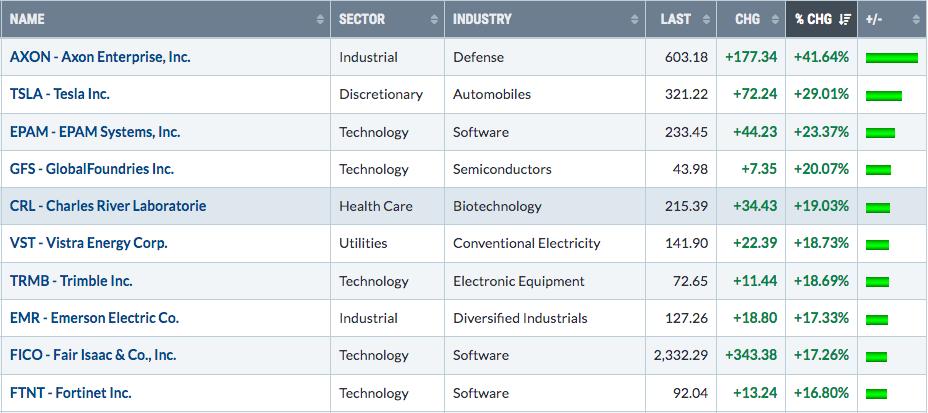
Top 10 Stocks - S&P 500/NASDAQ 100
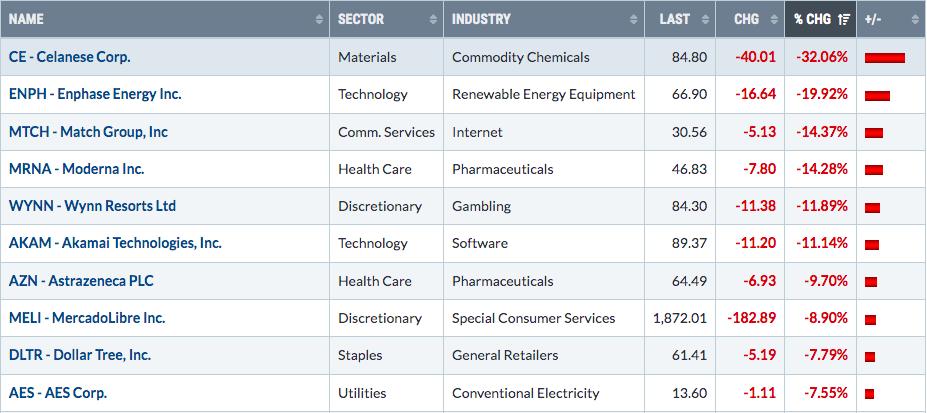
Bottom 10 Stocks - S&P 500/NASDAQ 100
Big Picture
Here's an update of the Big Picture, 100-year chart of the S&P 500:
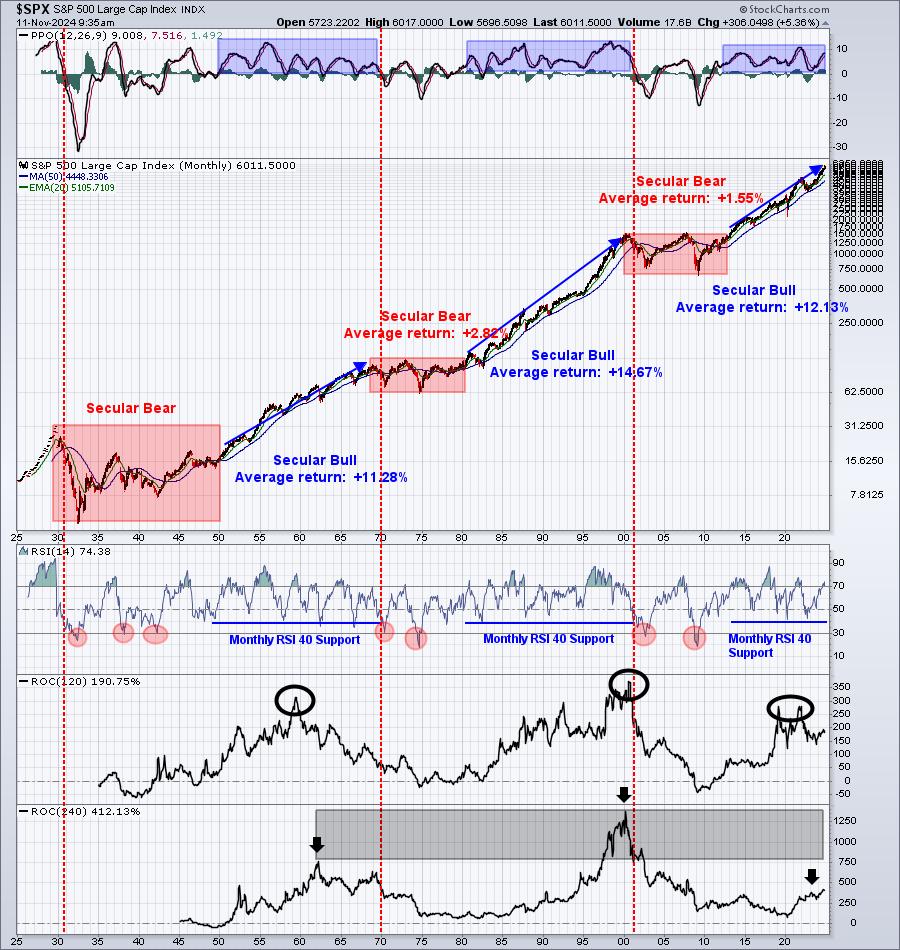
We saw yet another big weekly rally, this time after last week's Presidential Election. The S&P 500, on Friday, closed above 6000 for the first time ever. In my opinion, we'll see another 8 to 10 years of secular bull market action and I look for the S&P 500 to top somewhere from 12000-14000 (minimum) to 16000-18000 (maximum).
Many thought I was crazy calling a market top at the beginning of 2022 and then again when I called a bottom in June 2022. So you're free to call me crazy, I'm used to it. :-)
Rotation/Intermarket Analysis
Here's the latest look at our key intraday ratios as we follow where the money is traveling on an INTRADAY basis (ignoring gaps):
QQQ:SPY
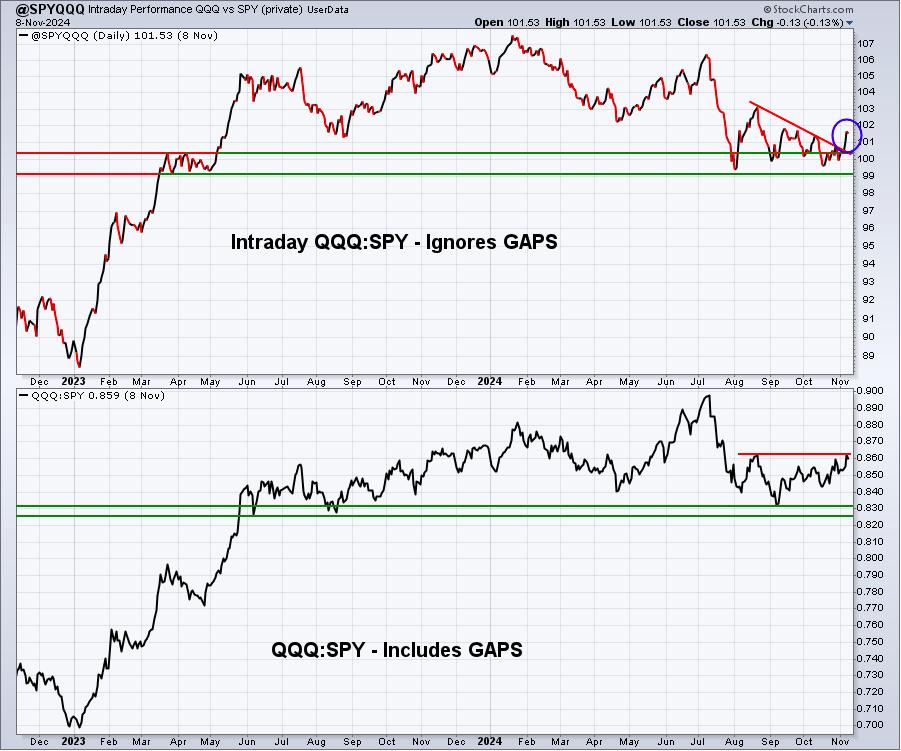
The long-term QQQ:SPY chart remains very bullish and supports further upside in the current secular bull market advance. These ratios do not move higher every day and we shouldn't expect them to. However, I do like to see a long-term uptrend in place.
Remember, this chart is actually calculated QQQ:SPY, despite its "@SPYQQQ" name.
IWM:QQQ
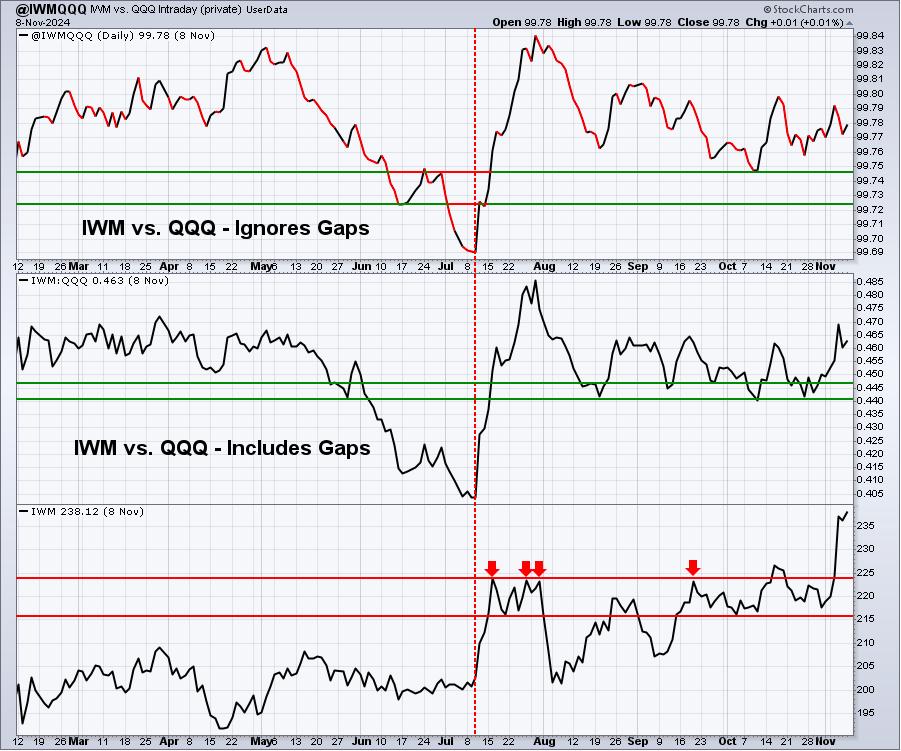
Both ratios, including and excluding gaps, are moving higher and that's good. But as I say quite often, my primary indicator is price/volume. It trumps absolutely everything else. Surging to an all-time record high on the IWM MUST be respected, I don't care how bearish you might be. This is the MOST aggressive asset class and the group breaking out means that investors/traders have a huge appetite for risk. That nearly always indicates the likelihood of higher prices ahead.
XLY:XLP
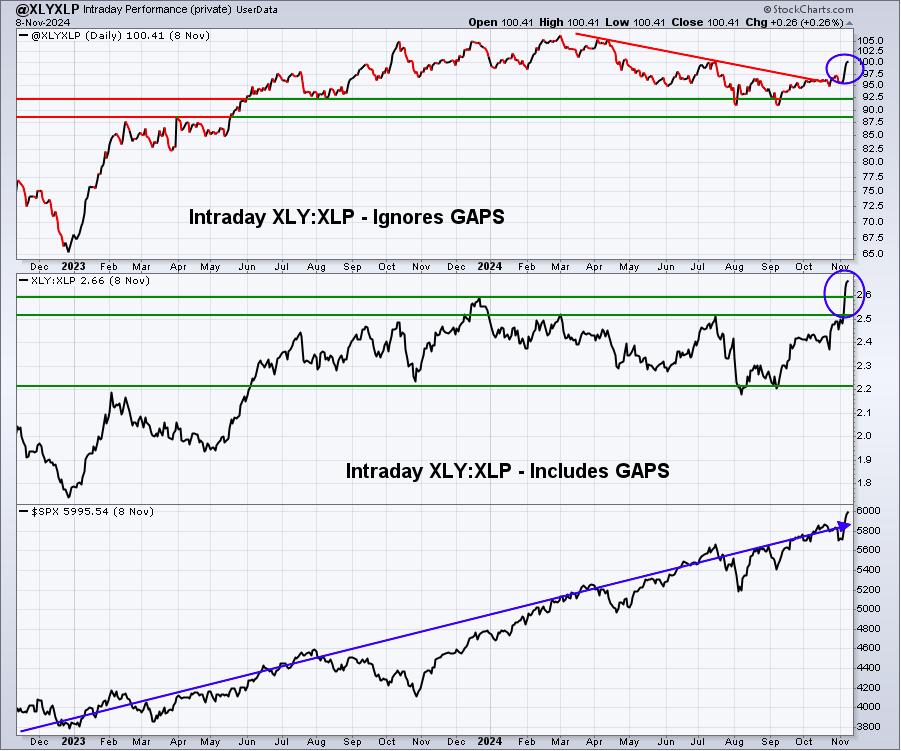
"This is likely the most bullish development from last week. Consumer discretionary (XLY) was first in performance last week among all major indices and sectors and we're seeing a relative downtrend break vs. consumer staples (XLP). Further confirmation is what I'd expect and look for in the week ahead.
That was last week's comment. I really wanted to see this intraday rotation INTO the XLY from the XLP to not only continue, but perhaps accelerate. That hasn't happened yet, but I'll keep providing you weekly updates. The panel showing "including gaps", however, did continue to rise. So this tells me that the XLY is being manipulated higher based on strong relative gaps vs. the XLP to the upside."
That's what I said last week. Well, we finally did see that acceleration to the upside in this ratio. Below in "Sector/Industry Focus" I discuss the significance of this ratio taking off to the upside.
Sentiment
5-day SMA ($CPCE)
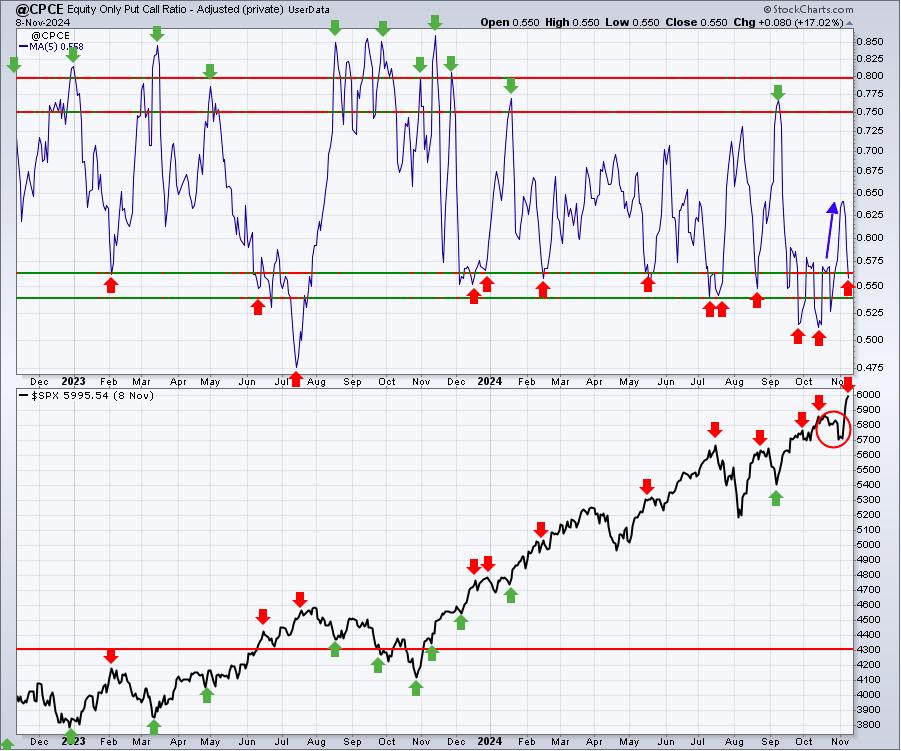
We've just seen the 5-day SMA move back below .56. ANY TIME this ratio falls below .56, we should realize the potential short-term implications. It's similar to the RSI being above 70, maybe even closing in on 80. It simply tells us that the rally MIGHT have gone too far. There are no guarantees.
253-day SMA ($CPCE)
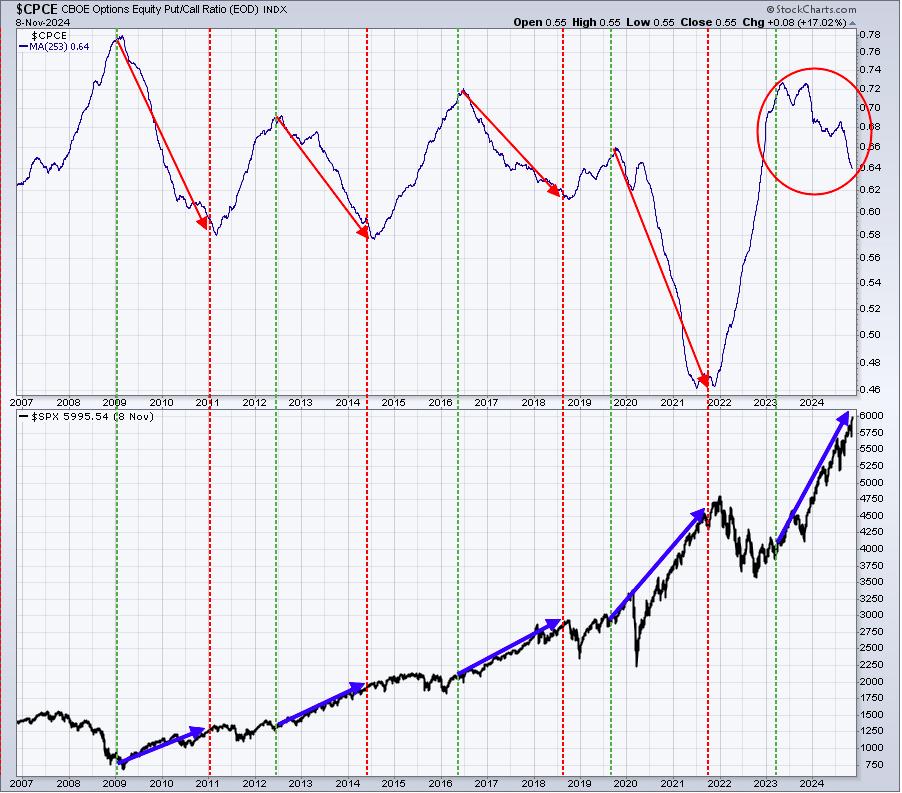
While the falling 5-day SMA suggests complacency in the near-term, the rapidly-declining 253-day SMA tells us that we are in the process of resetting from a very pessimistic environment to a complacent market. History tells us you absolutely want to be long as long as this 253-day SMA is tumbling - just like now.
The 5-day SMA is our short-term "speed boat" sentiment indicator, while the 253-day SMA is our long-term "freight liner"sentiment indicator.
Sector/Industry Focus
There's a ton of rotation into small caps, mid caps, financials, banks, industrials, transports, etc. But from a market health perspective, there are few signals, if any, that I rely on more than the XLY:XLP ratio. It just makes sense to me. If discretionary stocks (XLY) are outperforming staples stocks (XLP), it's a tremendously bullish signal that speaks volumes about how Wall Street feels about our economic environment. When you "hunker down", you own staples. When you are "RISK ON" and believe our economy is strengthening, or will strengthen, you own discretionary. It's literally that simple. Check out the tight positive correlation between the direction of the XLY:XLP ratio and the direction of the S&P 500:
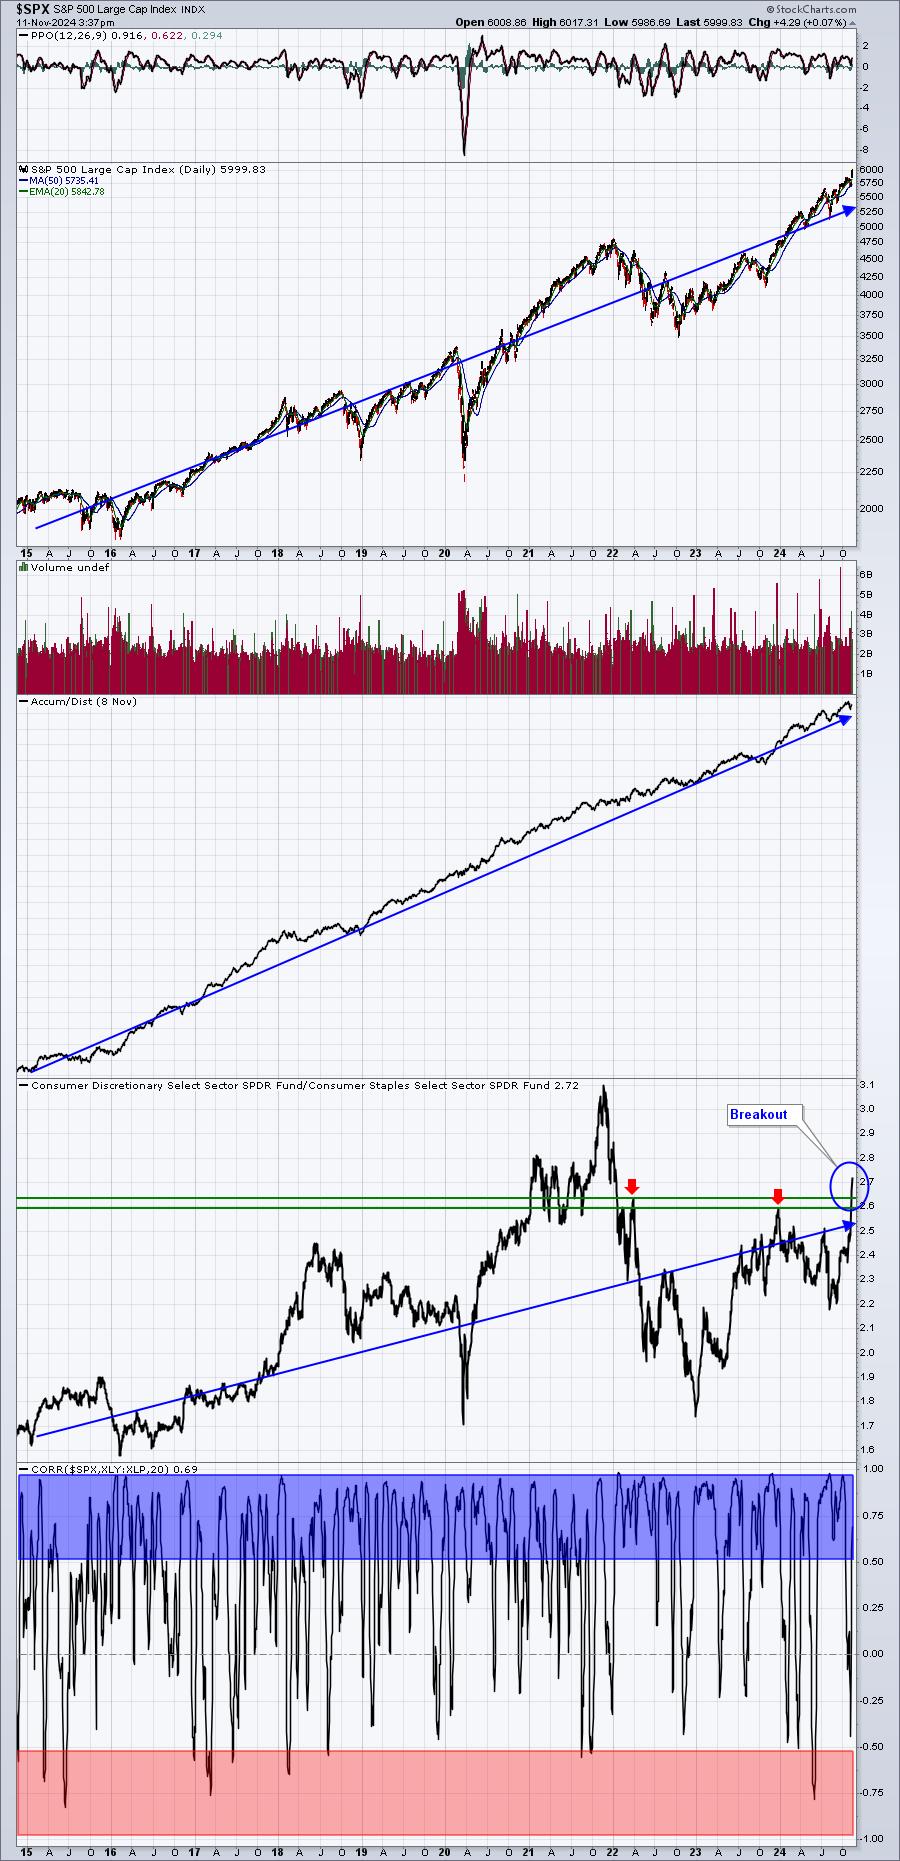
Now you tell me if you read anything other than what's 100% obvious here. The XLY:XLP ratio and the S&P 500 have a tremendously tight positive correlation (blue-shaded area), meaning that when the XLY:XLP ratio is rising, we should be expecting the S&P 500 to do the same. Now look again at the explosive move in that XLY:XLP ratio and tell me why you would be bearish.
Long-Term Trade Setup
Since beginning this Weekly Market Report over one year ago, I've discussed the long-term trade candidates below that I really like. Generally, these stocks have excellent long-term track records and many pay nice dividends that mostly grow every year. Only in very specific cases (exceptions) would I consider a long-term entry into a stock that has a poor or limited long-term track record and/or pays no dividends. Below is a quick recap of what I'm seeing on these long-term trades based on last week's election results:
- JPM - strong gap higher last week, following the banks
- BA - little impact from election results
- FFIV - gapped up Wednesday, looking to close at all-time high
- MA - broke out again o Wednesday and continuing to climb
- GS - financials have soared since the election and GS is riding the coattails
- FDX - today marking 5th straight day of gains
- AAPL - technology is initially lagging since the election as rotation to small and mid caps continues
- CHRW - nearing another breakout
- JBHT - transports got a big lift last week and JBHT going along for the ride
- STX - no significant impact last week
- HSY - broke down last week, but now bouncing to test key price resistance at 180
- DIS - gapped to a 4 1/2 month high last Wednesday and pushing higher since
- MSCI - moving higher now, but initially sold off last week
- SBUX - breaking out today above 100 for first time in nearly a year
- KRE - flying since the election as banks have been one of the best-performing industry groups
- ED - continuing to sell off, but should see solid support near 95
- AJG - consolidating and looking for another breakout at the 300 level
- NSC - again, the rising tide in transports lifting this boat
- RHI - massive jump last week as expected strengthening of economy would benefit companies like RHI
- ADM - tumbled last week, but rebounding off critical price support near 50
- BG - solid rebound with excellent volume last week
- CVS - spiked on election results, but selling off since
- IPG - ditto CVS
- HRL - down slightly since election
Keep in mind that our Weekly Market Reports favor those who are more interested in the long-term market picture. Therefore, the list of stocks above are stocks that we believe are safer (but nothing is ever 100% safe) to own with the long-term in mind. Nearly everything else we do at EarningsBeats.com favors short-term momentum trading, so I wanted to provide an explanation of what we're doing with this list and why it's different.
Please keep in mind that I'm not a Registered Investment Advisor (and neither is EarningsBeats.com nor any of its employees) and am only providing (mostly) what I believe to be solid dividend-paying stocks for the long-term. Companies periodically go through adjustments, new competition, restructuring, management changes, etc. that can have detrimental long-term impacts. The stock price nor the dividend is ever guaranteed. I simply point out interesting stock candidates for longer-term investors. Do your own due diligence and please consult with your financial advisor before making any purchases or sales of securities.
Looking Ahead
Upcoming Earnings:
Q3 earnings season is really kicking into gear this week as we'll see the most earnings reports released of any week this quarter. This is NOT a list of ALL companies reporting this week, however, just key reports, so please be sure to check for earnings of any companies that you own or add. Any company in BOLD represents a stock in one of our Portfolios:
- Monday: None
- Tuesday: HD ($397 billion), AZN ($201 billion), SHOP ($110 billion), SPOT ($80 billion)
- Wednesday: CSCO ($232 billion)
- Thursday: DIS ($179 billion), AMAT ($160 billion), TDG ($73 billion), FTNT ($60 billion), TTD ($59 billion)
- Friday: BABA ($240 billion)
Key Economic Reports:
- Monday: None
- Tuesday: None
- Wednesday: October CPI
- Thursday: Initial jobless claims, October PPI
- Friday: October retail sales, November empire state manufacturing index
Historical Data
I'm a true stock market historian. I am absolutely PASSIONATE about studying stock market history to provide us more clues about likely stock market direction and potential sectors/industries/stocks to trade. While I don't use history as a primary indicator, I'm always very aware of it as a secondary indicator. I love it when history lines up with my technical signals, providing me much more confidence to make particular trades.
Below you'll find the next two weeks of historical data and tendencies across the 3 key indices that I follow most closely:
S&P 500 (since 1950)
- Nov 11: +49.64%
- Nov 12: -18.61%
- Nov 13: +26.87%
- Nov 14: +7.94%
- Nov 15: -7.54%
- Nov 16: +12.22%
- Nov 17: +0.74%
- Nov 18: -4.26%
- Nov 19: -88.87%
- Nov 20: -28.17%
- Nov 21: +53.63%
- Nov 22: +1.27%
- Nov 23: +49.61%
- Nov 24: +125.29%
NASDAQ (since 1971)
- Nov 11: +70.44%
- Nov 12: -3.62%
- Nov 13: +74.06%
- Nov 14: +1.36%
- Nov 15: -15.63%
- Nov 16: -28.72%
- Nov 17: -12.31%
- Nov 18: -1.08%
- Nov 19: -110.08%
- Nov 20: -79.96%
- Nov 21: +68.77%
- Nov 22: -12.87%
- Nov 23: +34.13%
- Nov 24: +222.36
Russell 2000 (since 1987)
- Nov 11: +9.59%
- Nov 12: -101.72%
- Nov 13: +135.86%
- Nov 14: -3.15%
- Nov 15: -0.42%
- Nov 16: -17.55%
- Nov 17: -10.61%
- Nov 18: +5.23%
- Nov 19: -155.05%
- Nov 20: -65.10%
- Nov 21: +55.88%
- Nov 22: -1.46%
- Nov 23: +63.10%
- Nov 24: +251.02%
The S&P 500 data dates back to 1950, while the NASDAQ and Russell 2000 information date back to 1971 and 1987, respectively.
Final Thoughts
Last week was quite interesting and definitely worked out well for the bulls. What should we be thinking this week?
- Volatility ($VIX). Clearly, the VIX was previously elevated as traders were nervous about the Presidential race. The moment that the election ended, so too did the uptrend in the VIX.
- Options Expiration. Well, it's that time of the calendar month. This Friday is the 3rd Friday of the month and that means November monthly options will expire this week. We've seen a significant move to the upside, so that should make us a bit nervous throughout the week and into next week.
- History. We remain in a VERY bullish time of year and it's very difficult to move me off my bullish stance during Q4, because I know the history. If there is a weak time during November, it tends to be from the 18th through the 20th. That's NEXT Monday through Wednesday. I'm not saying we can't go down any other time in November or that I'm guaranteeing a sell off next week. PLEASE keep in mind that history provides us clues and tendencies, not guarantees. If our major indices continue accelerating to the upside, the 18th to 20th could represent a period where we see a pause, or even some selling.
- Small Caps. They are absolutely crushing it lately. That breakout above 235 on the IWM opened up "blue skies ahead". I always refer to all-time highs as blue skies, because there is no price resistance. It's usually after key price breakouts that the stock market grows incredibly stubborn, despite all the reasons why a sell off should occur. In other words, overbought can remain overbought.
- Banks and Financials. They absolutely LOVE Q4 and this year has been no different. Keep in mind that falling short-term interest rates (fed funds) and rising long-term interest rates (10-year treasury yield, or $TNX) are NIRVANA for banks, especially smaller banks, as the Net Interest Margin accelerates and this etric is what drives smaller banks' bottom lines.
Feedback
If you'd like to share your thoughts on our Weekly Market Report, positive or negative, you can reach us at "[email protected]".
Happy trading!
Tom