
EB Weekly Market Report - Monday, November 18, 2024
Notes
This week's WMR will be significantly abbreviated as I'm also prepping for today's Quarterly Portfolio DRAFT. You will receive room instructions for this event in a separate email.
I will be providing the 10 stocks in each Portfolio at the beginning of today's event. For those interested in the market themes that I expect over the next few months and the rationale for the individual stocks "drafted" into each portfolio, feel free to stick around after the stocks are announced. The event will also be recorded and made available for those who can't make the live event.
CORRECTION: On the EB Weekly Portfolio Report, the Model ETF Portfolio (in the summary area) showed a gain last week of 6.34%. That was incorrect and was the gain from the week prior. Last week, the Model ETF Portfolio lost 2.73%, which was reported correctly at the bottom of the report. I apologize for any confusion.
ChartLists Updated
The following ChartLists were updated over the weekend and are available for viewing/downloading on our website:
- Strong Earnings (SECL)
- Strong Future Earnings (SFECL)
- Strong AD (SADCL)
- Raised Guidance (RGCL)
- Bullish Trifecta (BTCL)
- Short Squeeze (SSCL)
- Earnings AD (EADCL)
- Daily Earnings ChartLists + Upcoming Earnings Rel Strength ChartList
Weekly Market Recap
It was a difficult week for U.S. equities as 60-minute negative divergences, November monthly options expiration, overbought conditions, and a soft historical period in mid-November all likely contributed to a bit of selling - which we discussed was a serious possibility at our Tuesday Max Pain event. This is what led to our decision to exit all Model and Aggressive Portfolio stocks in favor of cash, which is where we'll remain until Tuesday's closing bell.
Here's a quick recap of how our major indices performed:
- Dow Jones: -1.24%
- S&P 500: -2.08%
- NASDAQ 100: -3.42%
- Russell 2000 (IWM): -4.05%
- S&P 400 Mid Cap: -2.72%
- Dow Jones Transportation: -0.73%
Next, our major sectors:
- Technology (XLK): -3.56%
- Consumer Discretionary (XLY): -0.78%
- Communication Services (XLC): -1.07%
- Industrials (XLI): -2.10%
- Financials (XLF): +1.38%
- Health Care (XLV): -5.55%
- Consumer Staples (XLP): -1.06%
- Real Estate (XLRE): -2.12%
- Utilities (XLU): +0.09%
- Materials (XLB): -3.28%
- Energy (XLE): +1.05%
Finally, here were several notable negative groups last week:
- Biotechnology ($DJUSBT): -10.81%
- Paper ($DWCPAP): -9.83%
- Steel ($DJUSST): -6.91%
- Semiconductors ($DJUSSC): -6.26%
- Media Agencies ($DJUSAV): -6.18%
- Pharmaceuticals ($DJUSPR): -5.68%
- Electronic Equipment ($DJUSAI): -5.63%
- Defense ($DJUSDN): -5.40%
- Business Support Services ($DJUSIV): -5.27%
- Trucking ($DJUSTK): -4.74%
- Business Training & Employment Agencies ($DJUSBE): -4.54%
- Aerospace ($DJUSAS): -4.47%
- Internet ($DJUSNS): -4.13%
It was definitely a rough week for many areas. Here were several bright spots, however:
- Brewers ($DJUSDB): +4.80%
- Broadcasting & Entertainment ($DJUSBC): +4.63%
- Banks ($DJUSBK): +3.05%
- Life Insurance ($DJUSIL): +2.89%
- Tobacco. ($DJUSTB): +2.38%
- Pipelines ($DJUSPL): +1.82%
- Mobile Telecommunications ($DJUSWC): 1.78%
- Specialty Retailers ($DJUSRS): +1.76%
- Delivery Services ($DJUSAF): +1.57%
- Fixed Line Communication ($DJUSFC): +1.50%
- Exploration & Production ($DJUSOS): +1.15%
Big Picture
Here's an update of the Big Picture, 100-year chart of the S&P 500:
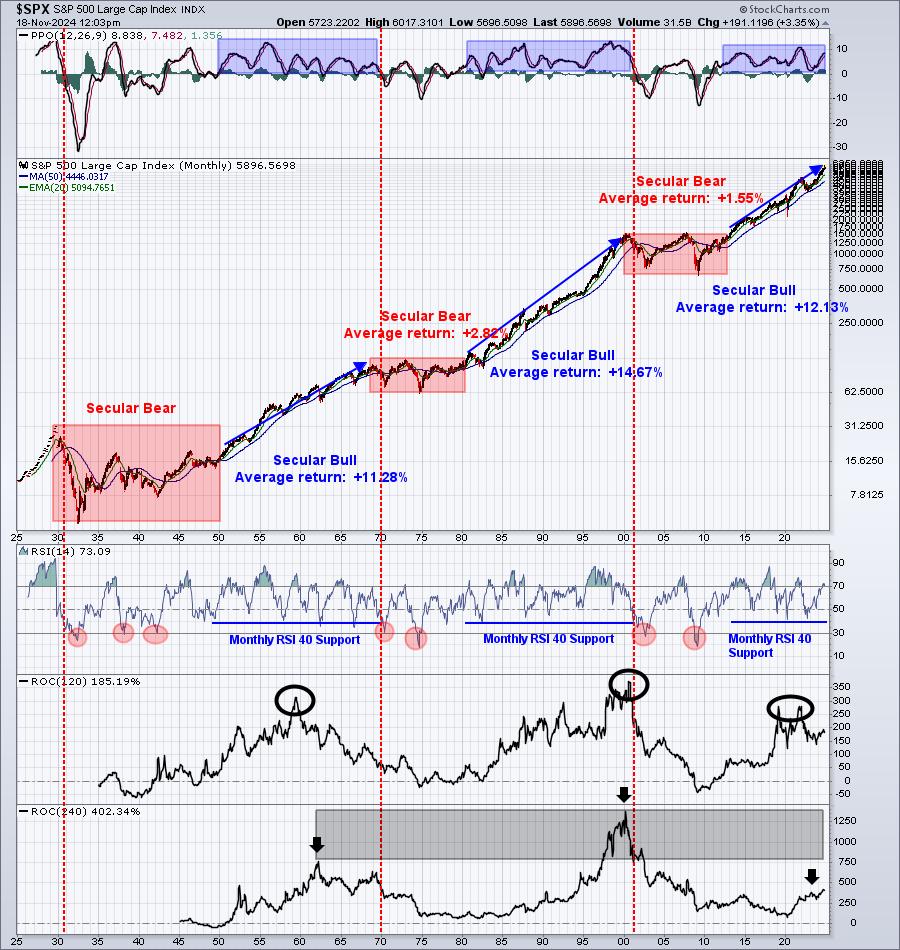
Sometimes, brief selloffs can be scary on daily, or even weekly, charts. This Big Picture chart, though, provides perspective and when selling really matters. Last week's pullback can't even be seen on this chart.
Sentiment
5-day SMA ($CPCE)
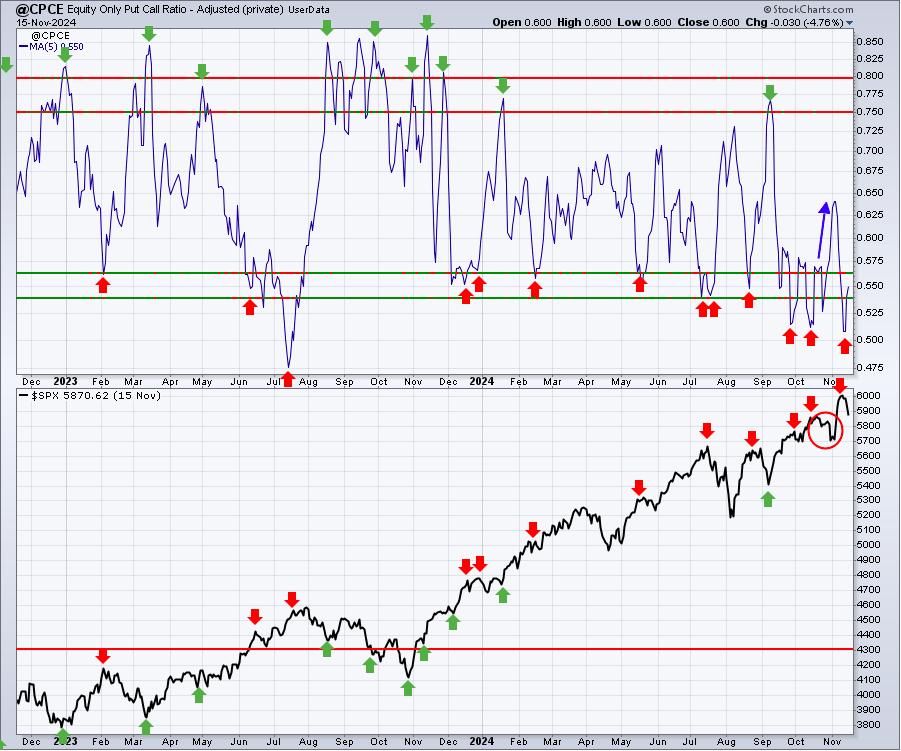
The complacent 5-day SMA readings of the CPCE may have added to last week's selling pressure. That 5-day reading still remains low, suggesting perhaps more short-term downside action ahead. But we can't overlook the long-term bullish signal we're still seeing from the following long-term 253-day SMA of the CPCE.
253-day SMA ($CPCE)
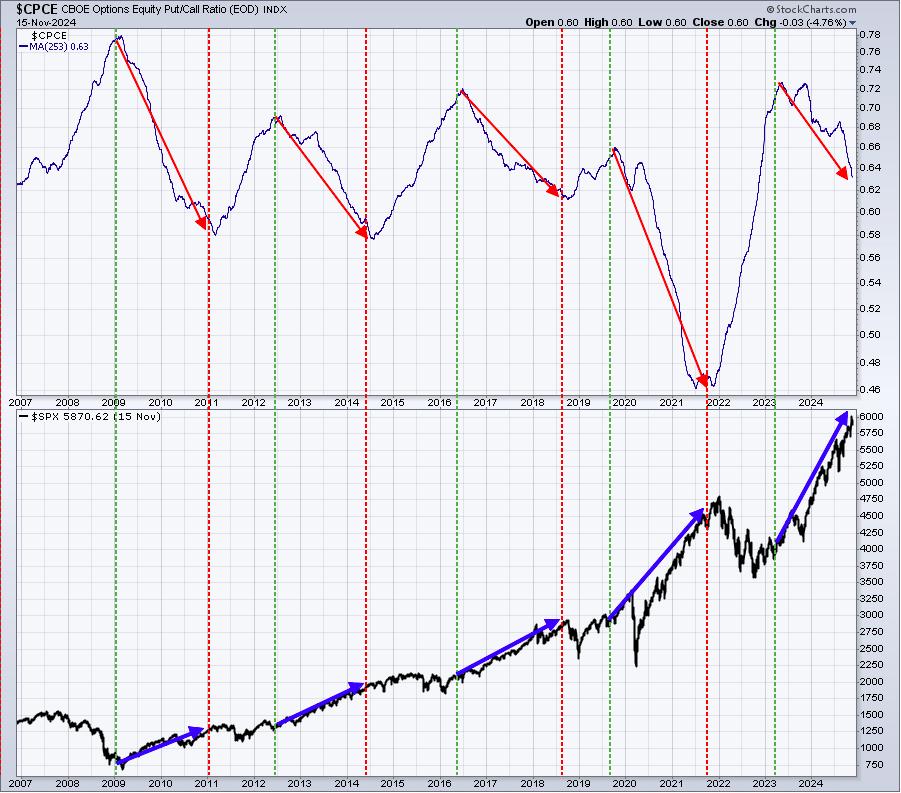
This long-term moving average remains in a spiraling downtrend, which historically has been bullish for the S&P 500. So while I acknowledge the potential short-term downside from those short-term complacency reading, this long-term bullish signal says don't get too caught up in the near-term.
Long-Term Trade Setup
Since beginning this Weekly Market Report over one year ago, I've discussed the long-term trade candidates below that I really like. Generally, these stocks have excellent long-term track records and many pay nice dividends that mostly grow every year. Only in very specific cases (exceptions) would I consider a long-term entry into a stock that has a poor or limited long-term track record and/or pays no dividends. Below is a quick recap of comments I made last week on all of our long-term stocks:
- JPM - strong gap higher last week, following the banks
- BA - little impact from election results
- FFIV - gapped up Wednesday, looking to close at all-time high
- MA - broke out again o Wednesday and continuing to climb
- GS - financials have soared since the election and GS is riding the coattails
- FDX - today marking 5th straight day of gains
- AAPL - technology is initially lagging since the election as rotation to small and mid caps continues
- CHRW - nearing another breakout
- JBHT - transports got a big lift last week and JBHT going along for the ride
- STX - no significant impact last week
- HSY - broke down last week, but now bouncing to test key price resistance at 180
- DIS - gapped to a 4 1/2 month high last Wednesday and pushing higher since
- MSCI - moving higher now, but initially sold off last week
- SBUX - breaking out today above 100 for first time in nearly a year
- KRE - flying since the election as banks have been one of the best-performing industry groups
- ED - continuing to sell off, but should see solid support near 95
- AJG - consolidating and looking for another breakout at the 300 level
- NSC - again, the rising tide in transports lifting this boat
- RHI - massive jump last week as expected strengthening of economy would benefit companies like RHI
- ADM - tumbled last week, but rebounding off critical price support near 50
- BG - solid rebound with excellent volume last week
- CVS - spiked on election results, but selling off since
- IPG - ditto CVS
- HRL - down slightly since election
Keep in mind that our Weekly Market Reports favor those who are more interested in the long-term market picture. Therefore, the list of stocks above are stocks that we believe are safer (but nothing is ever 100% safe) to own with the long-term in mind. Nearly everything else we do at EarningsBeats.com favors short-term momentum trading, so I wanted to provide an explanation of what we're doing with this list and why it's different.
Also, please keep in mind that I'm not a Registered Investment Advisor (and neither is EarningsBeats.com nor any of its employees) and am only providing (mostly) what I believe to be solid dividend-paying stocks for the long-term. Companies periodically go through adjustments, new competition, restructuring, management changes, etc. that can have detrimental long-term impacts. The stock price nor the dividend is ever guaranteed. I simply point out interesting stock candidates for longer-term investors. Do your own due diligence and please consult with your financial advisor before making any purchases or sales of securities.
Looking Ahead
Historical Data
I'm a true stock market historian. I am absolutely PASSIONATE about studying stock market history to provide us more clues about likely stock market direction and potential sectors/industries/stocks to trade. While I don't use history as a primary indicator, I'm always very aware of it as a secondary indicator. I love it when history lines up with my technical signals, providing me much more confidence to make particular trades.
Below you'll find the next two weeks of historical data and tendencies across the 3 key indices that I follow most closely:
S&P 500 (since 1950)
- Nov 18: -4.26%
- Nov 19: -88.87%
- Nov 20: -28.17%
- Nov 21: +53.63%
- Nov 22: +1.27%
- Nov 23: +49.61%
- Nov 24: +125.29%
- Nov 25: +33.24%
- Nov 26: +56.46%
- Nov 27: +52.79%
- Nov 28: +31.94%
- Nov 29: +5.46%
- Nov 30: +19.90%
- Dec 1: +15.70%
NASDAQ (since 1971)
- Nov 18: -1.08%
- Nov 19: -110.08%
- Nov 20: -79.96%
- Nov 21: +68.77%
- Nov 22: -12.87%
- Nov 23: +34.13%
- Nov 24: +222.36%
- Nov 25: +47.94%
- Nov 26: +77.78%
- Nov 27: +68.45%
- Nov 28: +57.67%
- Nov 29: -3.89%
- Nov 30: -21.23%
- Dec 1: +56.22%
Russell 2000 (since 1987)
- Nov 18: +5.23%
- Nov 19: -155.05%
- Nov 20: -65.10%
- Nov 21: +55.88%
- Nov 22: -1.46%
- Nov 23: +63.10%
- Nov 24: +251.02%
- Nov 25: +78.57%
- Nov 26: +22.50%
- Nov 27: 23.59%
- Nov 28: 63.14%
- Nov 29: 43.08%
- Nov 30: 45.26%
- Dec 1: -9.80%
The S&P 500 data dates back to 1950, while the NASDAQ and Russell 2000 information date back to 1971 and 1987, respectively.
Feedback
If you'd like to share your thoughts on our Weekly Market Report, positive or negative, you can reach us at "[email protected]".
Happy trading!
Tom