
EB Weekly Market Report - Monday, November 25, 2024
Schedule This Week
There will be no Daily Market Reports out on Wednesday, Thursday, and Friday of this week as we celebrate the Thanksgiving holiday weekend with families and friends. We'd like to extend our wishes to all of you for a Happy Thanksgiving Day and weekend with your families and friends as well.
I will likely update the Strong Earnings (SECL) and Strong Future Earnings (SFECL) ChartLists later this week, but all other ChartLists will be updated the following week. Next week should be business as usual.
ChartLists Updated
The following ChartLists were updated over the weekend and are available for viewing/downloading on our website:
- Strong Earnings (SECL)
- Strong Future Earnings (SFECL)
- Raised Guidance (RGCL)
- Bullish Trifecta (BTCL)
- Daily Earnings ChartLists + Upcoming Earnings Relative Strength ChartList
Weekly Market Recap
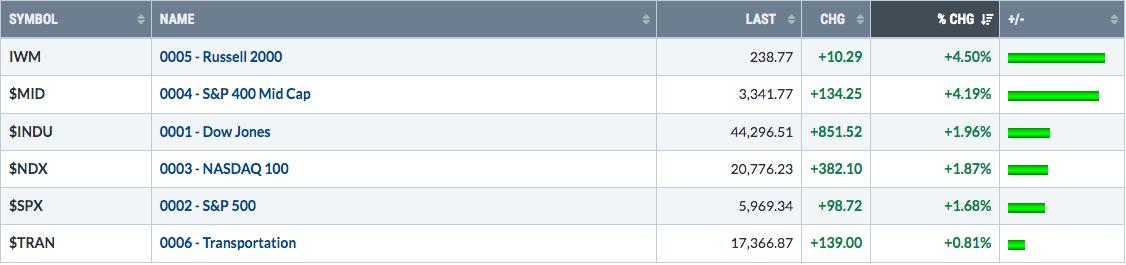
Major Indices
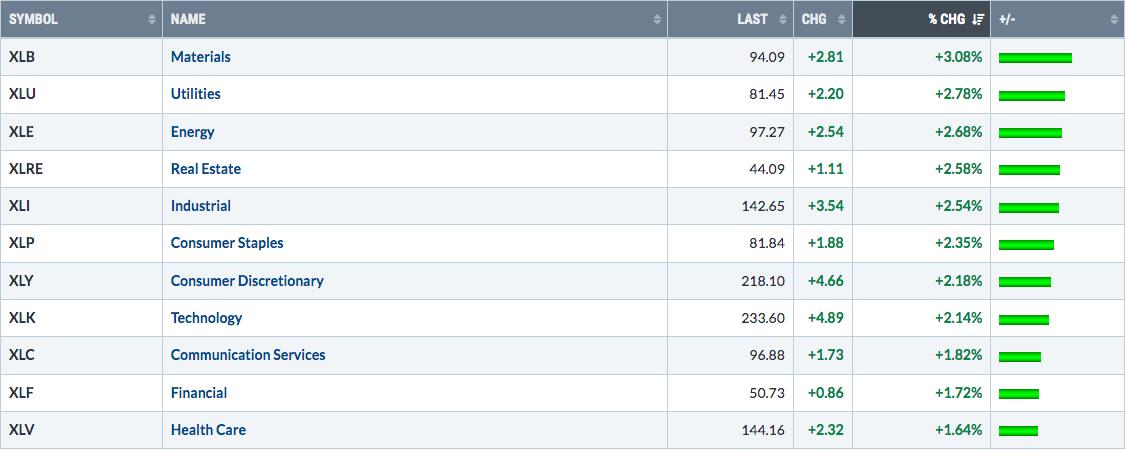
Sectors
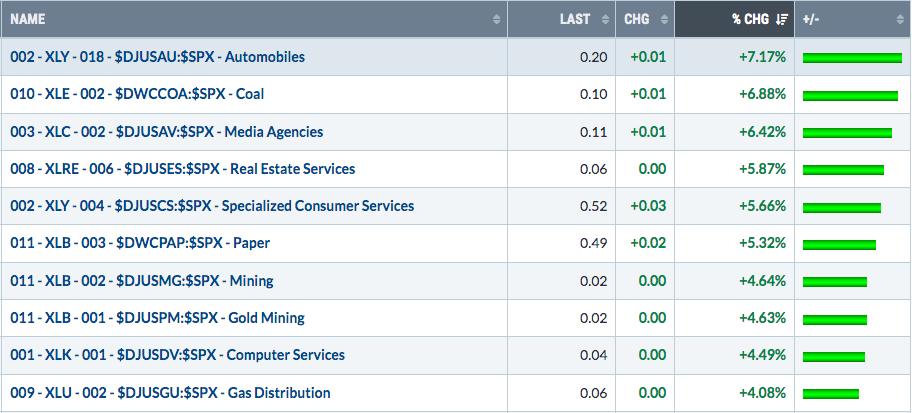
Top 10 Industries Last Week
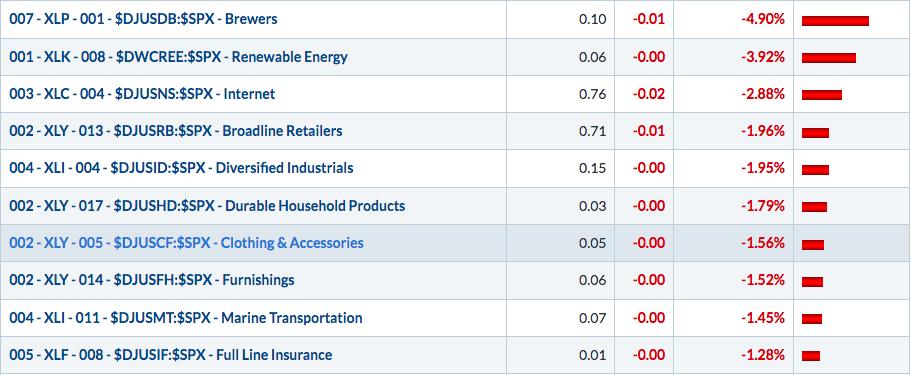
Bottom 10 Industries Last Week
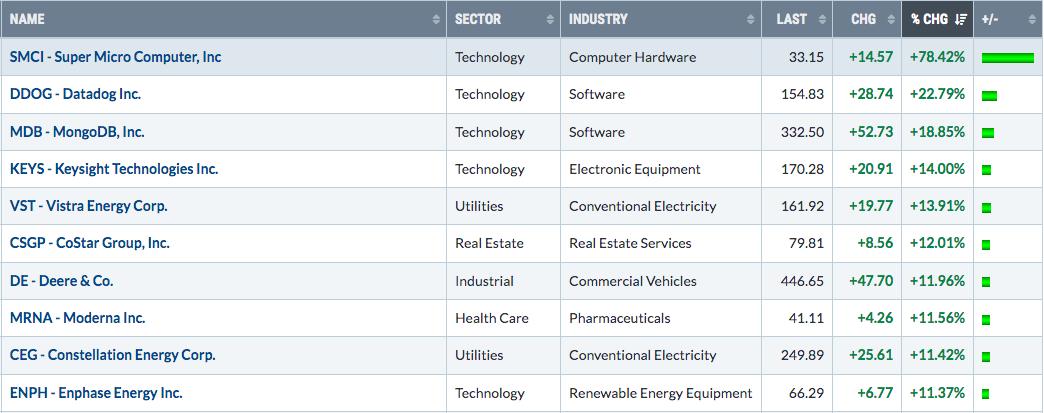
Top 10 Stocks - S&P 500/NASDAQ 100
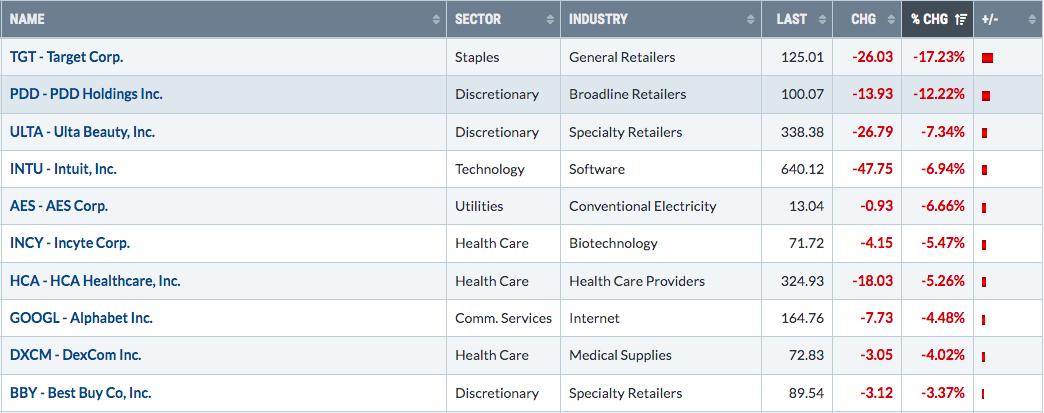
Bottom 10 Stocks - S&P 500/NASDAQ 100
Big Picture
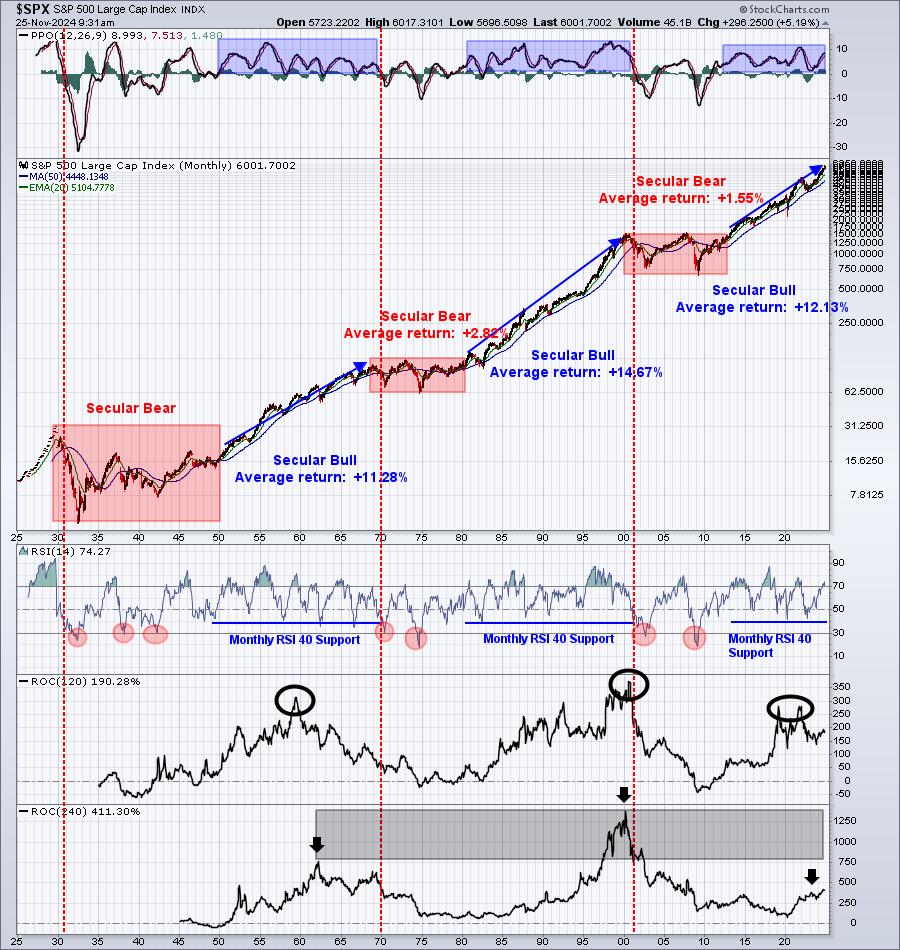
....and the secular bull market rages on.
Rotation/Intermarket Analysis
Here's the latest look at our key intraday ratios as we follow where the money is traveling on an INTRADAY basis (ignoring gaps):
QQQ:SPY
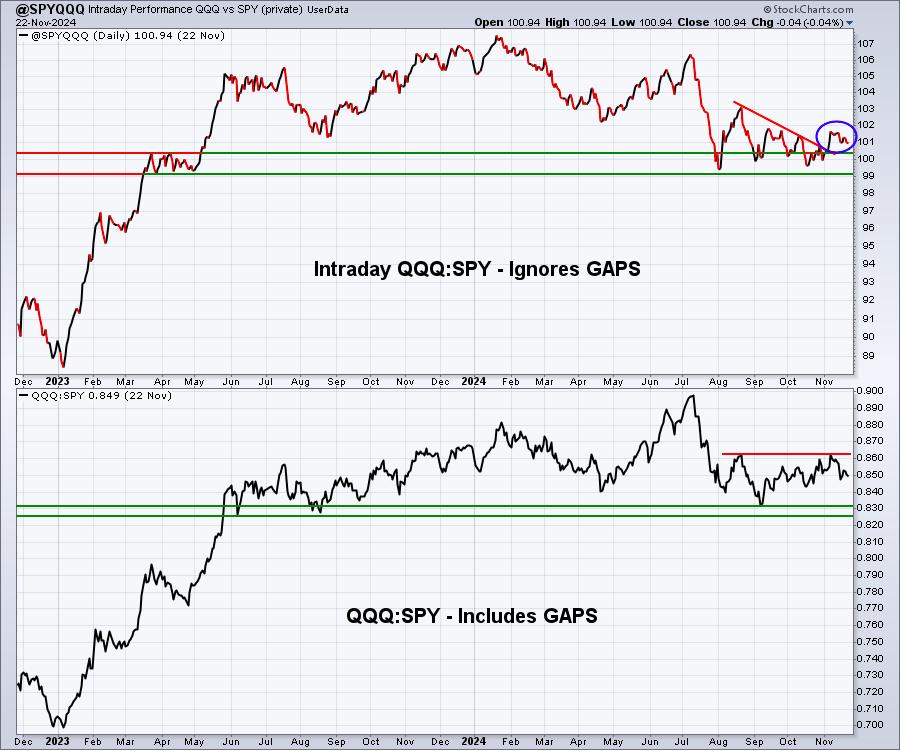
Both of these panels, excluding gaps and including gaps, show that relative support is holding and that's all we need to see for now. When the large cap technology names resume their leadership role, we'll see these ratios climb again. For now, however, we should probably expect continuing relative consolidation.
IWM:QQQ
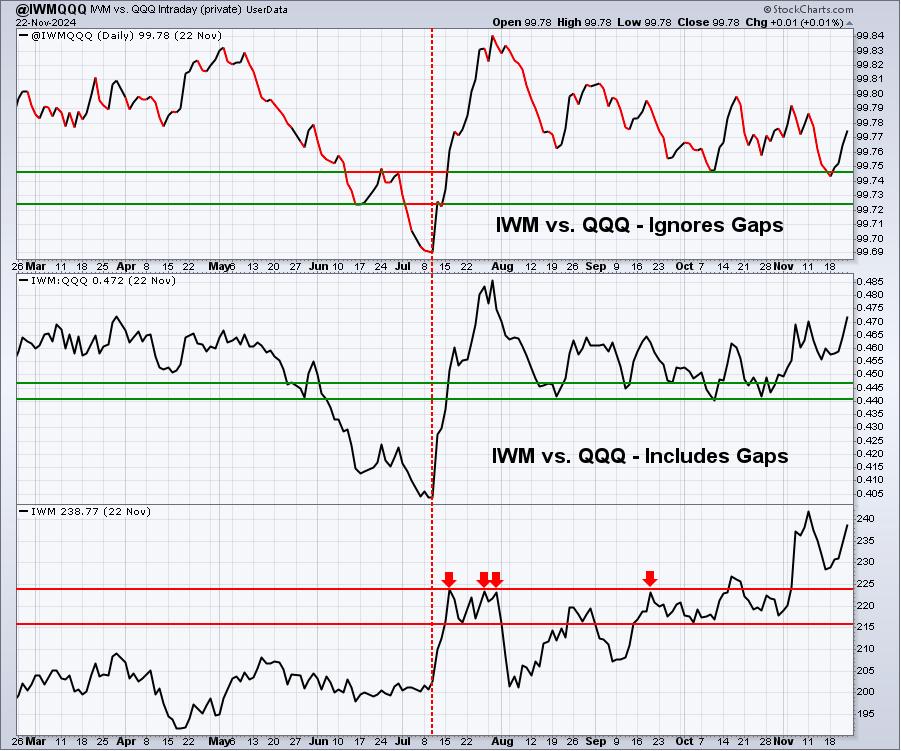
In the bottom panel, we see the IWM performing extremely well. Keep in mind that this chart only shows us activity through Friday. It does not include today's very bullish action. In a perfect world, we'd see a nice advance in the top panel of this chart, but the fact that it continues to hold recent relative support levels is enough for me - for now.
XLY:XLP
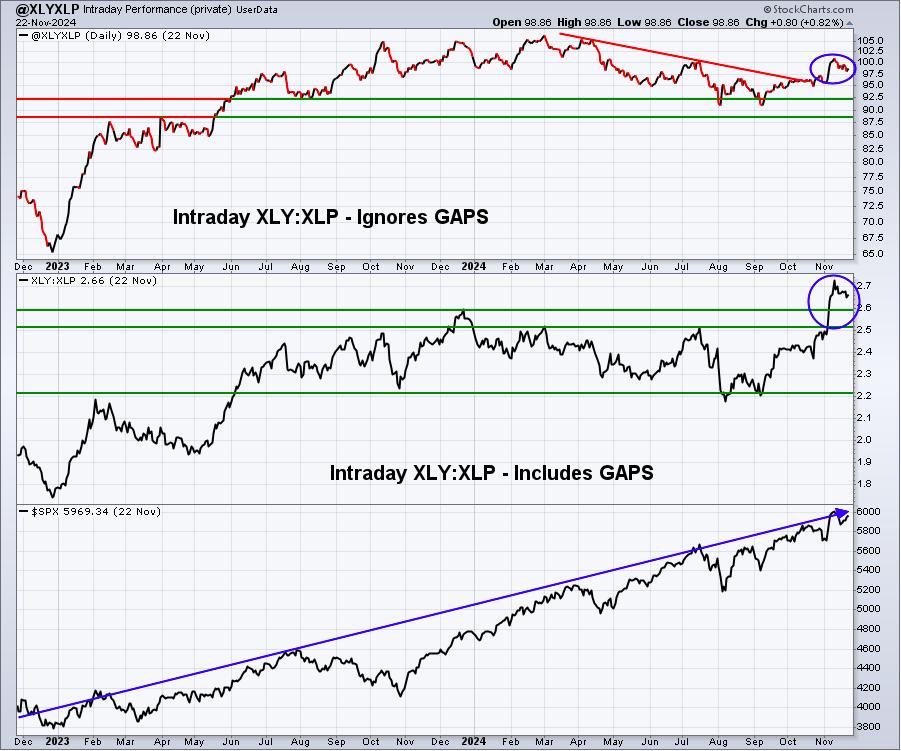
This chart remains quite bullish to me. We've seen recent breakouts in both ratios, which help to support the sustainability of a secular bull market advance.
Sentiment
5-day SMA ($CPCE)
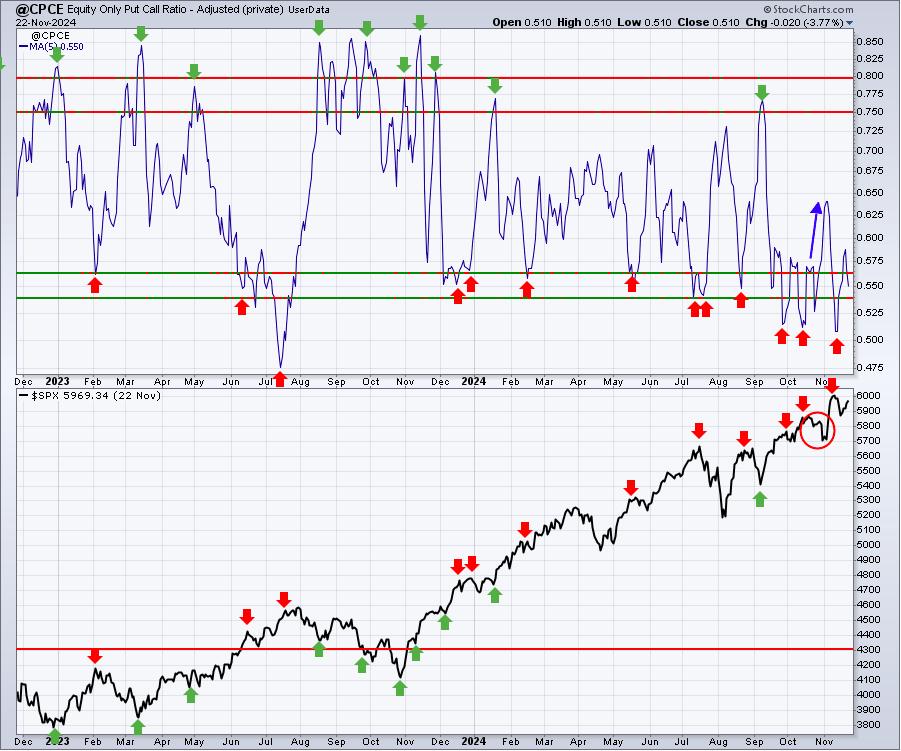
Sentiment indicators are contrarian indicators. When they show extreme bullishness, we need to be a bit cautious and when they show extreme pessimism, it could be time to become much more aggressive. Major market bottoms are carved out when pessimism is at its absolute highest level.
Readings on the 5-day SMA of the CPCE below .56 or so tell us that options traders are growing quite positive and complacent and these are marked with red arrows in the top panel. Red arrows in the bottom panel tell us where the S&P 500 was at the time of such complacency. While we don't look at this sentiment indicator and expect it to mark major market tops, you can see many short-term tops do coincide with these bullish readings.
Sector/Industry Focus
The biggest takeaway of late is that financials (XLF) and industrials (XLI) are continuing to lead on a relative basis. Here's a quick chart to illustrate their relative strength:
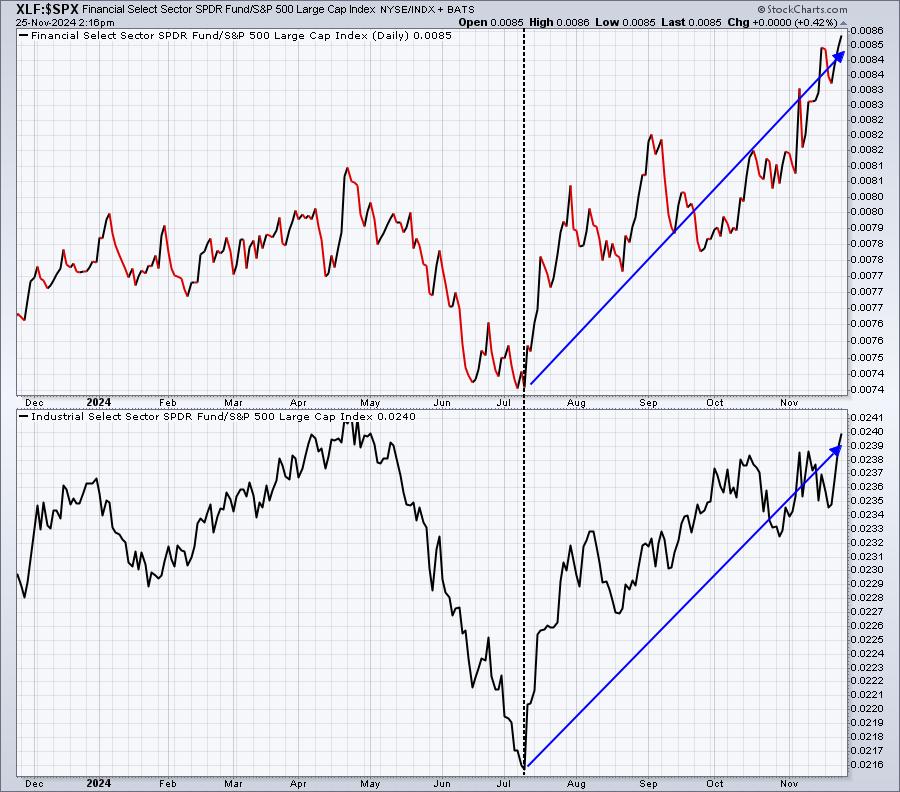
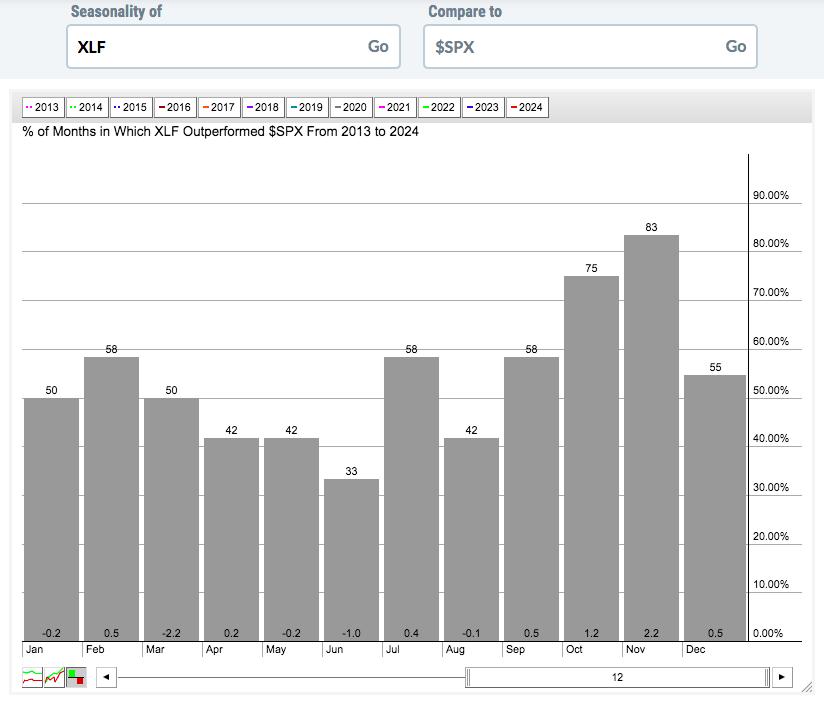
Does it get any clearer? All of this relative strength began the day that the June Core CPI data was released on July 11, 2024. That's the day when Wall Street (and EarningsBeats.com) began expecting the Fed to cut the fed funds rate. Wall Street has been making bets on these two groups ever since and it's paying off BIG TIME now. Q4 is also the time of the year when the XLF and XLI shine:
XLF:
XLI:
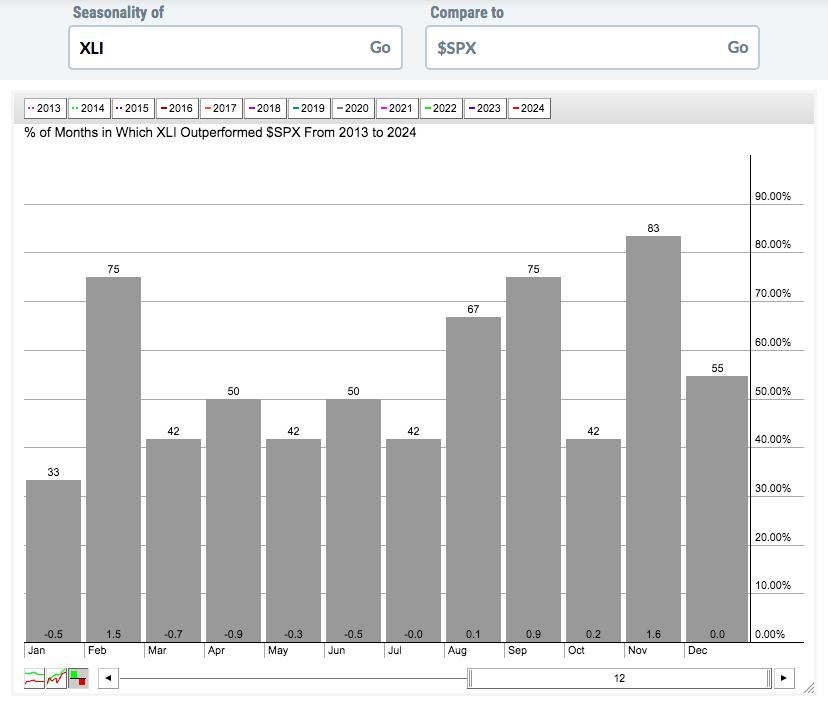
These historical tendencies go back 12 years, since April 2013, the confirmed start of this secular bull market. Both of these sectors show strong relative strength from September through December and we've discussed it at length over the past few months. This tendency, combined with fundamental reasons for strength in these areas, have led to a super rally.
Long-Term Trade Setup
Since beginning this Weekly Market Report over one year ago, I've discussed the long-term trade candidates below that I really like. Generally, these stocks have excellent long-term track records and many pay nice dividends that mostly grow every year. Only in very specific cases (exceptions) would I consider a long-term entry into a stock that has a poor or limited long-term track record and/or pays no dividends. Below is a quick recap of comments I made a couple weeks back on all of our long-term stocks:
- JPM - strong gap higher last week, following the banks
- BA - little impact from election results
- FFIV - gapped up Wednesday, looking to close at all-time high
- MA - broke out again o Wednesday and continuing to climb
- GS - financials have soared since the election and GS is riding the coattails
- FDX - today marking 5th straight day of gains
- AAPL - technology is initially lagging since the election as rotation to small and mid caps continues
- CHRW - nearing another breakout
- JBHT - transports got a big lift last week and JBHT going along for the ride
- STX - no significant impact last week
- HSY - broke down last week, but now bouncing to test key price resistance at 180
- DIS - gapped to a 4 1/2 month high last Wednesday and pushing higher since
- MSCI - moving higher now, but initially sold off last week
- SBUX - breaking out today above 100 for first time in nearly a year
- KRE - flying since the election as banks have been one of the best-performing industry groups
- ED - continuing to sell off, but should see solid support near 95
- AJG - consolidating and looking for another breakout at the 300 level
- NSC - again, the rising tide in transports lifting this boat
- RHI - massive jump last week as expected strengthening of economy would benefit companies like RHI
- ADM - tumbled last week, but rebounding off critical price support near 50
- BG - solid rebound with excellent volume last week
- CVS - spiked on election results, but selling off since
- IPG - ditto CVS
- HRL - down slightly since election
Keep in mind that our Weekly Market Reports favor those who are more interested in the long-term market picture. Therefore, the list of stocks above are stocks that we believe are safer (but nothing is ever 100% safe) to own with the long-term in mind. Nearly everything else we do at EarningsBeats.com favors short-term momentum trading, so I wanted to provide an explanation of what we're doing with this list and why it's different.
Also, please keep in mind that I'm not a Registered Investment Advisor (and neither is EarningsBeats.com nor any of its employees) and am only providing (mostly) what I believe to be solid dividend-paying stocks for the long-term. Companies periodically go through adjustments, new competition, restructuring, management changes, etc. that can have detrimental long-term impacts. The stock price nor the dividend is ever guaranteed. I simply point out interesting stock candidates for longer-term investors. Do your own due diligence and please consult with your financial advisor before making any purchases or sales of securities.
Looking Ahead
Upcoming Earnings
Q3 earnings season has, for the most part, ended. We still have a number of software stocks and retailers, but the overwhelming majority of market-moving earnings reports are behind us. The following list of companies is NOT a list of all companies scheduled to report quarterly earnings, however, just key reports, so please be sure to check for earnings dates of any companies that you own. Any company in BOLD represents a stock in one of our portfolios and the amount in parenthesis represents the market capitalization of each company listed:
- Monday: A ($38 billion), ZM ($25 billion)
- Tuesday: ADI ($106 billion), DELL ($98 billion), CRWD ($88 billion), WDAY ($71 billion), ADSK ($68 billion)
- Wednesday: None
- Thursday: None - Market Closed for Thanksgiving Day
- Friday: None
Key Economic Reports
- Monday: None
- Tuesday: September Case-Shiller home price index, September FHFA house price index, November consumer confidence, October new home sales, FOMC minutes
- Wednesday: October durable goods orders, Q3 GDP (2nd estimate), Q3 PCE (2nd estimate), initial jobless claims, November Chicago PMI, October personal income & spending, October pending home sales
- Thursday: None - Market Closed for Thanksgiving Day
- Friday: None
Historical Data
I'm a true stock market historian. I am absolutely PASSIONATE about studying stock market history to provide us more clues about likely stock market direction and potential sectors/industries/stocks to trade. While I don't use history as a primary indicator, I'm always very aware of it as a secondary indicator. I love it when history lines up with my technical signals, providing me much more confidence to make particular trades.
Below you'll find the next two weeks of historical data and tendencies across the 3 key indices that I follow most closely:
S&P 500 (since 1950)
- Nov 25: +33.24%
- Nov 26: +56.46%
- Nov 27: +52.79%
- Nov 28: +31.94%
- Nov 29: +5.46%
- Nov 30: +19.90%
- Dec 1: +15.70%
- Dec 2: +20.80%
- Dec 3: -37.54%
- Dec 4: +34.45%
- Dec 5: +36.61%
- Dec 6: +44.90%
- Dec 7: +22.82%
- Dec 8: +16.37%
NASDAQ (since 1971)
- Nov 25: +47.94%
- Nov 26: +77.78%
- Nov 27: +68.45%
- Nov 28: +57.67%
- Nov 29: -3.89%
- Nov 30: -21.23%
- Dec 1: +56.22%
- Dec 2: +39.30%
- Dec 3: -54.04%
- Dec 4: +22.34%
- Dec 5: +99.62%
- Dec 6: +13.03%
- Dec 7: +1.36%
- Dec 8: +53.51%
Russell 2000 (since 1987)
- Nov 25: +78.57%
- Nov 26: +22.50%
- Nov 27: +23.59%
- Nov 28: +63.14%
- Nov 29: +43.08%
- Nov 30: +45.26%
- Dec 1: -9.80%
- Dec 2: +121.88%
- Dec 3: -26.06%
- Dec 4: +32.13%
- Dec 5: +136.88%
- Dec 6: +48.07%
- Dec 7: -26.09%
- Dec 8: +93.55%
The S&P 500 data dates back to 1950, while the NASDAQ and Russell 2000 information date back to 1971 and 1987, respectively.
Final Thoughts
Small caps, mid caps, financials, industrials, transports, etc. have been flying and I'm not at all surprised. This is exactly what we've been looking for and expecting all year. Rate cuts are underway and Wall Street is positioning for what it believes will be a solid foundation for these groups to continue to lead. While I think financials and industrials could back off in Q1 2025, I would not overlook the MASSIVE potential ahead for small and mid caps. The struggle has been real for 3 years for these two asset classes, but there's precedence for significant outperformance from these areas and I expect we'll see it.
Looking ahead:
- Holiday-Shortened Week. Thanksgiving Day will be celebrated here in the U.S. on Thursday, November 28th and both the U.S. stock and bond markets will be closed. An abbreviated trading day on Friday will close at 1pm ET.
- Economic Reports. There'll be a large number of economic reports out this week, particularly on Wednesday.
- Volatility ($VIX). The VIX is down 2.56% today and is currently at 14.85. The S&P 500 has a LONG history of performing extremely well when the VIX trades below 17. We've now been there for all 14 days since Election Day.
- Interest Rates. I literally just spoke about a negative divergence on the 10-year treasury yield ($TNX) and a likely decline back to 4.10%-4.20%. One day later, the TNX is down 15 basis points to 4.26%. I see further weakness to 4.10% and then we'll see what happens from there.
- Psychological Levels. The S&P 500 is trying for a 2nd time to negotiate the 6000 level and, today, the Dow Jones moved within 0.4% of 45000 for the first time, before backing off. The Russell 2000 is rapidly approaching 2500, a level it's never cleared before. While I remain very bullish, hesitating at important psychological levels happens quite often. It would be very bullish to clear each of the 3 levels.
Feedback
If you'd like to share your thoughts on our Weekly Market Report, positive or negative, you can reach us at "[email protected]".
Happy trading!
Tom