
EB Weekly Market Report - Monday, December 9, 2024
ChartLists Updated
The following ChartLists were updated over the weekend and are available for viewing/downloading on our website:
- Strong Earnings (SECL)
- Strong Future Earnings (SFECL)
- Raised Guidance (RGCL)
- Bullish Trifecta (BTCL)
- Short Squeeze (SSCL)
Weekly Market Recap
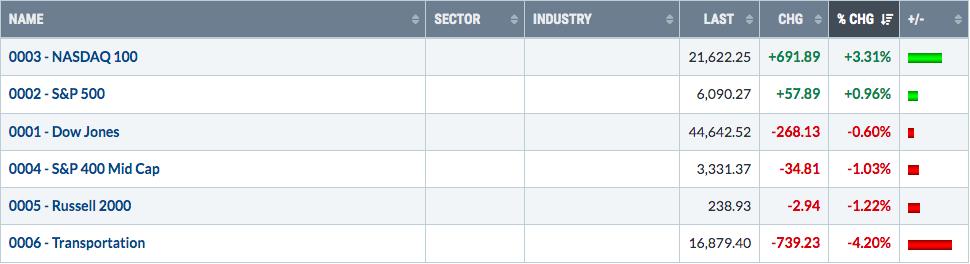
Major Indices
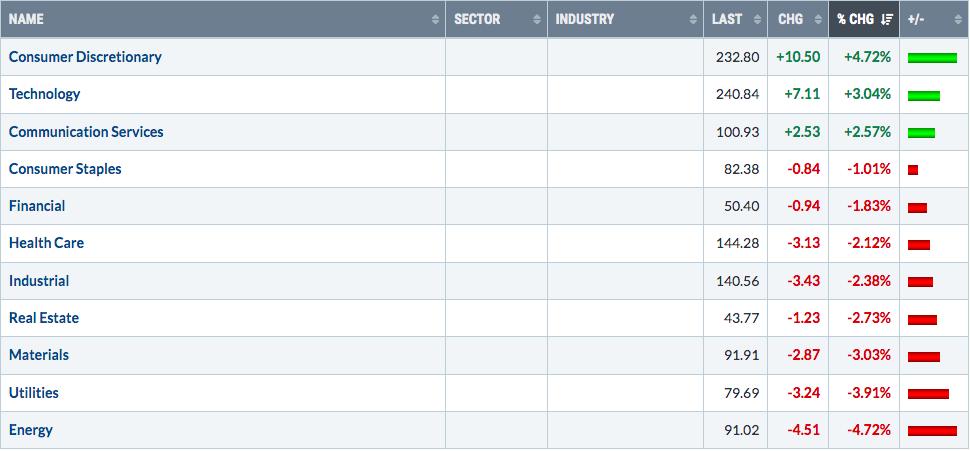
Sectors
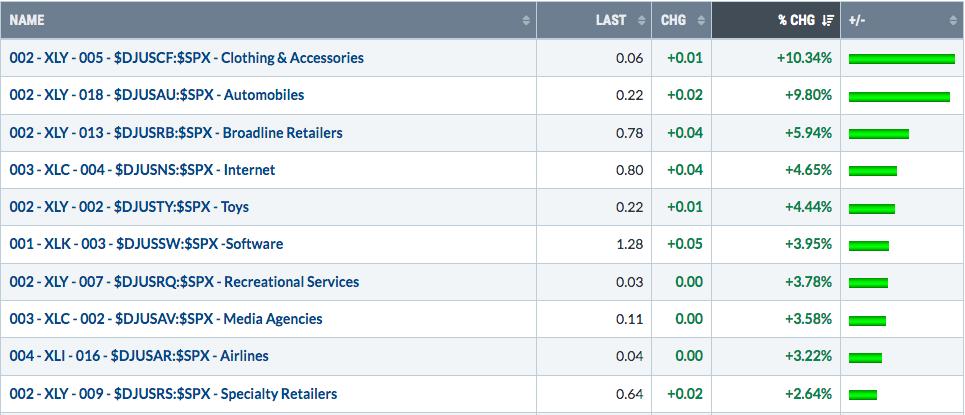
Top 10 Industries Last Week
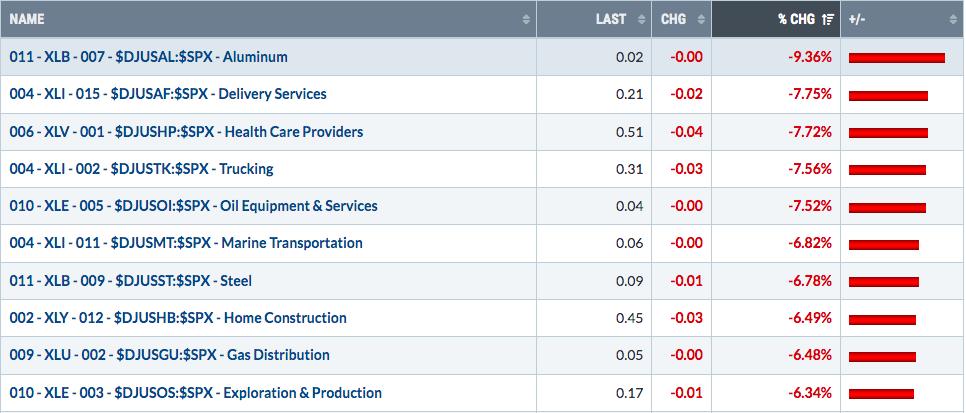
Bottom 10 Industries Last Week
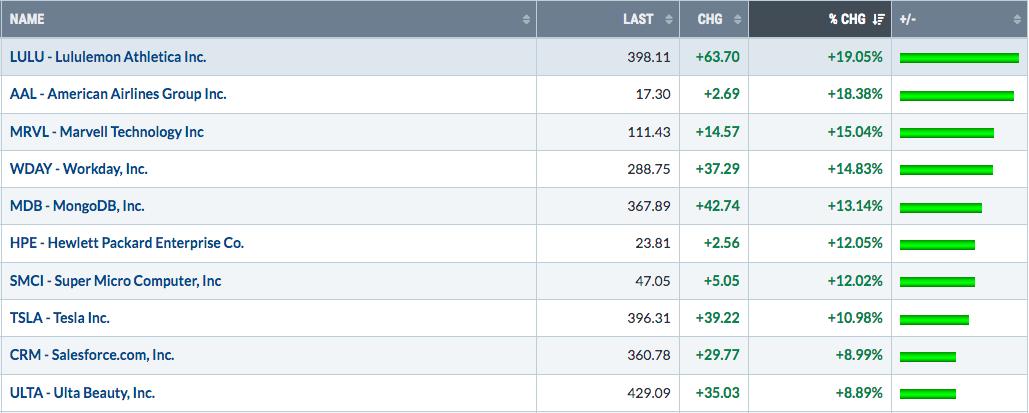
Top 10 Stocks - S&P 500/NASDAQ 100
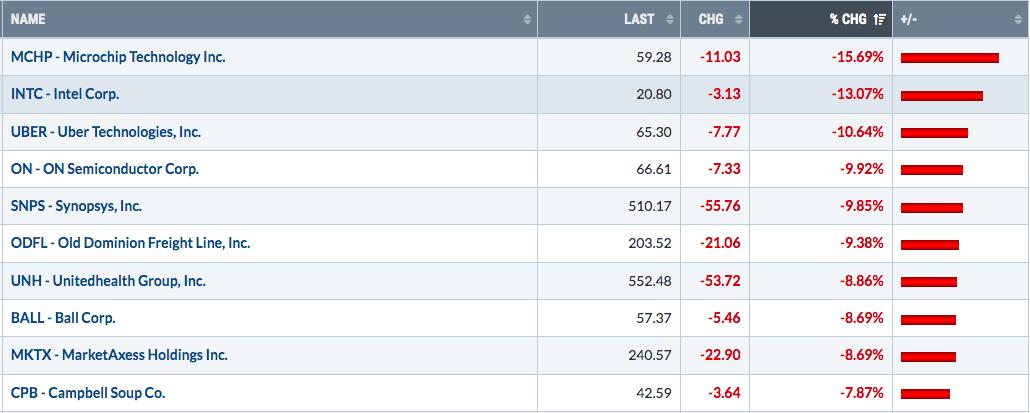
Bottom 10 Stocks - S&P 500/NASDAQ 100
Big Picture
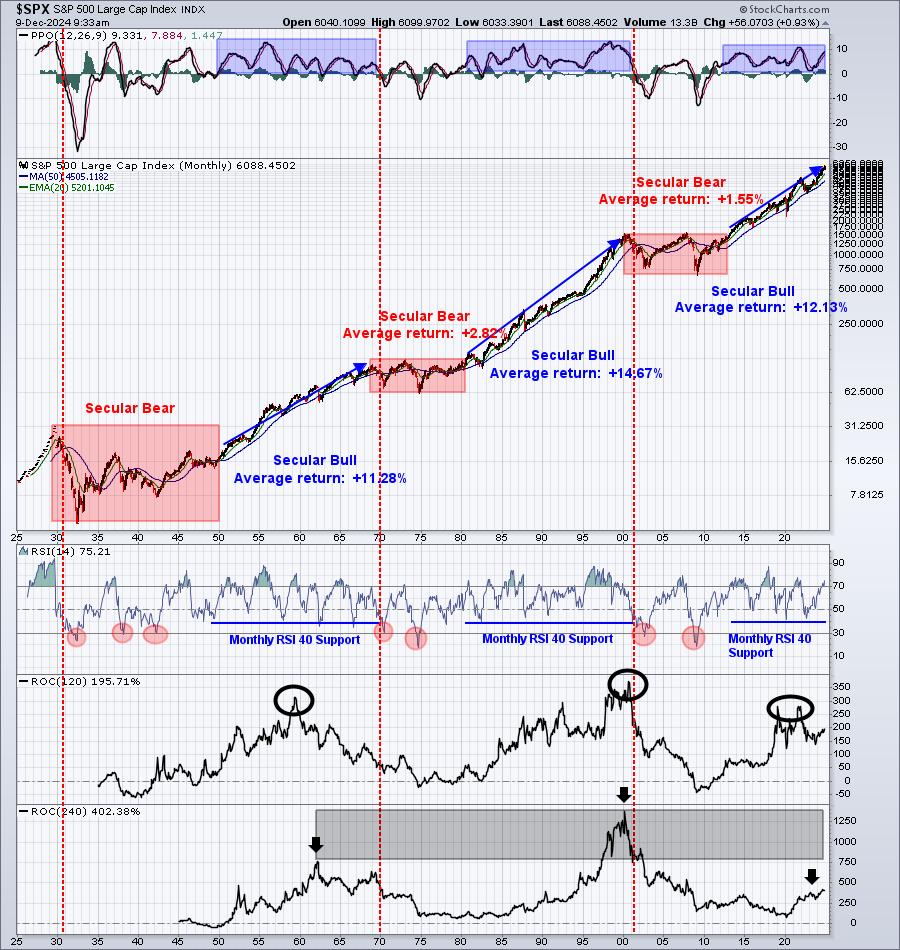
You can see in that bottom panel that our 240-month rate of change (ROC), or 20-year ROC, continues to trend higher and is now above 400%. Both prior secular bull markets saw this ROC top much, much higher, especially in year 2000. We still have a long way to go in this bull market, in my opinion.
Rotation/Intermarket Analysis
Here's the latest look at our key intraday ratios as we follow where the money is traveling on an INTRADAY basis (ignoring gaps):
QQQ:SPY
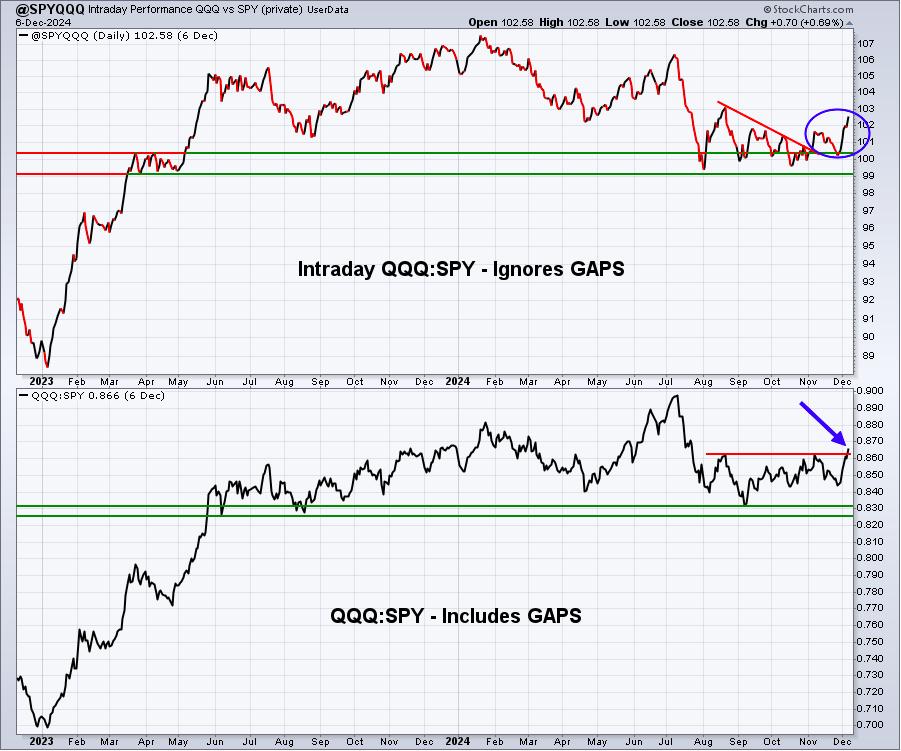
QQQ leadership returned in a big way last week as many of the Mag 7 stocks, much more weighted in the QQQ than in the SPY, either broke out or made hefty moves to the upside, or both. I'd say that it's possible we still remain in a longer-term relative downtrend, but another couple weeks like last week and can argument could be made that the relative bottom is in from back in the summertime.
IWM:QQQ
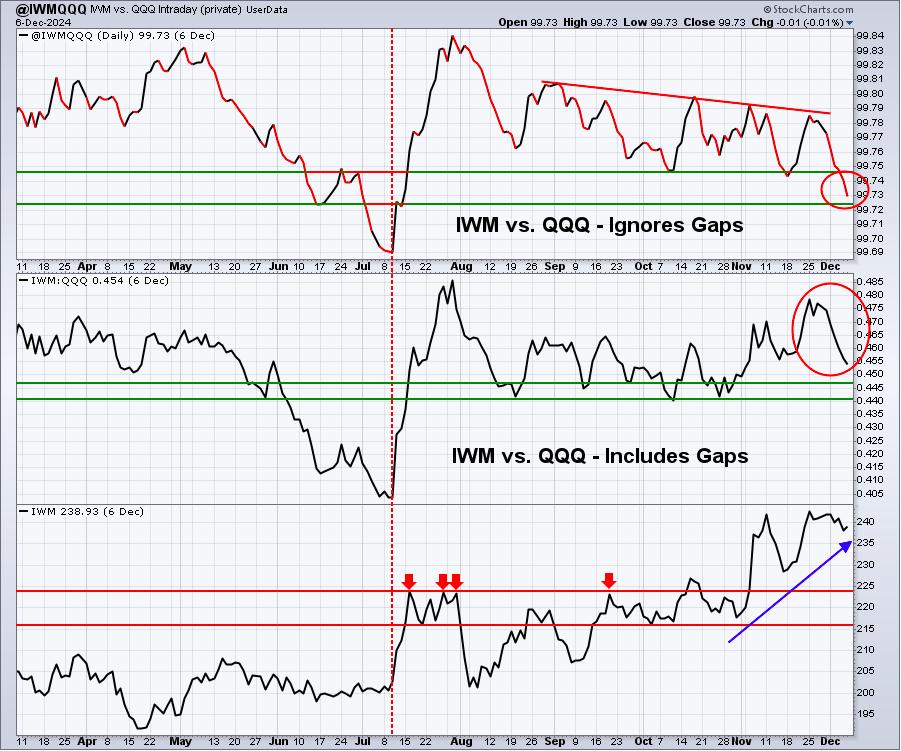
Small caps had been leading equities higher, especially since the second week of July. I'll give the IWM a pass for last week's underperformance, which likely stems from profit taking. I do want to see the small cap IWM begin to outperform again at some point this week.
XLY:XLP
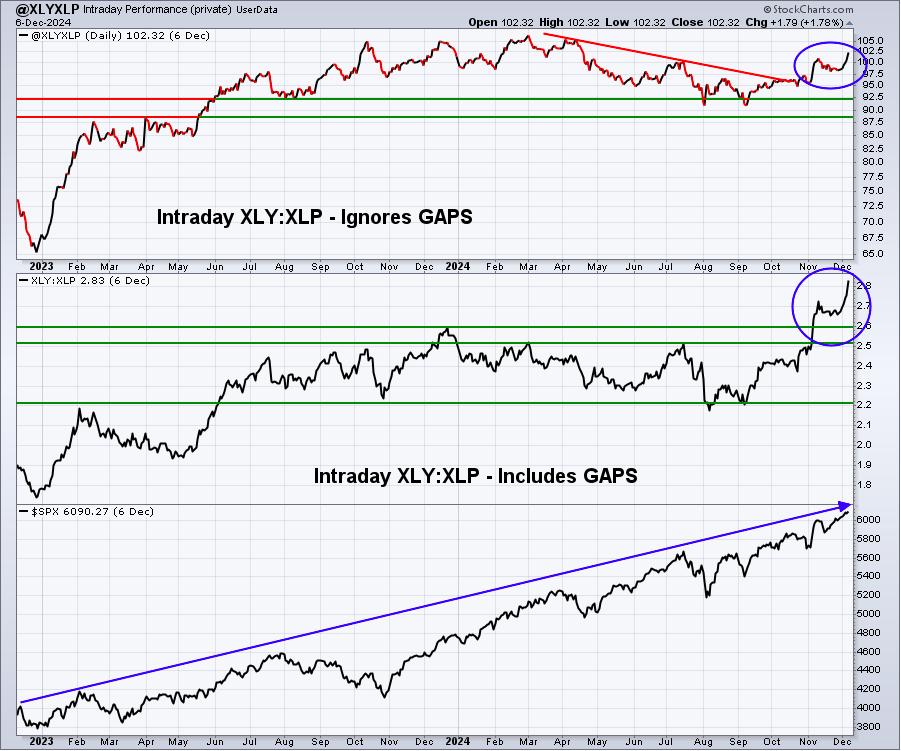
This is my favorite intermarket relationship and what I'd consider to be one of most important secondary indicators. We can debate which area(s) are the best to be invested in during the balance of December 2024 and throughout 2025, but the rising XLY:XLP ratio tells me I definitely want to remain invested in U.S. equities.
Sentiment
5-day SMA ($CPCE)
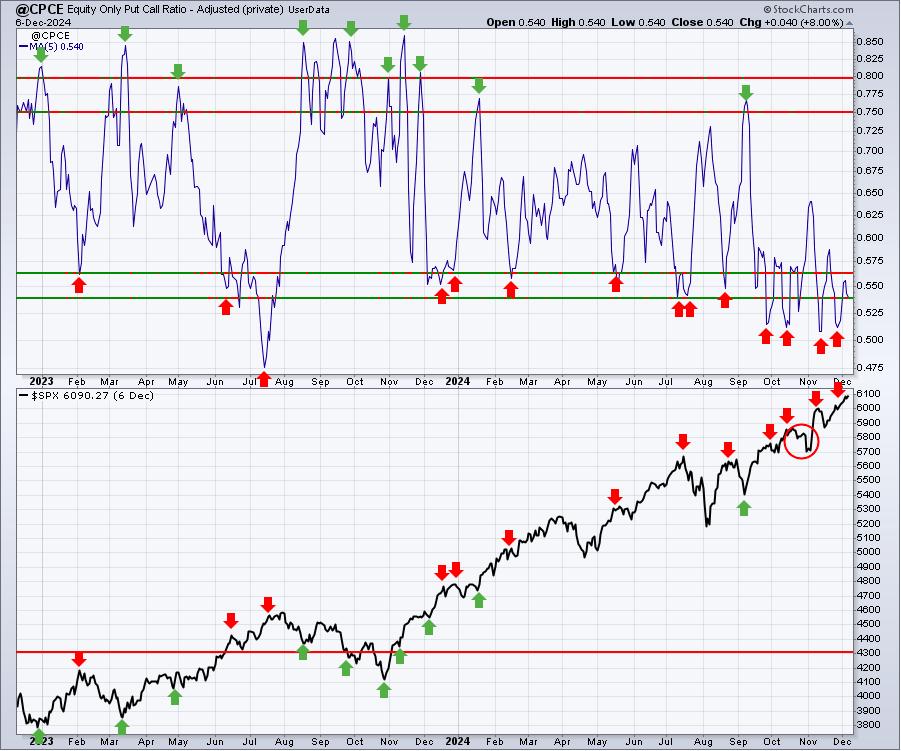
Sentiment indicators are contrarian indicators. When they show extreme bullishness, we need to be a bit cautious and when they show extreme pessimism, it could be time to become much more aggressive. Major market bottoms are carved out when pessimism is at its absolute highest level.
Readings on the 5-day SMA of the CPCE below .56 or so tell us that options traders are growing quite positive and complacent and these are marked with red arrows in the top panel. Red arrows in the bottom panel tell us where the S&P 500 was at the time of such complacency. While we don't look at this short-term sentiment indicator and expect it to mark major long-term market tops, you can see many short-term tops do coincide with these bullish readings. We have another short-term topping signal right now, but remember, sometimes all it takes is a little selling. I'm not talking about a correction, or even 3-5%. Perhaps we see a bit of sideways consolidation. I definitely would NOT short the stock market. Personally, I'm remaining long, but have exited leveraged products.
253-day SMA ($CPCE)
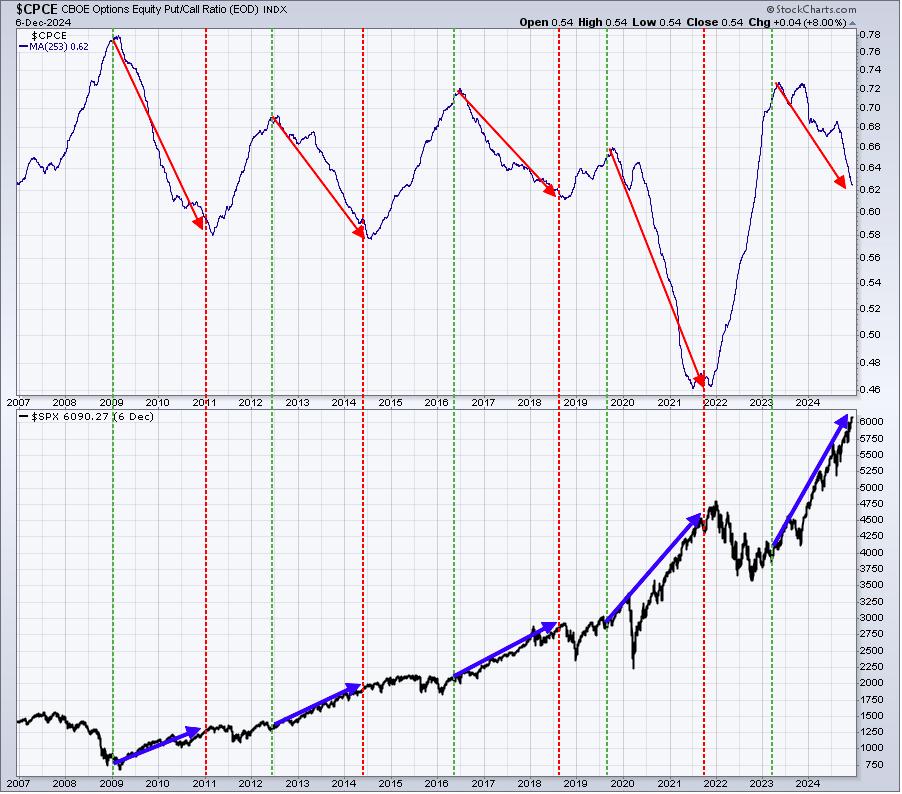
This is the long-term sentiment signal from the CPCE. It's telling me that the current freefall in bearish sentiment is pointing to higher U.S. equity prices, just as it's done in prior years.
Long-Term Trade Setup
Since beginning this Weekly Market Report in September 2023, I've discussed the long-term trade candidates below that I really like. Generally, these stocks have excellent long-term track records and many pay nice dividends that mostly grow every year. Only in very specific cases (exceptions) would I consider a long-term entry into a stock that has a poor or limited long-term track record and/or pays no dividends. Below is a quick recap of how I viewed their long-term technical conditions as of last week:
- JPM - pulling back from slightly overbought condition; also, weekly negative divergence could play a role
- BA - rallying of late, but failed at 160 price resistance and 20-week EMA resistance; need to clear 160
- FFIV - has reached new all-time highs; overbought, but still climbing
- MA - strength continues here as well
- GS - certainly benefiting from strength in financials
- FDX - 310 is the clear resistance level now
- AAPL - has broken out to another all-time high
- CHRW - climbed to 110-115 level to test August 2022 high; pulling back and unwinding overbought conditions
- JBHT - bounced beautifully off 150 price support; transports are hot and helping many stocks like JBHT
- STX - remaining above the rising 50-week SMA
- HSY - to resume strength, needs to clear both price resistance at 180 and the declining 20-week EMA at 183
- DIS - rising, but now approaching critical overhead price resistance from 120-125
- MSCI - rising and getting closer to 2021 price resistance just above 650
- SBUX - uptrend is intact and 110 price resistance from July 2021 awaits
- KRE - been awesome since July 2023 and likely heading for key price resistance test at 72.50
- ED - held key price support at 95 and is now trending back towards resistance near 107 - that's the range
- AJG - steady strength continues
- NSC - transports aiding here and NSC faces a huge price resistance test at 280 from late-2021 high
- RHI - now trending higher, keep an eye on rising 20-week EMA, currently at 69
- ADM - continues its rebound off 50
- BG - still remains beneath its declining 20-week EMA; 75-80 is BG's key price support range
- CVS - in a significant downtrend, but 44-45 is an extremely important price support level
- IPG - moving through 32 would be bullish; until then, watch 26-32 range
- HRL - 28-29 is key support, while a move through 36 resistance is ultimately what shareholders want to see
Keep in mind that our Weekly Market Reports favor those who are more interested in the long-term market picture. Therefore, the list of stocks above are stocks that we believe are safer (but nothing is ever 100% safe) to own with the long-term in mind. Nearly everything else we do at EarningsBeats.com favors short-term momentum trading, so I wanted to provide an explanation of what we're doing with this list and why it's different.
Also, please keep in mind that I'm not a Registered Investment Advisor (and neither is EarningsBeats.com nor any of its employees) and am only providing (mostly) what I believe to be solid dividend-paying stocks for the long-term. Companies periodically go through adjustments, new competition, restructuring, management changes, etc. that can have detrimental long-term impacts. The stock price nor the dividend is ever guaranteed. I simply point out interesting stock candidates for longer-term investors. Do your own due diligence and please consult with your financial advisor before making any purchases or sales of securities.
Looking Ahead
Upcoming Earnings
We're now into December, so the number of earnings reports expected out has declined significantly. The following list of companies is NOT a list of all companies scheduled to report quarterly earnings, however, just key reports, so please be sure to check for earnings dates of any companies that you own. Any company in BOLD represents a stock in one of our portfolios and the amount in parenthesis represents the market capitalization of each company listed:
- Monday: ORCL ($516 billion), MDB ($25 billion)
- Tuesday: AZO ($54 billion), FERG ($43 billion)
- Wednesday: ADBE ($237 billion)
- Thursday: AVGO ($796 billion), COST ($435 billion)
- Friday: None
Key Economic Reports
- Monday: None
- Tuesday: Q3 productivity & costs
- Wednesday: November CPI
- Thursday: Initial jobless claims November PPI
- Friday: None
Historical Data
I'm a true stock market historian. I am absolutely PASSIONATE about studying stock market history to provide us more clues about likely stock market direction and potential sectors/industries/stocks to trade. While I don't use history as a primary indicator, I'm always very aware of it as a secondary indicator. I love it when history lines up with my technical signals, providing me much more confidence to make particular trades.
Below you'll find the next two weeks of historical data and tendencies across the 3 key indices that I follow most closely:
S&P 500 (since 1950)
- Dec 9: -7.56%
- Dec 10: +9.26%
- Dec 11: -41.19%
- Dec 12: +2.75%
- Dec 13: -0.12%
- Dec 14: -62.95%
- Dec 15: -17.54%
- Dec 16: +84.28%
- Dec 17: +10.13%
- Dec 18: +65.62%
- Dec 19: -4.16%
- Dec 20: -37.61%
- Dec 21: +75.04%
- Dec 22: +32.01%
NASDAQ (since 1971)
- Dec 9: -69.02%
- Dec 10: +53.82%
- Dec 11: -86.19%
- Dec 12: -14.96%
- Dec 13: -61.84%
- Dec 14: -109.19%
- Dec 15: -29.80%
- Dec 16: +89.58%
- Dec 17: +21.88%
- Dec 18: +53.34%
- Dec 19: -52.66%
- Dec 20: -50.85%
- Dec 21: +114.64%
- Dec 22: +86.55%
Russell 2000 (since 1987)
- Dec 9: -90.45%
- Dec 10: -18.96%
- Dec 11: -104.36%
- Dec 12: +16.47%
- Dec 13: -38.62%
- Dec 14: -87.43%
- Dec 15: -36.23%
- Dec 16: +124.77%
- Dec 17: +42.46%
- Dec 18: +37.06%
- Dec 19: -46.12%
- Dec 20: +23.20%
- Dec 21: +160.91%
- Dec 22: +72.84%
The S&P 500 data dates back to 1950, while the NASDAQ and Russell 2000 information date back to 1971 and 1987, respectively.
Final Thoughts
Last week was a bit strange. December tends to be a solid month, but it usually favors more defensive, value-oriented, and dividend-paying stocks. Typically, aggressive groups tend to lack. But instead, we saw a solid week outside of small and mid caps, one that included several breakouts among the Mag 7 stocks. Generally speaking, growth outperformed value. While it's too early to tell if this will be the theme all month, it definitely was the theme last week. Here are a few things on my mind as this new trading week unfolds:
- Historical Weakness. While I wouldn't be overly pessimistic during a secular bull market advance, it is important to at least understand that this week (December 9th through December 15th) tends to be the most bearish period in December.
- Jobs Report. Friday's jobs report was a reminder that the U.S. economy remains quite resilient, but it also suggests another rate cut is likely next Wednesday. So let's get through this week and then potentially we could see a big rebound in small caps as attention turns to rate cuts.
- Volatility ($VIX). The VIX is popping today back towards 14 as we see some market selling to kick off the week - not too surprising given historical weakness this week. Still, the VIX remains well below 17 and the stock market generally performs well with the VIX beneath 17 (and especially 13).
- Mag 7. Stocks like AAPL, META, and AMZN pushed to new all-time highs last week. TSLA surged, but is still a bit short of its all-time high at 414.
- Top 16 Stocks. If you recall the Bowley Trend report where we provided historical tendencies on the S&P 500 since 1950, then you may also recall Part 2 of that Bowley Trend series, where we tracked historical performance of 16 key growth stocks. During the 3rd month of calendar quarters (March, June, September, and December), the top performers were AVGO and TSLA. AVGO reports its quarterly results on Thursday and has the opportunity for a MAJOR breakout. I'll leave you with this AVGO chart, showing a TON of consolidation, awaiting a KEY breakout:
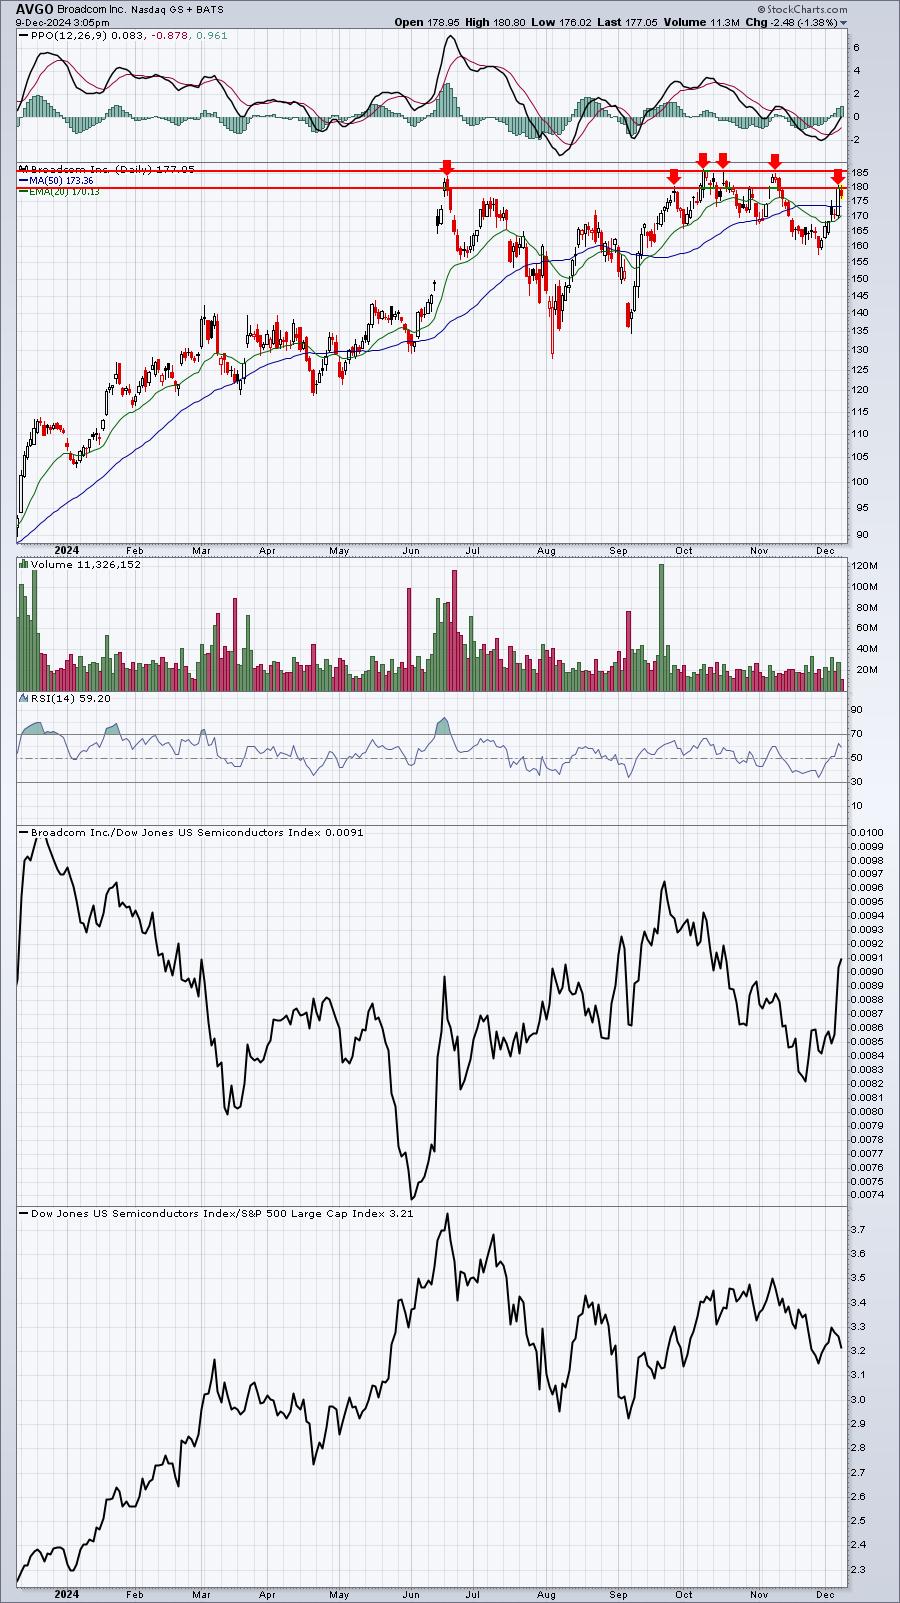
I'm not claiming that we'll see a breakout, because the relative strength on AVGO, quite honestly, isn't all that great. It's also a part of a relatively weak semiconductor group ($DJUSSC). However, if the report is strong and AVGO breaks out above the 180-185 resistance zone, just be aware that it could start a big run, given AVGO's historical track record in December.
Feedback
If you'd like to share your thoughts on our Weekly Market Report, positive or negative, you can reach us at "[email protected]".
Happy trading!
Tom