
EB Weekly Market Report - Monday, December 23, 2024
Thank You!
On behalf of our EarningsBeats.com team, I'd like to say Thank You to our members for all your support in 2024. We look forward to your continued support in 2025. We would not be able to follow our passion and provide you with expert market guidance, research, and education without this support.
We certainly wish all of you a healthy, prosperous year in 2025!
Holiday Schedule
Customer Service
From Tuesday, December 24th through Wednesday, January 1st, we'll have a skeletal crew, checking in periodically. But don't be surprised if it takes us a bit longer to respond during the holidays.
ChartLists
As I mention below, ChartLists have been updated and should be on our website by Monday. However, it is very unlikely that any ChartList will be updated again prior to Friday, January 10th (other than the Short Squeeze ChartList). There will be few earnings reports released prior to the January 6-10 week.
Reports
An abbreviated Daily Market Report (DMR) will be issued on Tuesday, December 24th. There'll likely be one or two DMRs issued between December 25th and January 1st. It'll likely depend on how volatile the action is. If we experience more days of heavy selling, there'll likely be more DMRs. But if volatility continues lower and any selling is fairly contained, then we'll probably issue just one more DMR after Christmas and prior to the New Year.
YouTube Videos - EarningsBeats.com
No change. Trading Places Live will be as scheduled on Tuesday, December 24th at 9:00am ET and Tuesday, December 31st at 9:00am ET. Also, our Weekly Market Recap video will be recorded the weekend of December 27-29, but we're unsure of the day or time currently.
YouTube Videos - StockCharts.com
My normal Thursday video will be recorded on Friday, December 27th after the market closes, so look for the publishing on YouTube to take place later that evening or on Saturday, December 28th. The next weekly recap recording should take place as usual - on Thursday, January 2nd.
Live Trading Room
There will be no Live Trading Room the next two weeks as Wednesdays fall on Christmas and New Year's Day.
MarketVision 2025
It's hard to believe, but another MarketVision event is just around the corner! This year, it will be held on Saturday, January 4, 2025, and it will be recorded for those of you who cannot attend the Live event, or simply want to listen to the recording as a refresher later. David Keller, CMT, President and Chief Strategist at Alpha Sierra Research LLC, will be joining us this year, so it should prove to be a very educational event. And, of course, I'm looking forward to sharing my 2025 Stock Market Forecast and keeping my 5-year winning streak alive!
All Annual Members are invited to MarketVision 2025 FREE OF CHARGE! You do not need to register for the event and we'll send you room instructions prior to the Saturday, January 4, 2025 event. If you are a monthly or trial member, now is a great time to extend your membership using our huge Annual membership savings and join us at MarketVision 2025 for FREE. Please contact "[email protected]" for more information and details, so you don't miss this big event!
ChartLists Updated
The following ChartLists were updated over the weekend and are available for viewing/downloading on our website:
- Strong Earnings (SECL)
- Strong Future Earnings (SFECL)
- Raised Guidance (RGCL)
- Bullish Trifecta (BTCL)
There'll be few earnings reports out over the holidays, so we will not be updating our ChartLists again until Friday, January 10th, except for the Short Squeeze ChartList (SSCL). That will be updated once, perhaps even twice over the next 3 weeks.
Weekly Market Recap
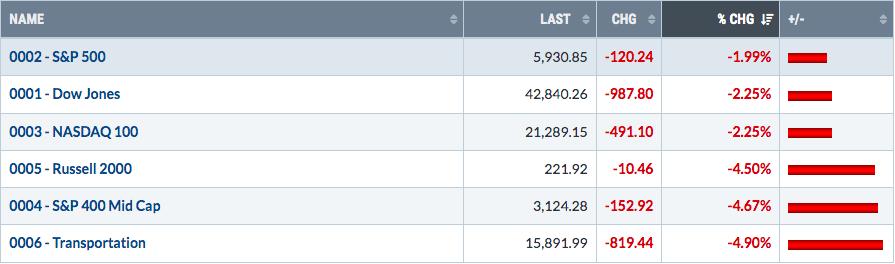
Major Indices
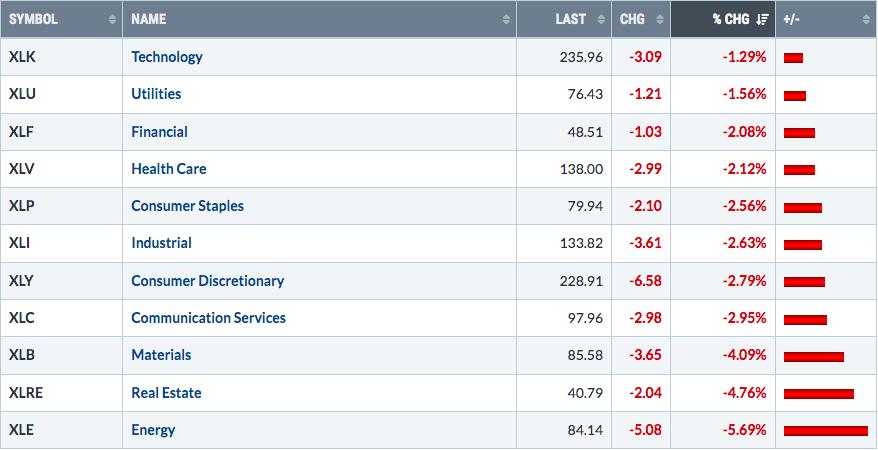
Sectors
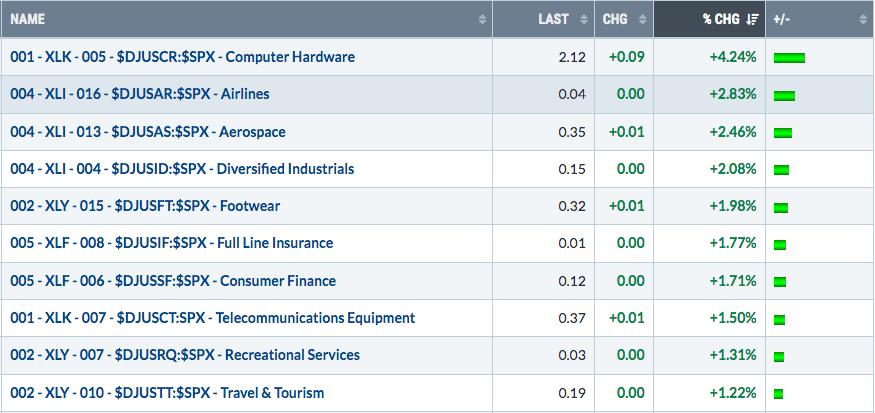
Top 10 Industries Last Week
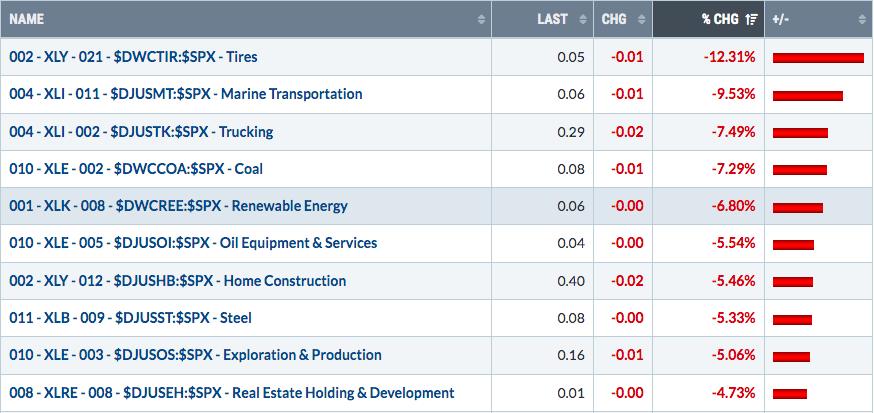
Bottom 10 Industries Last Week
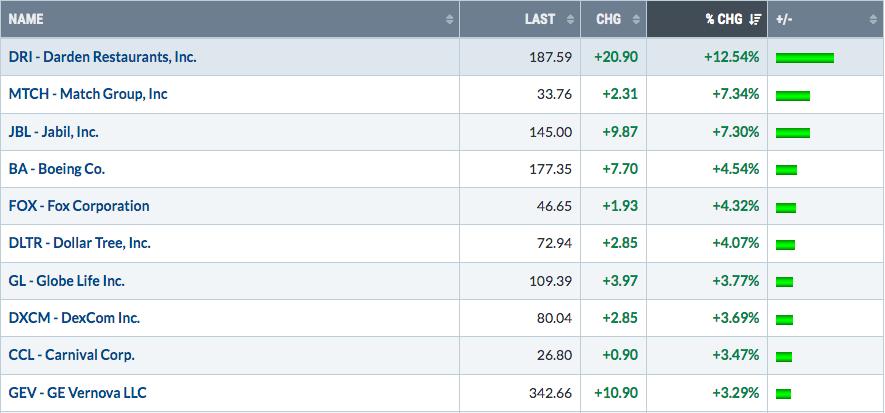
Top 10 Stocks - S&P 500/NASDAQ 100
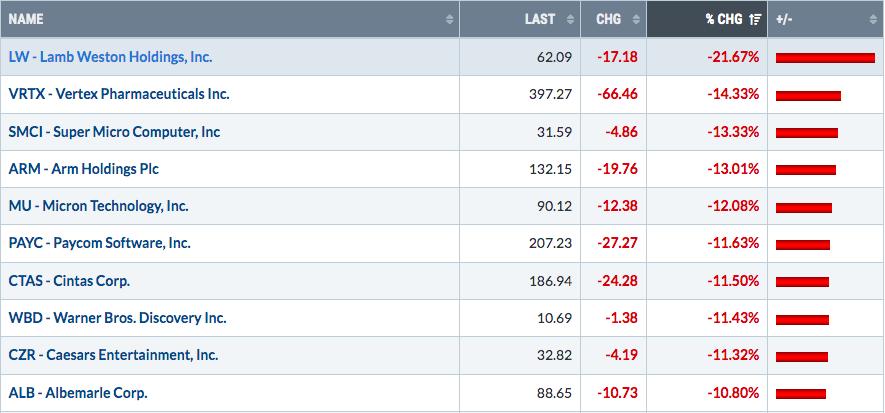
Bottom 10 Stocks - S&P 500/NASDAQ 100
Big Picture
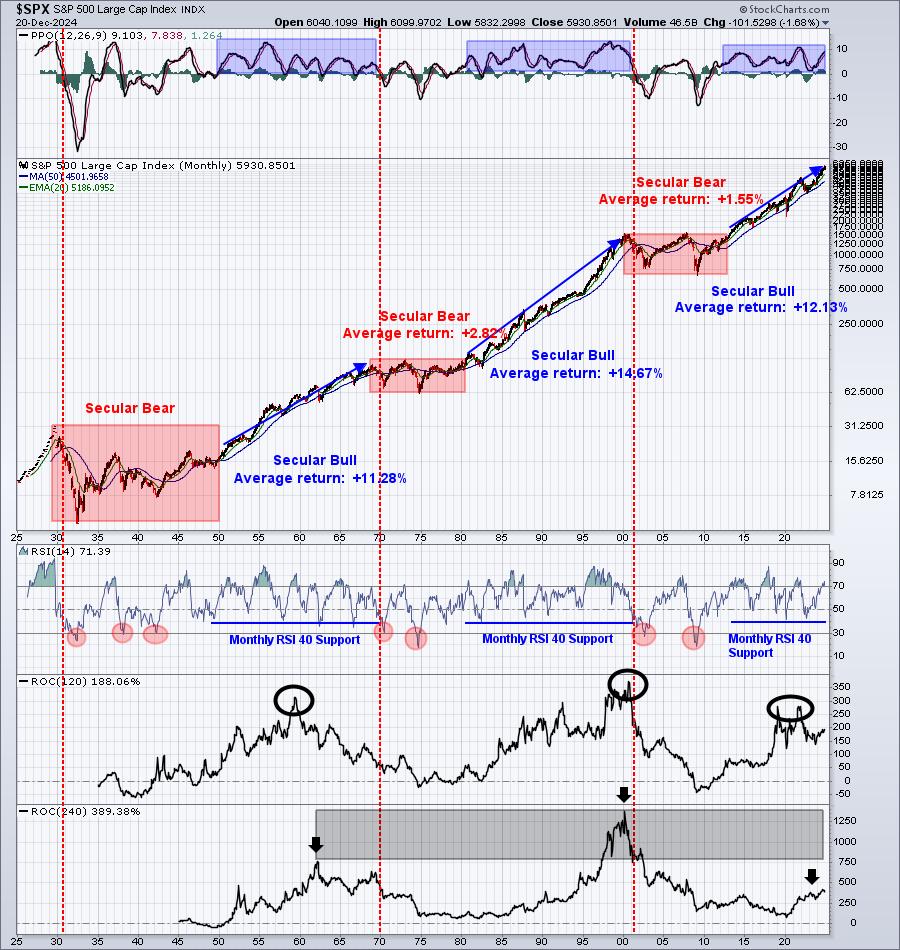
The S&P 500 has moved back down below 6000 and was below 5850 during Friday's trading session. From the chart above, however, you can see that the monthly PPO remains in a solid uptrend and that this LONG-TERM chart shows absolutely ZERO technical damage. That's the beauty of using this 100-year chart. It offers long-term perspective and doesn't encourage us to sell every time the stock market has a hiccup.
Long-term investors should remain long and strong as we speed towards 2025.
Sustainability Ratios
As we approach the end of 2024 and still feel the effects of last week's Fed-related and/or max pain-related selling, it's an appropriate time to see how the S&P 500 is performing, relative to key sustainability ratios. Check this out:
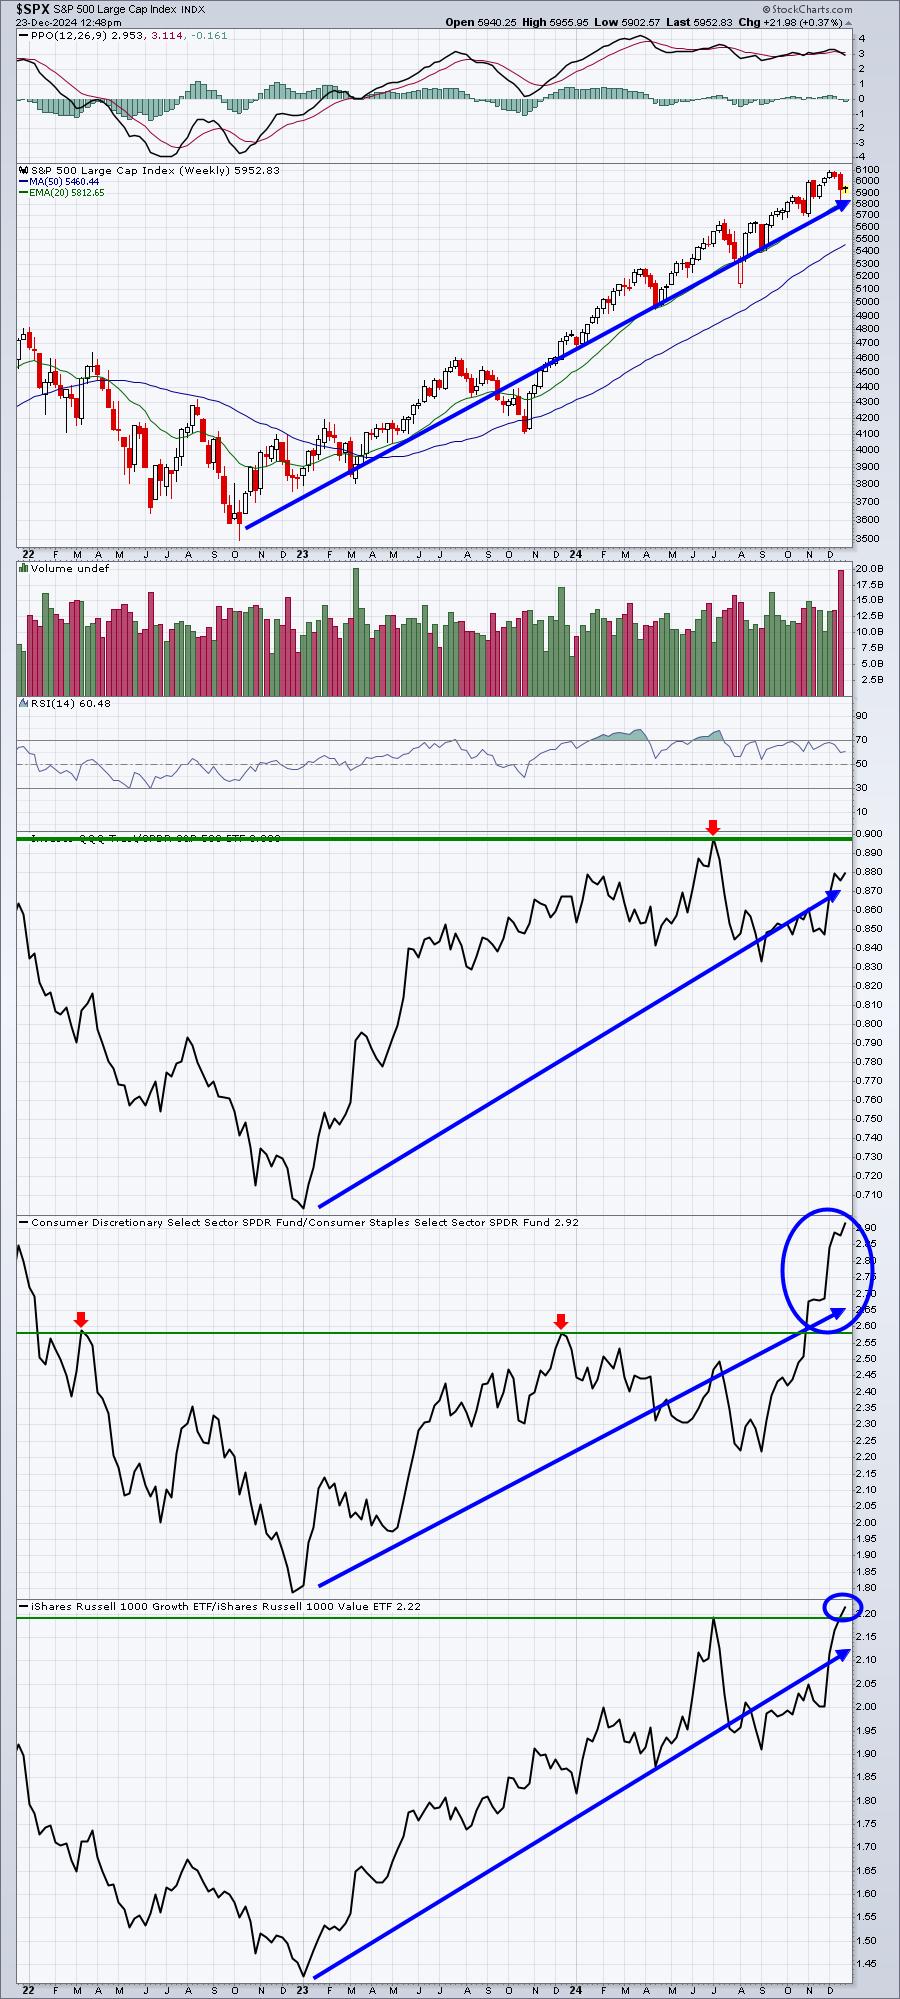
These 3 ratios have strong positive correlation with the S&P 500, meaning that when one goes up or down, the other tends to follow along in the same direction. Currently, the S&P 500 is clearly trending higher, while the 3 sustainability ratios are also in uptrends. The only worrisome piece of evidence here is that we haven't yet see a breakout in the QQQ vs. the SPY. Historically, we tend to see that relative outperformance in months other than the final calendar month of each calendar quarter (Mar, Jun, Sep, Dec). Check out this seasonality chart for the past 12 years (since the secular bull market was confirmed in 2013):
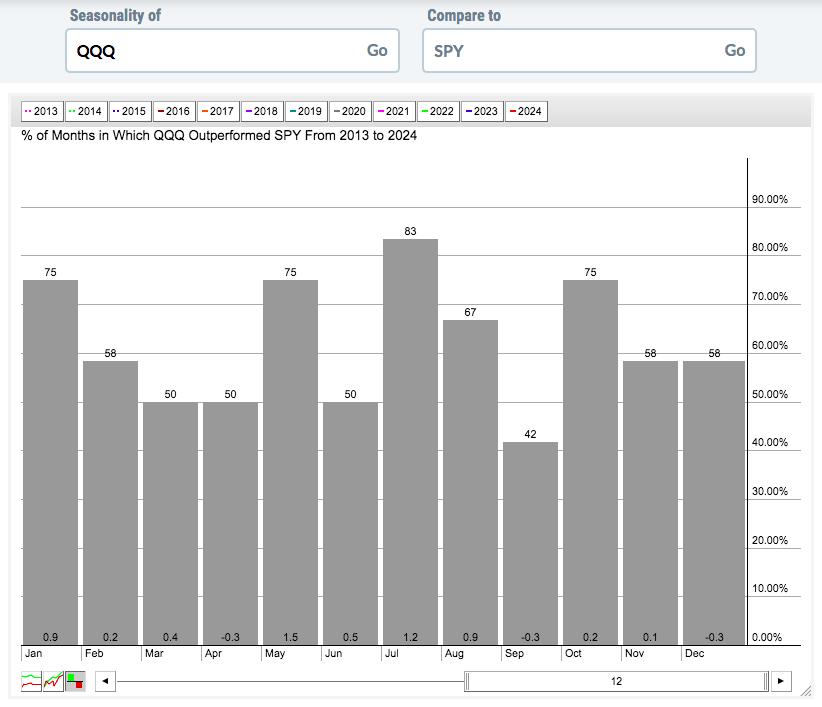 Let me break down the performance as follows:
- Month 1 of calendar quarters (Jan, Apr, July, Oct): +2.0%
- Month 2 of calendar quarters (Feb, May, Aug, Nov): +2.7%
- Month 3 of calendar quarters (Mar, Jun, Sep, Dec): +0.3%
As you can see, the final month of calendar quarters is much more difficult for the more aggressive QQQ. So, it stands to reason that once we move into the new year, the historical prospects of QQQ outperformance should provide seasonal tailwinds.
Rotation/Intermarket Analysis
Here's the latest look at our key intraday ratios as we follow where the money is traveling on an INTRADAY basis (ignoring gaps):
QQQ:SPY
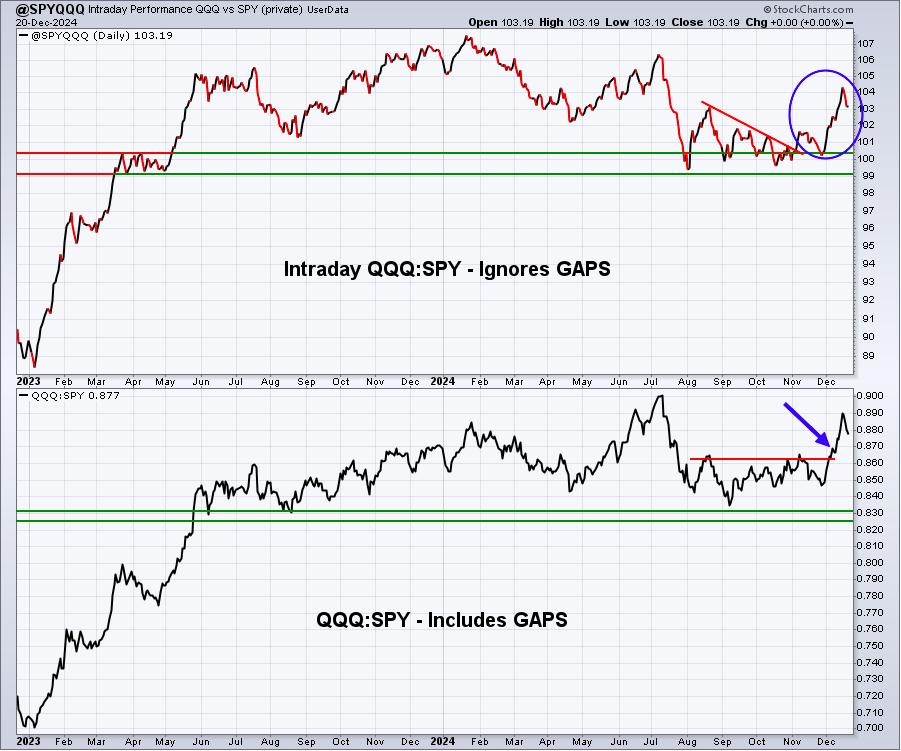
The Mag 7 stocks, much more heavily weighted in the QQQ than in the SPY, played a HUGE role in the sudden surge in this QQQ:SPY ratio from mid-October to mid-December. Last week's selling, however, did hit the Mag 7 a bit harder, likely due to monthly options expiration and max pain.
IWM:QQQ
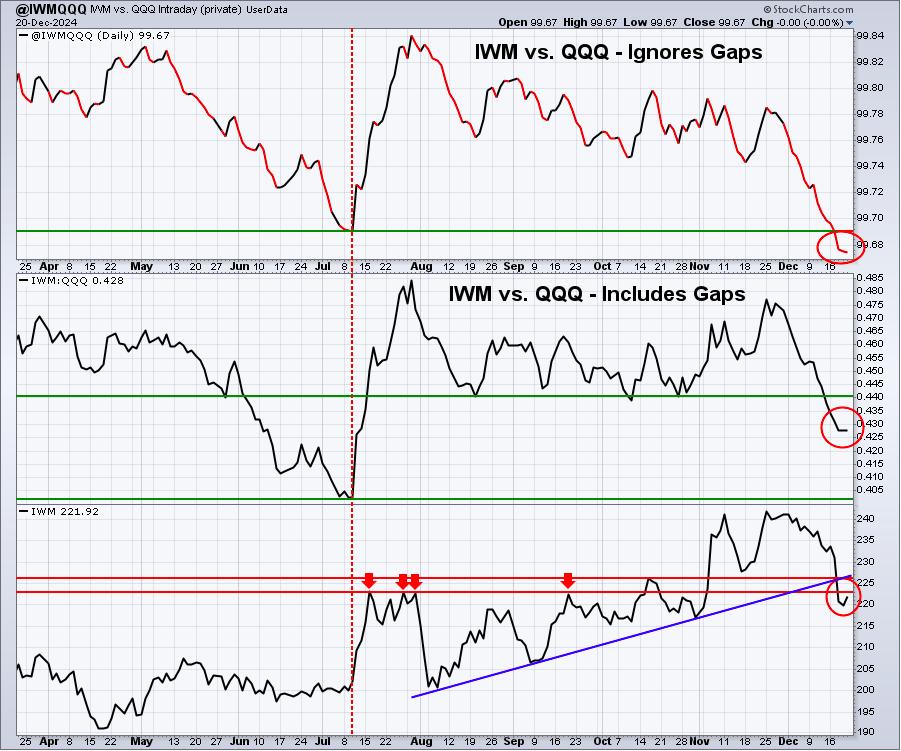
I'm baffled by this one. Fundamentals certainly point to potential relative strength in the small cap IWM, but right now we're seeing the opposite. I don't like to argue with the charts, however, so we need to be a bit more cautious on small caps until relative strength picks back up again.
XLY:XLP
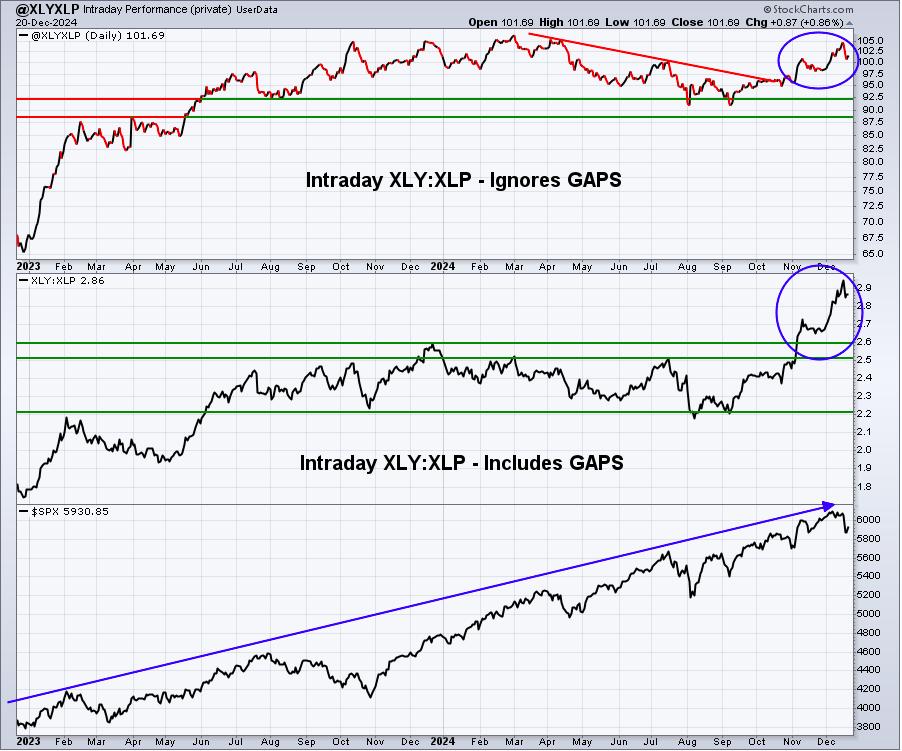
This is my favorite intermarket relationship ratio and it points to a rising S&P 500 in 2025. Just before the last cyclical bear market in early 2022, this ratio flashed a major warning signal as it was dropping rapidly in December 2021 - at the same time that the S&P 500 was rising to its all-time high. Something had to give and it was the S&P 500 that entered into a nasty cyclical bear market over the ensuing 9-10 months.
Sentiment
5-day SMA ($CPCE)
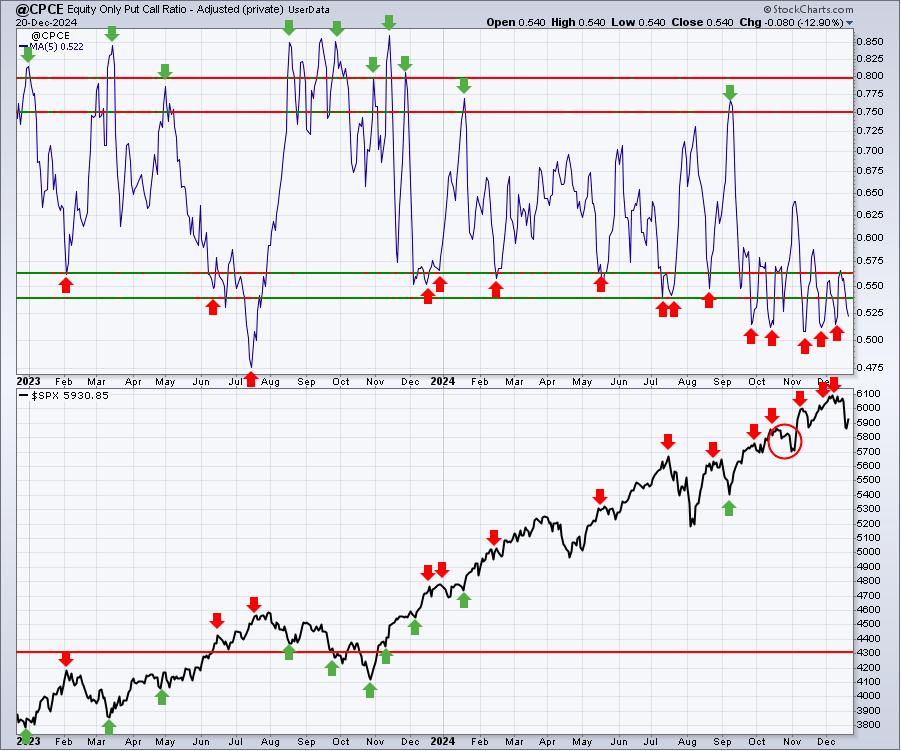
Sentiment indicators are contrarian indicators. When they show extreme bullishness, we need to be a bit cautious and when they show extreme pessimism, it could be time to become much more aggressive. Major market bottoms are carved out when pessimism is at its absolute highest level.
Readings on the 5-day SMA of the CPCE below .56 or so tell us that options traders are growing quite bullish and complacent and these are marked with red arrows in the top panel. Red arrows in the bottom panel tell us where the S&P 500 was at the time of such complacency. While we don't look at this short-term sentiment indicator and expect it to mark major long-term market tops, you can see many short-term tops do coincide with these bullish readings. We had another short-term topping signal recently, which was at least partly responsible for last week's decline.
253-day SMA ($CPCE)
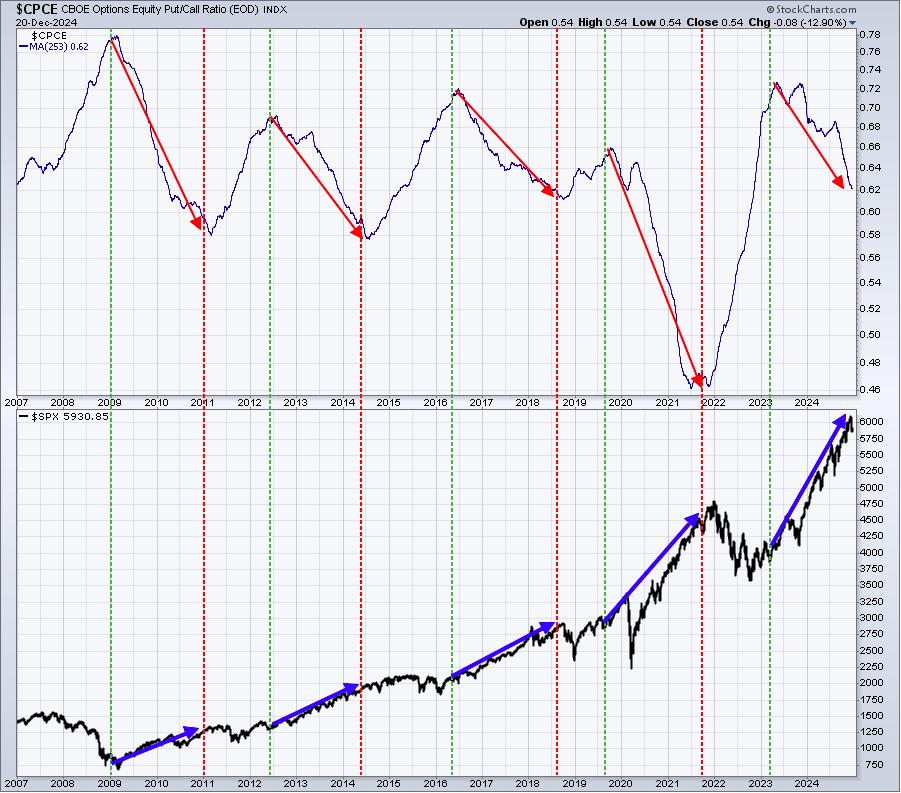
This is the long-term sentiment signal from the CPCE. It's telling me that the current free fall in bearish sentiment is pointing to higher U.S. equity prices, just as it's done in prior years.
Long-Term Trade Setup
Since beginning this Weekly Market Report in September 2023, I've discussed the long-term trade candidates below that I really like. Generally, these stocks have excellent long-term track records and many pay nice dividends that mostly grow every year. Only in very specific cases (exceptions) would I consider a long-term entry into a stock that has a poor or limited long-term track record and/or pays no dividends. Below is a quick recap of how I viewed their long-term technical conditions a couple weeks ago:
- JPM - pulling back from slightly overbought condition; also, weekly negative divergence could play a role
- BA - rallying of late, but failed at 160 price resistance and 20-week EMA resistance; need to clear 160
- FFIV - has reached new all-time highs; overbought, but still climbing
- MA - strength continues here as well
- GS - certainly benefiting from strength in financials
- FDX - 310 is the clear resistance level now
- AAPL - has broken out to another all-time high
- CHRW - climbed to 110-115 level to test August 2022 high; pulling back and unwinding overbought conditions
- JBHT - bounced beautifully off 150 price support; transports are hot and helping many stocks like JBHT
- STX - remaining above the rising 50-week SMA
- HSY - to resume strength, needs to clear both price resistance at 180 and the declining 20-week EMA at 183
- DIS - rising, but now approaching critical overhead price resistance from 120-125
- MSCI - rising and getting closer to 2021 price resistance just above 650
- SBUX - uptrend is intact and 110 price resistance from July 2021 awaits
- KRE - been awesome since July 2023 and likely heading for key price resistance test at 72.50
- ED - held key price support at 95 and is now trending back towards resistance near 107 - that's the range
- AJG - steady strength continues
- NSC - transports aiding here and NSC faces a huge price resistance test at 280 from late-2021 high
- RHI - now trending higher, keep an eye on rising 20-week EMA, currently at 69
- ADM - continues its rebound off 50
- BG - still remains beneath its declining 20-week EMA; 75-80 is BG's key price support range
- CVS - in a significant downtrend, but 44-45 is an extremely important price support level
- IPG - moving through 32 would be bullish; until then, watch 26-32 range
- HRL - 28-29 is key support, while a move through 36 resistance is ultimately what shareholders want to see
Keep in mind that our Weekly Market Reports favor those who are more interested in the long-term market picture. Therefore, the list of stocks above are stocks that we believe are safer (but nothing is ever 100% safe) to own with the long-term in mind. Nearly everything else we do at EarningsBeats.com favors short-term momentum trading, so I wanted to provide an explanation of what we're doing with this list and why it's different.
Also, please keep in mind that I'm not a Registered Investment Advisor (and neither is EarningsBeats.com nor any of its employees) and am only providing (mostly) what I believe to be solid dividend-paying stocks for the long-term. Companies periodically go through adjustments, new competition, restructuring, management changes, etc. that can have detrimental long-term impacts. The stock price nor the dividend is ever guaranteed. I simply point out interesting stock candidates for longer-term investors. Do your own due diligence and please consult with your financial advisor before making any purchases or sales of securities.
Looking Ahead
Upcoming Earnings
Earnings reports will slow to a crawl through the first week of January. The following list of companies is NOT a list of all companies scheduled to report quarterly earnings, however, just key reports, so please be sure to check for earnings dates of any companies that you own. Any company in BOLD represents a stock in one of our portfolios and the amount in parenthesis represents the market capitalization of each company listed:
- Monday: None
- Tuesday: None
- Wednesday: None
- Thursday: None
- Friday: None
Key Economic Reports
- Monday: November durable goods, December consumer confidence, November new home sales
- Tuesday: None
- Wednesday: None
- Thursday: Initial jobless claims
- Friday: None
Historical Data
I'm a true stock market historian. I am absolutely PASSIONATE about studying stock market history to provide us more clues about likely stock market direction and potential sectors/industries/stocks to trade. While I don't use history as a primary indicator, I'm always very aware of it as a secondary indicator. I love it when history lines up with my technical signals, providing me much more confidence to make particular trades.
Below you'll find the next two weeks of historical data and tendencies across the 3 key indices that I follow most closely:
S&P 500 (since 1950)
- Dec 23: +16.67%
- Dec 24: +27.39%
- Dec 25: Market closed
- Dec 26: +126.45%
- Dec 27: +40.63%
- Dec 28: -9.70%
- Dec 29: +42.91%
- Dec 30: +29.78%
- Dec 31: +38.51%
- Jan 1: Market closed
- Jan 2: +71.89%
- Jan 3: +42.72%
- Jan 4: +21.92%
- Jan 5: +24.47%
NASDAQ (since 1971)
- Dec 23: +70.14%
- Dec 24: +8.14%
- Dec 25: Market closed
- Dec 26: +147.19%
- Dec 27: +26.56%
- Dec 28: -17.64%
- Dec 29: +54.26%
- Dec 30: +44.52%
- Dec 31: +91.21%
- Jan 1: Market closed
- Jan 2: +63.20%
- Jan 3: +121.11%
- Jan 4: -17.83%
- Jan 5: +11.23%
Russell 2000 (since 1987)
- Dec 23: +110.02%
- Dec 24: +16.82%
- Dec 25: Market closed
- Dec 26: +179.69%
- Dec 27: +22.28%
- Dec 28: -6.43%
- Dec 29: +48.50%
- Dec 30: +78.81%
- Dec 31: +94.04%
- Jan 1: Market closed
- Jan 2: -10.58%
- Jan 3: +22.78%
- Jan 4: -30.37%
- Jan 5: -46.58%
The S&P 500 data dates back to 1950, while the NASDAQ and Russell 2000 information date back to 1971 and 1987, respectively.
Final Thoughts
Last week was not good for the stock market and there were likely a few reasons why, namely (1) the Fed cutting the anticipated number of rate cuts in 2025 from 4 to 2, (2) historical trends favoring a slide at the end of last week, and (3) monthly options expiring and max pain suggesting that our major indices would be under pressure through Friday. That's behind us now, so I'll be watching the following:
- Interest Rates. The 10-year treasury yield ($TNX) has not-so-quietly surged near 4.60% again. While longer-term rates have been rising, areas like the Dow Jones, transportation stocks, and small/mid caps have been falling. A reversal in the TNX would likely be the first step in repairing areas currently suffering from the higher yield.
- Volatility ($VIX). The VIX surged 74% last Wednesday, but quickly retreated back in the 17-20 zone. Today, the VIX was down near 17.50. Our next clue about market direction and whether this recent selling has legs, will be whether the VIX holds 16-17 support and rises again (bearish) or if the recent VIX drop continues until we're heading back down towards the lower teens (bullish). If that's the case, stocks will very likely be heading back to all-time highs.
- Earnings and Economic Reports. Both will be extremely light through year end and provide very little data for traders to decipher and trade off of. After last week's Fed meeting, I believe little or no news is likely to be a relief and help the bulls potentially re-establish their uptrends.
- Volume. Expect volume to be very light over the next 10 days or so, until we start a new year. At that point, January performance will be extremely important, because it has a very significant impact historically on stock market performance over the balance of the year. You may have heard that old Wall Street adage, "As January goes, so goes the rest of the year".
Feedback
Enjoy the holidays everyone! From our families to yours, we wish you all peace and happiness (and hopefully winning trades) in the year ahead!
If you'd like to share your thoughts on our Weekly Market Report, positive or negative, you can reach us at "[email protected]".
Happy trading!
Tom