
EB Weekly Market Report - Monday, January 6, 2025
ChartLists Updated
The following ChartLists were updated over the weekend and are available for viewing/downloading on our website:
- Short Squeeze (SSCL)
- Seasonality - January (SEASCL)
There'll be a few earnings reports out this week, so I'll be looking to see if we need to update many of our ChartLists at the end of this week.
Weekly Market Recap
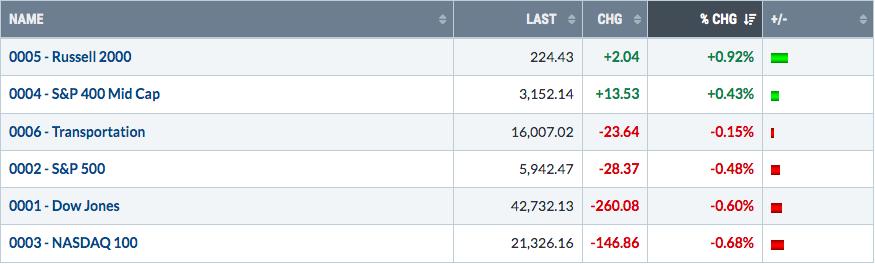
Major Indices
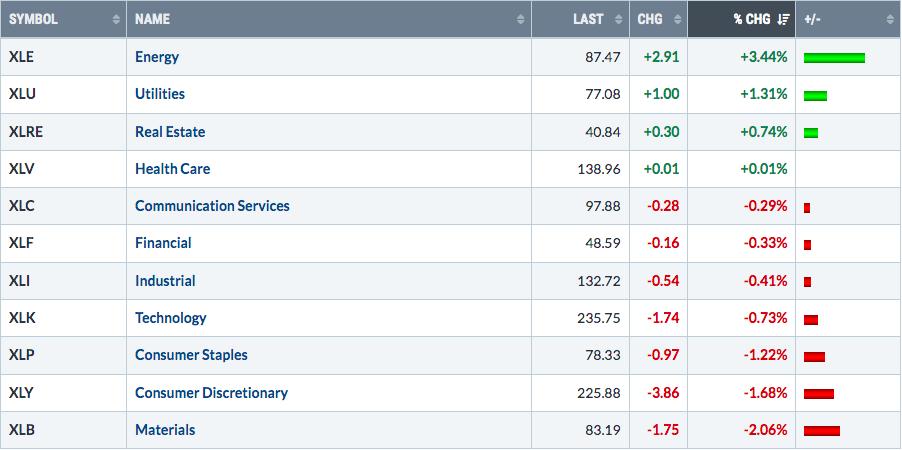
Sectors
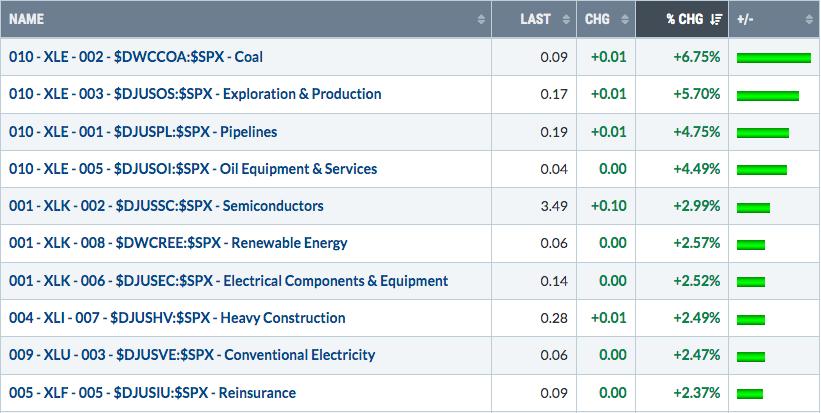
Top 10 Industries Last Week
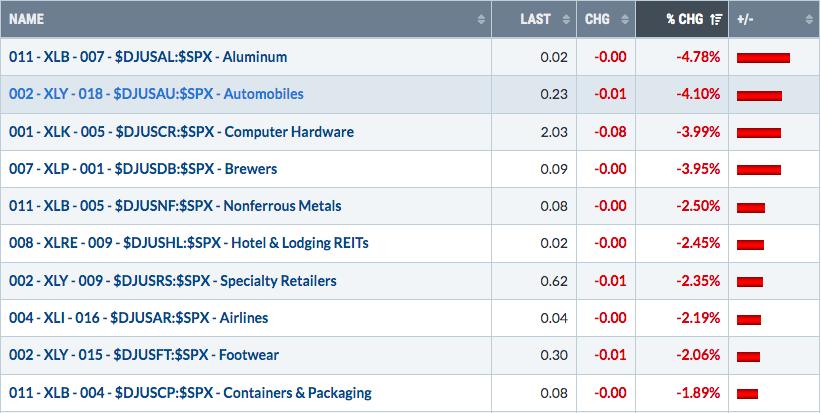
Bottom 10 Industries Last Week
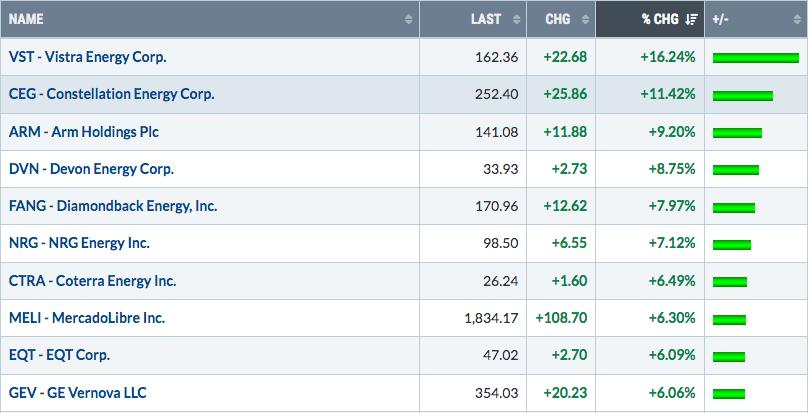
Top 10 Stocks - S&P 500/NASDAQ 100
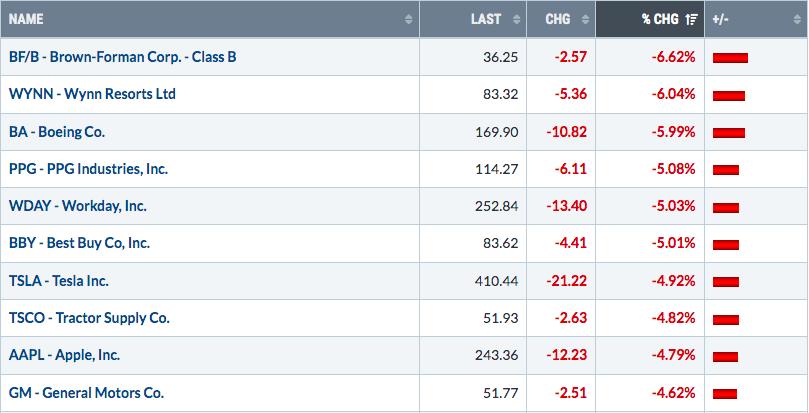
Bottom 10 Stocks - S&P 500/NASDAQ 100
Big Picture
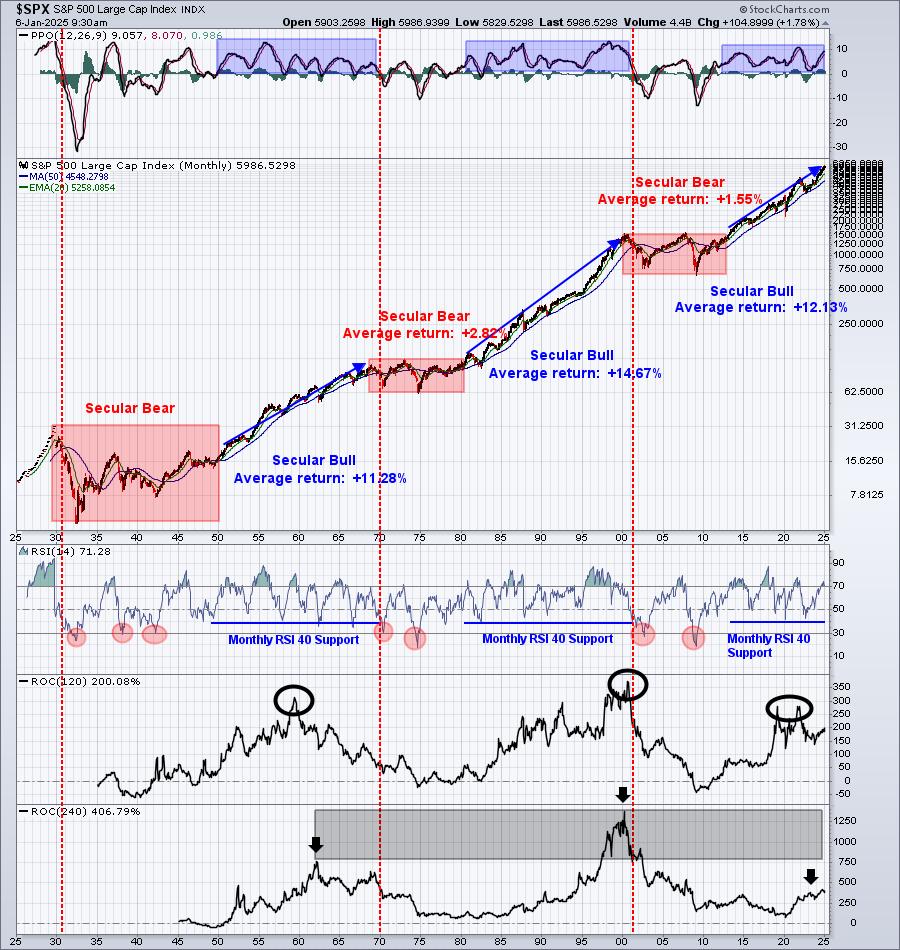
Well, we had our MarketVision 2025 event on Saturday and I offered up my S&P 500 target for 2025. I believe we'll end this year at 7000, after potentially experiencing quite a bit of volatility, likely to be associated with inflation, interest rates, and the Fed.
Through it all, however, stay focused on this Big Picture chart. It's the one chart that I can look at and remain quite confident that being long throughout 2025 - from a long-term perspective - makes a ton of sense and will end up being the right position and choice.
Sustainability Ratios
It's been two weeks since our last EB Weekly Market Report and since our last look at our sustainability ratios. I mentioned then that as January began, we would more than likely see a bit more rotation towards the QQQ vs. the SPY as the first and second months of calendar quarters have proven over time to be better months for QQQ relative outperformance. So let's check it out and see:
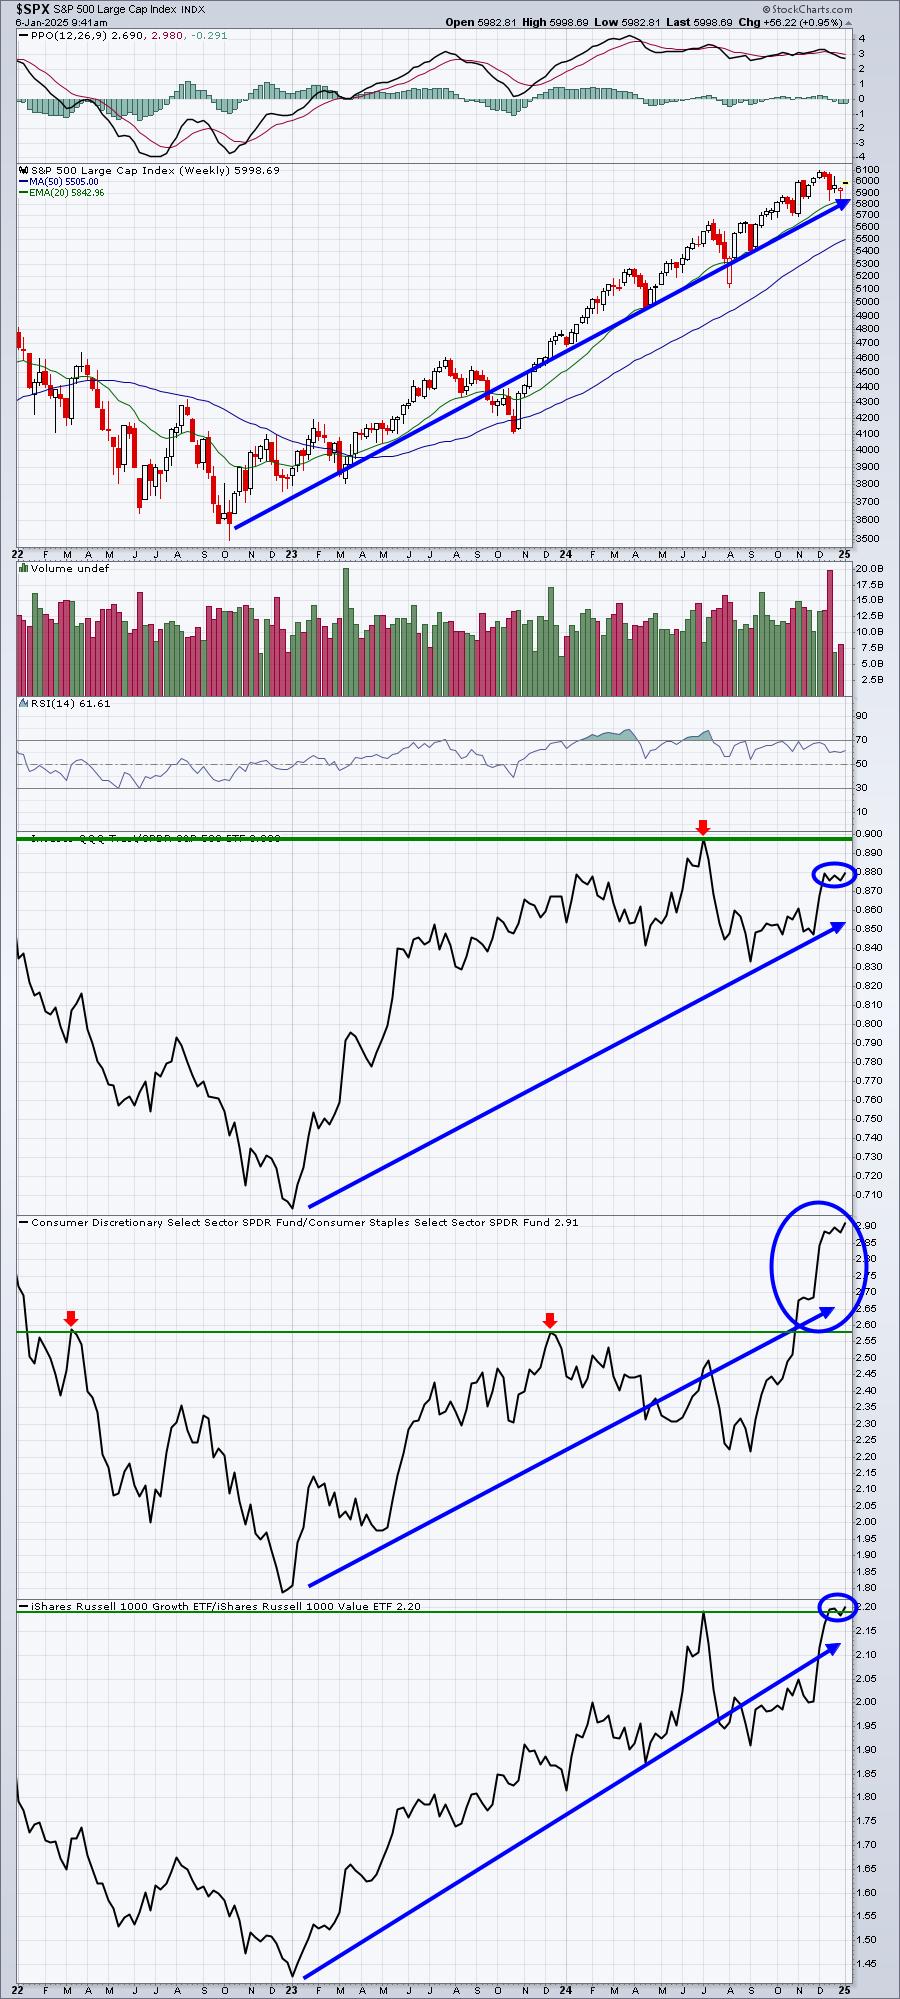
I do see improvement over the past two weeks, which is a bullish sign, but I'll still be watching to see if we can get another QQQ:SPY breakout above the relative high set at the beginning of July 2024.
The following, in italics, was provided two weeks ago, but I'm reprinting it so that anyone who missed this discussion two weeks ago, particularly new members joining from MV 2025, will see it.
These 3 ratios have strong positive correlation with the S&P 500, meaning that when one goes up or down, the other tends to follow along in the same direction. Currently, the S&P 500 is clearly trending higher, while the 3 sustainability ratios are also in uptrends. The only worrisome piece of evidence here is that we haven't yet see a breakout in the QQQ vs. the SPY. Historically, we tend to see that relative outperformance in months other than the final calendar month of each calendar quarter (Mar, Jun, Sep, Dec). Check out this seasonality chart for the past 12 years (since the secular bull market was confirmed in 2013):
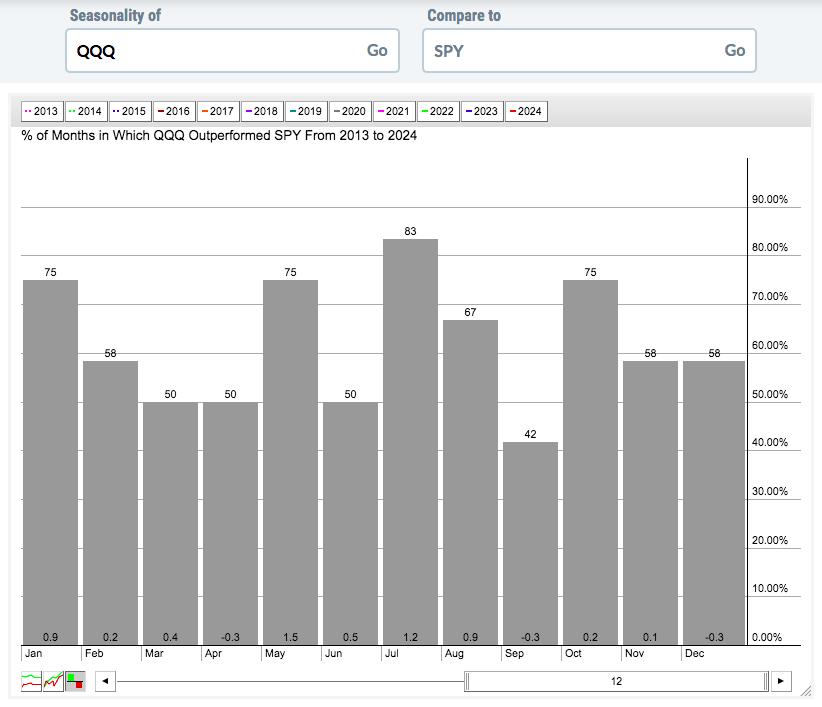
Let me break down the performance as follows:
- Month 1 of calendar quarters (Jan, Apr, July, Oct): +2.0%
- Month 2 of calendar quarters (Feb, May, Aug, Nov): +2.7%
- Month 3 of calendar quarters (Mar, Jun, Sep, Dec): +0.3%
As you can see, the final month of calendar quarters is much more difficult for the more aggressive QQQ. So, it stands to reason that once we move into the new year, the historical prospects of QQQ outperformance should provide seasonal tailwinds.
Rotation/Intermarket Analysis and Sentiment
These are two areas that we focus on nearly every week throughout the year. Next week, we'll begin taking a fresh look at these areas. From a short-term perspective, sentiment is currently fine and isn't really providing us any sort of signal. However, as 2025 moves on, we could run into some long-term sentiment issues. But we'll address those as they appear throughout the year.
Rotation mostly looks like it would support a further advance in the S&P 500. I definitely would like to see more strength in small caps, but otherwise our major indices look rather solid right now.
Long-Term Trade Setup
Since beginning this Weekly Market Report in September 2023, I've discussed the long-term trade candidates below that I really like. Generally, these stocks have excellent long-term track records and many pay nice dividends that mostly grow every year. Only in very specific cases (exceptions) would I consider a long-term entry into a stock that has a poor or limited long-term track record and/or pays no dividends. Below is a quick recap of how I view their long-term technical conditions as we move into 2025:
- JPM - trending higher
- BA - recently tested 50-week SMA from underneath, now needs to clear 183
- FFIV - remains in strong rally since June 2024
- MA - approaching 20-week EMA test within solid uptrend
- GS - trending above rising 20-week EMA
- FDX - consolidating; needs a break above 310
- AAPL - as solid as ever; 235-238 should be excellent support
- CHRW - currently testing rising 20-week EMA
- JBHT - remains in lengthy consolidation period
- STX - drop below 50-week SMA on heavier volume a concern, next key support level is 80
- HSY - downtrend in play, but monthly RSI of 37 suggests great entry price for long-term
- DIS - pulling back recently, but clear overhead resistance is at 122-123
- MSCI - just above strong support at rising 20-week EMA
- SBUX - nice recent reversal off 50-week SMA
- KRE - tested 20-week EMA during December, poised for current advance
- ED - rough Q4 leading it back to 80-85 price support range
- AJG - weekly negative divergence, loss of 20-week EMA likely to send down to test rising 50-week SMA
- NSC - railroads and transports weak, December low of 230 is current support
- RHI - has pulled back to test both 20-week EMA and 50-week SMA
- ADM - has fallen back to test key price support at 50; monthly RSI at 34 - patience will be key here
- BG - also testing key price support in the 75-80 range
- CVS - huge December drop has stock at a critical 44-45 support level
- IPG - 3-year consolidation has stock in middle of its 15-month 26-32 price range
- HRL - still living beneath its falling 20-week EMA, need to change this trend; monthly RSI at 41
Keep in mind that our Weekly Market Reports favor those who are more interested in the long-term market picture. Therefore, the list of stocks above are stocks that we believe are safer (but nothing is ever 100% safe) to own with the long-term in mind. Nearly everything else we do at EarningsBeats.com favors short-term momentum trading, so I wanted to provide an explanation of what we're doing with this list and why it's different.
Also, please keep in mind that I'm not a Registered Investment Advisor (and neither is EarningsBeats.com nor any of its employees) and am only providing (mostly) what I believe to be solid dividend-paying stocks for the long-term. Companies periodically go through adjustments, new competition, restructuring, management changes, etc. that can have detrimental long-term impacts. The stock price nor the dividend is ever guaranteed. I simply point out interesting stock candidates for longer-term investors. Do your own due diligence and please consult with your financial advisor before making any purchases or sales of securities.
Looking Ahead
Upcoming Earnings
It's hard to believe, but Q4 earnings will be coming out soon as we'll kick off with the large banks next Wednesday, January 15th. The following list of companies is NOT a list of all companies scheduled to report quarterly earnings, however, just key reports, so please be sure to check for earnings dates of any companies that you own. Any company in BOLD represents a stock in one of our portfolios and the amount in parenthesis represents the market capitalization of each company listed:
- Monday: None
- Tuesday: None
- Wednesday: None
- Thursday: None
- Friday: STZ ($40 billion), DAL ($38 billion)
Key Economic Reports
- Monday: November factory orders
- Tuesday: December ISM services, November JOLTS
- Wednesday: December ADP employment report, initial jobless claims, November wholesale inventories, FOMC minutes
- Thursday: None
- Friday: December nonfarm payrolls
Historical Data
I'm a true stock market historian. I am absolutely PASSIONATE about studying stock market history to provide us more clues about likely stock market direction and potential sectors/industries/stocks to trade. While I don't use history as a primary indicator, I'm always very aware of it as a secondary indicator. I love it when history lines up with my technical signals, providing me much more confidence to make particular trades.
Below you'll find the next two weeks of historical data and tendencies across the 3 key indices that I follow most closely:
S&P 500 (since 1950)
- Jan 6: +32.74%
- Jan 7: -18.45%
- Jan 8: -45.04%
- Jan 9: -27.37%
- Jan 10: +37.88%
- Jan 11: +19.74%
- Jan 12: -21.45%
- Jan 13: -21.57%
- Jan 14: +60.98%
- Jan 15: +25.13%
- Jan 16: +24.33%
- Jan 17: +15.48%
- Jan 18: +10.39%
- Jan 19: -7.22%
NASDAQ (since 1971)
- Jan 6: +99.69%
- Jan 7: +34.78%
- Jan 8: +31.09%
- Jan 9: +4.57%
- Jan 10: +118.26%
- Jan 11: +37.76%
- Jan 12: -25.57%
- Jan 13: +3.40%
- Jan 14: +88.77%
- Jan 15: +17.69%
- Jan 16: +69.24%
- Jan 17: +43.48%
- Jan 18: +35.23%
- Jan 19: +46.70%
Russell 2000 (since 1987)
- Jan 6: +102.96%
- Jan 7: -13.19%
- Jan 8: -5.25%
- Jan 9: -52.38%
- Jan 10: +104.36%
- Jan 11: +9.96%
- Jan 12: -40.26%
- Jan 13: +18.56%
- Jan 14: +60.16%
- Jan 15: -30.84%
- Jan 16: +70.35%
- Jan 17: +12.29%
- Jan 18: -14.79%
- Jan 19: +10.17%
The S&P 500 data dates back to 1950, while the NASDAQ and Russell 2000 information date back to 1971 and 1987, respectively.
Final Thoughts
The holiday season was very strange and atypical for U.S. equities. We tend to see leadership from more defensive-minded stocks and dividend payers. That really never materialized as growth stocks uncharacteristically led the action throughout most of the month. :
- January Effect. January performance has very strong ties to performance over the balance of the year, so I'll be watching January action very closely, as I always do.
- Economic Data. The Fed has said they'll be watching economic data as it's released, so it makes sense that we should too. I would think that economic reports that are "ok" or slightly below expectations would be handled by the market better than "hot" economic data. Weak data would help two-fold, first by helping to keep core inflation data low and, second, to suggest that the Fed remain on the course of lowering the fed funds rate in 2025 and into 2026.
- Earnings. We will soon be hearing not only the latest corporate quarterly earnings reports, but also updates on 2025 forecasts. Ultimately, earnings and interest rates drive equity prices. If rates go lower and earnings remain strong, I just don't see much downside risk in stocks in 2025.
- Semiconductors ($DJUSSC). This is a VERY important industry group and it typically has a massive influence on the direction of our major indices. They were setting up for a breakout heading into 2025 and the DJUSSC, while off its earlier intraday highs, is currently above key price resistance. Check this out:
$DJUSSC:
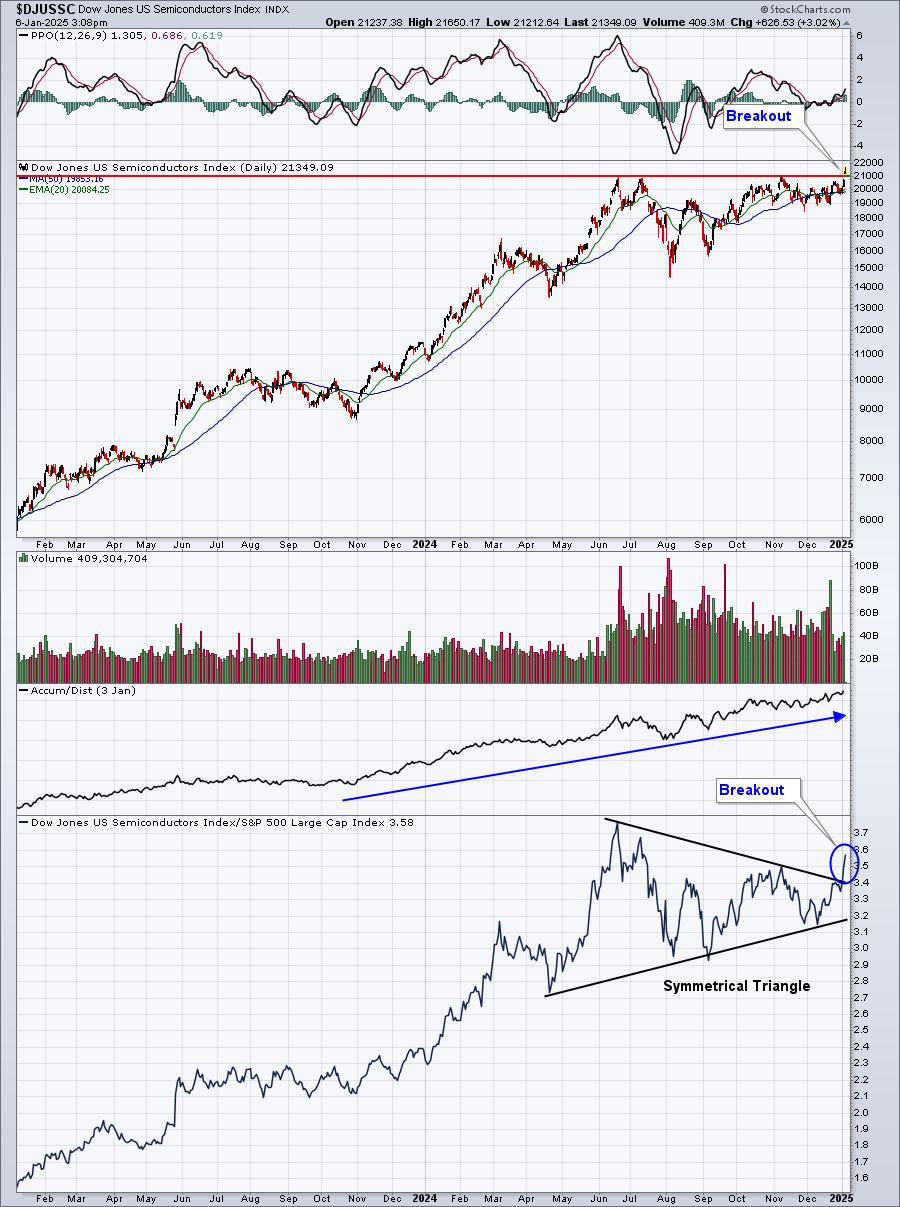
I warned about a major top on semiconductors back in June 2024. This group has had a lot of volatility the past 6-7 months, but now appears poised to potentially have a very strong Q1 2025 based on this breakout.
Feedback
Welcome back from the holidays! We hope yours were most enjoyable. At EarningsBeats.com, we're ready to get back into gear for an awesome 2025!
If you'd like to share your thoughts on our Weekly Market Report, positive or negative, you can reach us at "[email protected]".
Happy trading!
Tom