
EB Weekly Market Report - Tuesday, January 21, 2025
ChartLists Updated
The following ChartLists were updated over the weekend:
- Strong Earnings (SECL)
- Strong Future Earnings (SFECL)
- Raised Guidance (RGCL)
- Strong AD (SADCL)
- Bullish Trifecta (BTCL)
- Short Squeeze (SSCL)
- Strong ETF (SETFCL)
- Model ETF Portfolio (MODETFCL)
The Upcoming Earnings ChartLists for this week and the Upcoming Earnings - Relative Strength ChartList were also updated on our website or will be this morning.
Weekly Market Recap
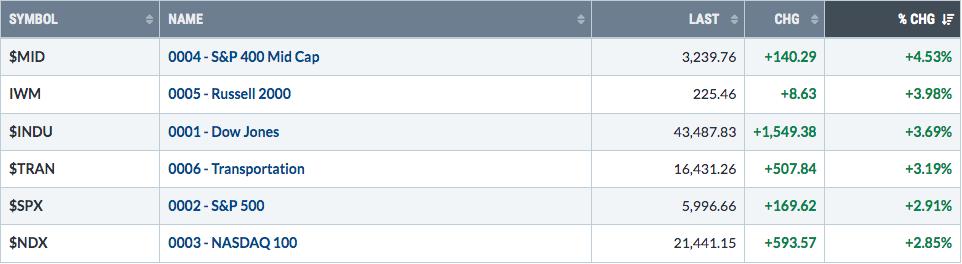
Major Indices
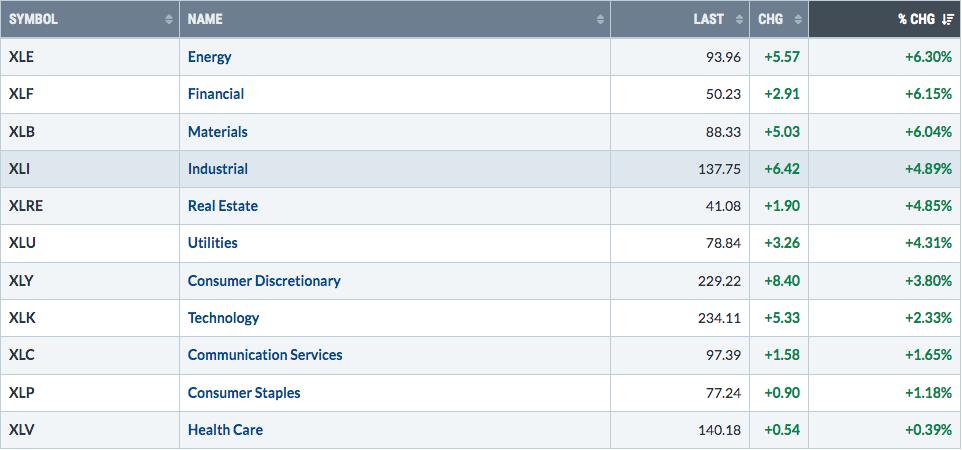
Sectors
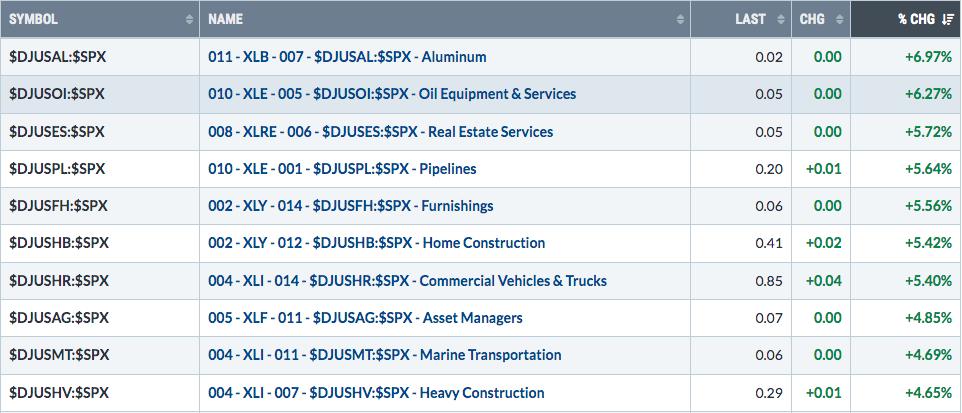
Top 10 Industries Last Week
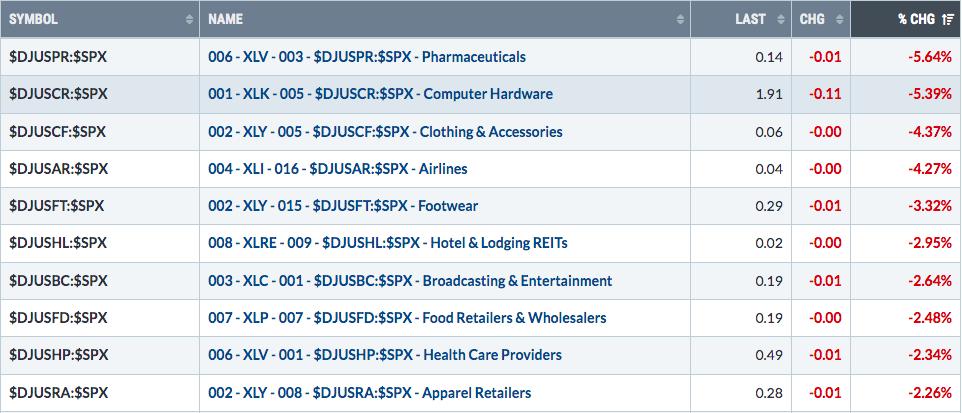
Bottom 10 Industries Last Week
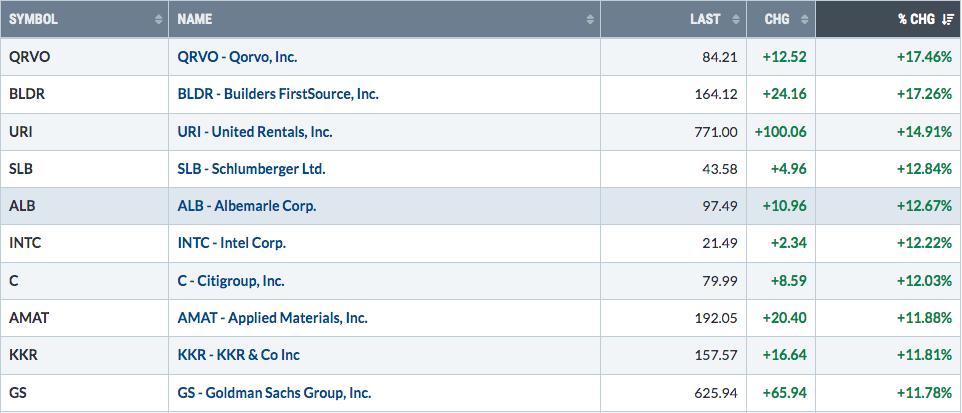
Top 10 Stocks - S&P 500/NASDAQ 100
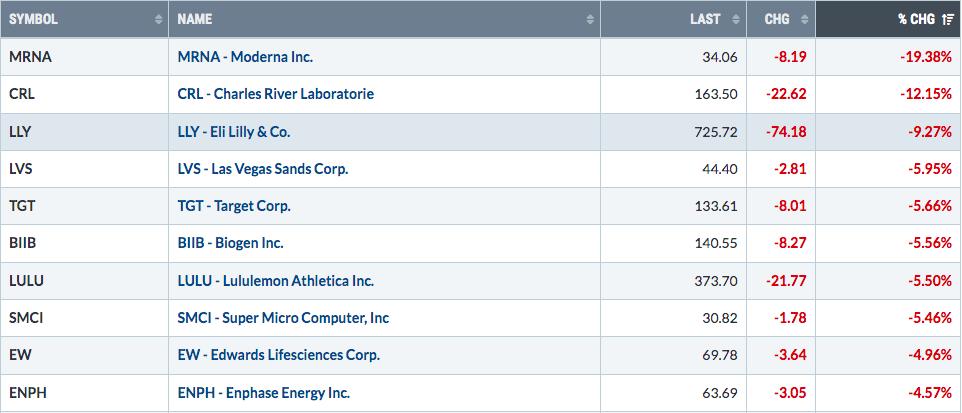
Bottom 10 Stocks - S&P 500/NASDAQ 100
Big Picture
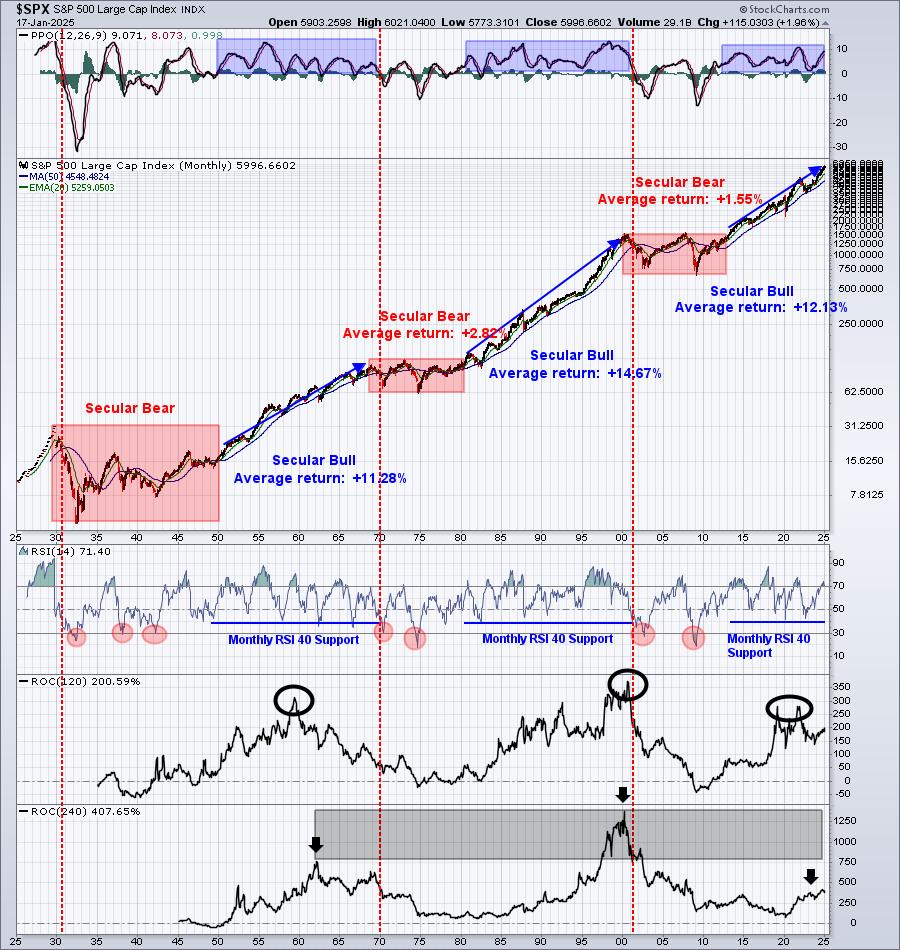
We closed out last week near 6000, just 1.5% away from all-time high territory on the S&P 500. I'm continuing to watch the 240-month rate of change (ROC) climb in the bottom panel. There's still a long, long way to go as I wouldn't be at all surprised to eventually see this ROC touch 750 or higher.
Sustainability Ratios
Here's the latest look at our key intraday ratios as we follow where the money is traveling on an INTRADAY basis (ignoring gaps):
QQQ:SPY
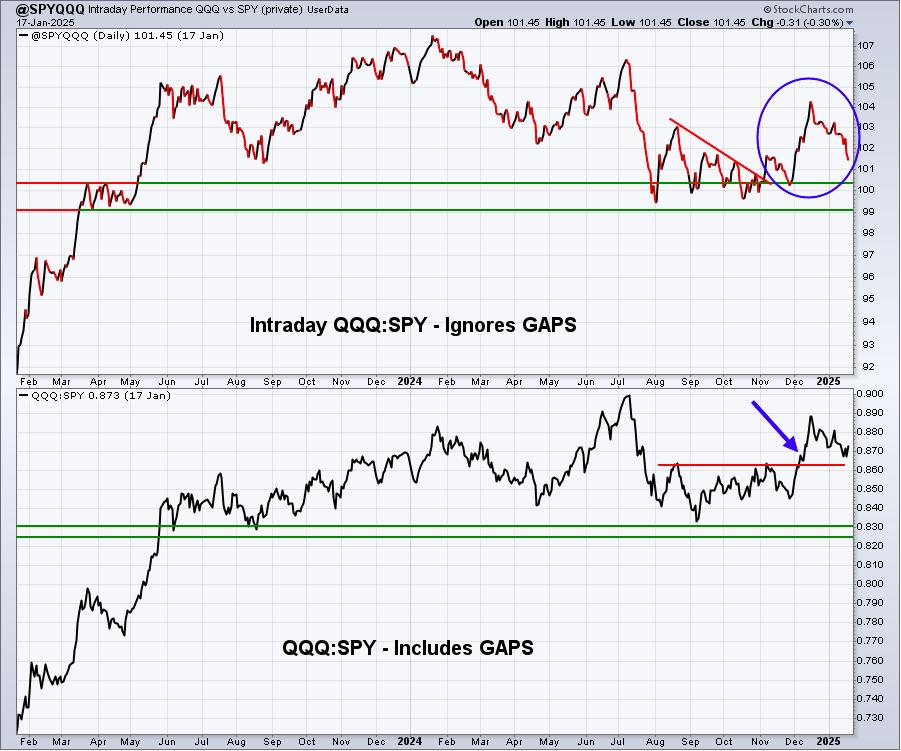
Personally, I'd like to see the relative price support at roughly at 0.862 hold. Failing to hold wouldn't necessarily suggest bad things are on the way, but it would simply provide a bit less confidence in my bullish market stance.
IWM:QQQ
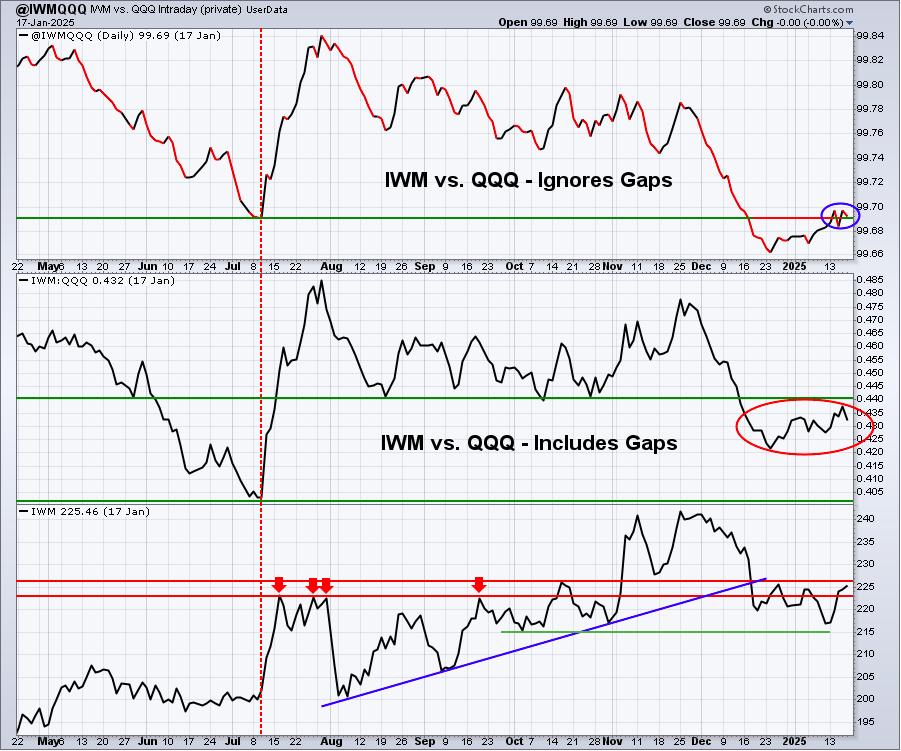
In the bottom panel, the IWM has begun behaving much more bullishly over the past few days to a week. One reason for that, in my opinion, is the swift reduction in the 10-year treasury yield ($TNX) after tame inflation data was reported last week. I do not believe in the inflation surge theory for 2025, which is why I believe the fundamental story of lower fed funds rates supports small caps this year.
XLY:XLP
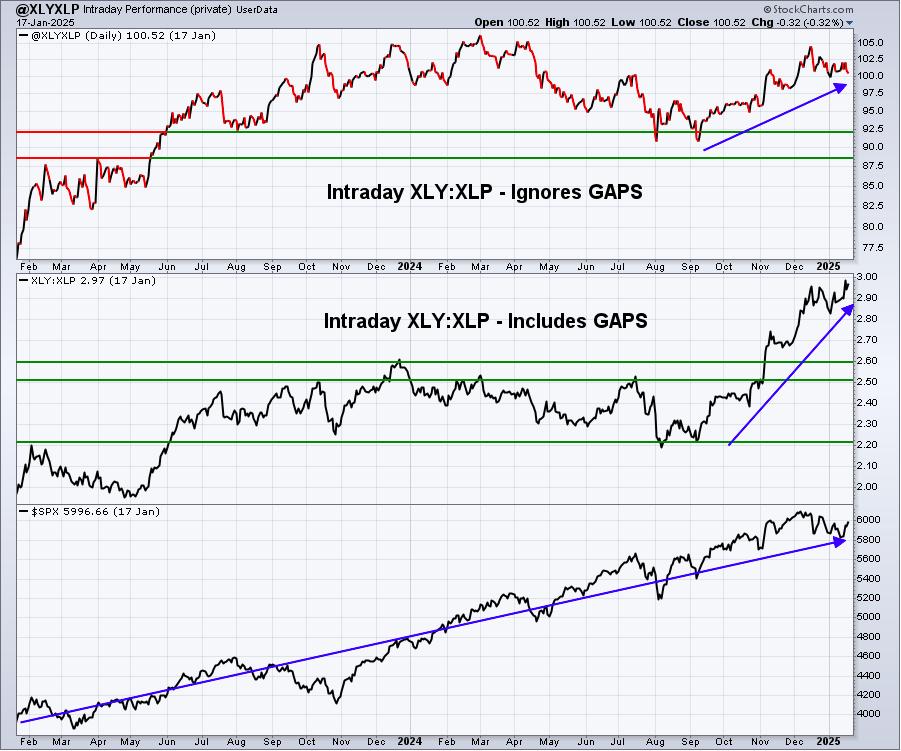
The strength in this ratio is very bullish. I think the relationship of consumer discretionary (XLY) to consumer staples (XLP) is incredibly relevant and is one of the best signals of market trend sustainability. It's hard to argue with what it's saying right now, which is that the stock market is likely heading higher.
Sentiment
5-day SMA ($CPCE)
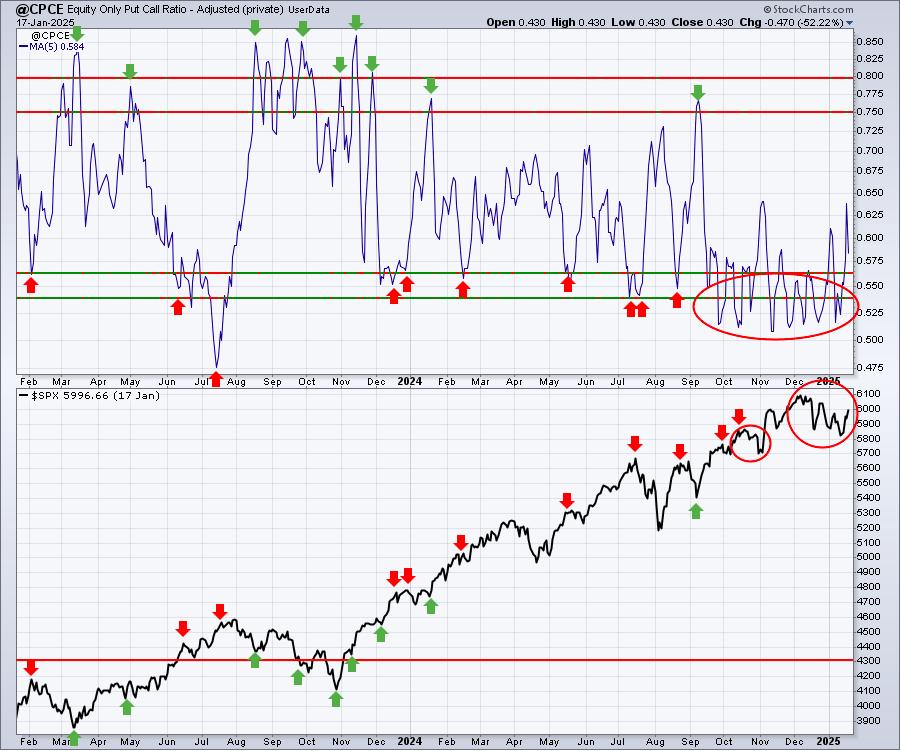
Sentiment indicators are contrarian indicators. When they show extreme bullishness, we need to be a bit cautious and when they show extreme pessimism, it could be time to become much more aggressive. Major market bottoms are carved out when pessimism is at its absolute highest level.
Readings on the 5-day SMA of the CPCE below .56 or so tell us that options traders are growing quite positive and complacent and these are marked with red arrows in the top panel. Red arrows in the bottom panel tell us where the S&P 500 was at the time of such complacency. While we don't look at this short-term sentiment indicator and expect it to mark major long-term market tops, you can see many short-term tops do coincide with these bullish readings. Recent complacency readings below .56 have warned us that the short-term could be dicey and that's exactly what it's been. This 5-day reading did reach .64 recently, though, so that could be having a bullish effect on our major indices right now.
253-day SMA ($CPCE)
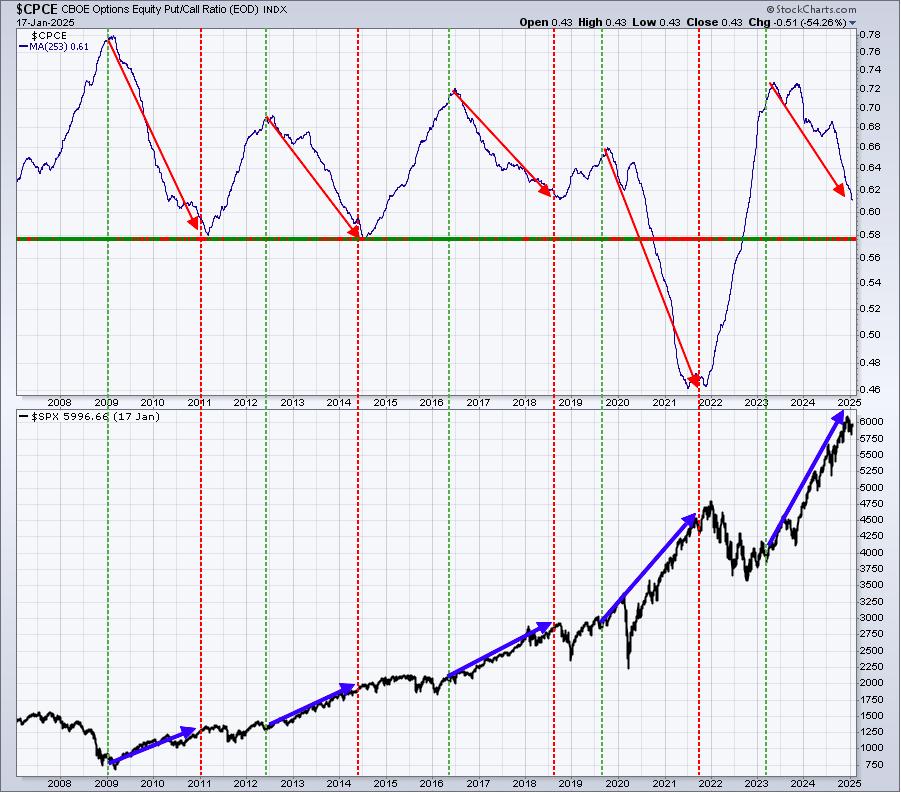
This signal is unmistakeable. The 1-year moving average of the $CPCE is falling precipitously and that has historically had a VERY strong inverse correlation with the direction of the S&P 500 since the 2007-2009 bear market low. Until we approach extreme lows, this falling 1-year reading sets the stock market up beautifully for a further advance.
Key Sectors/Industries
Let's take a quick glance at the most important sector this week to help determine what the S&P 500 needs in order to make another breakout to an all-time high. After all, technology (XLK) represents approximately 32.5% of the S&P 500:
Technology (XLK):
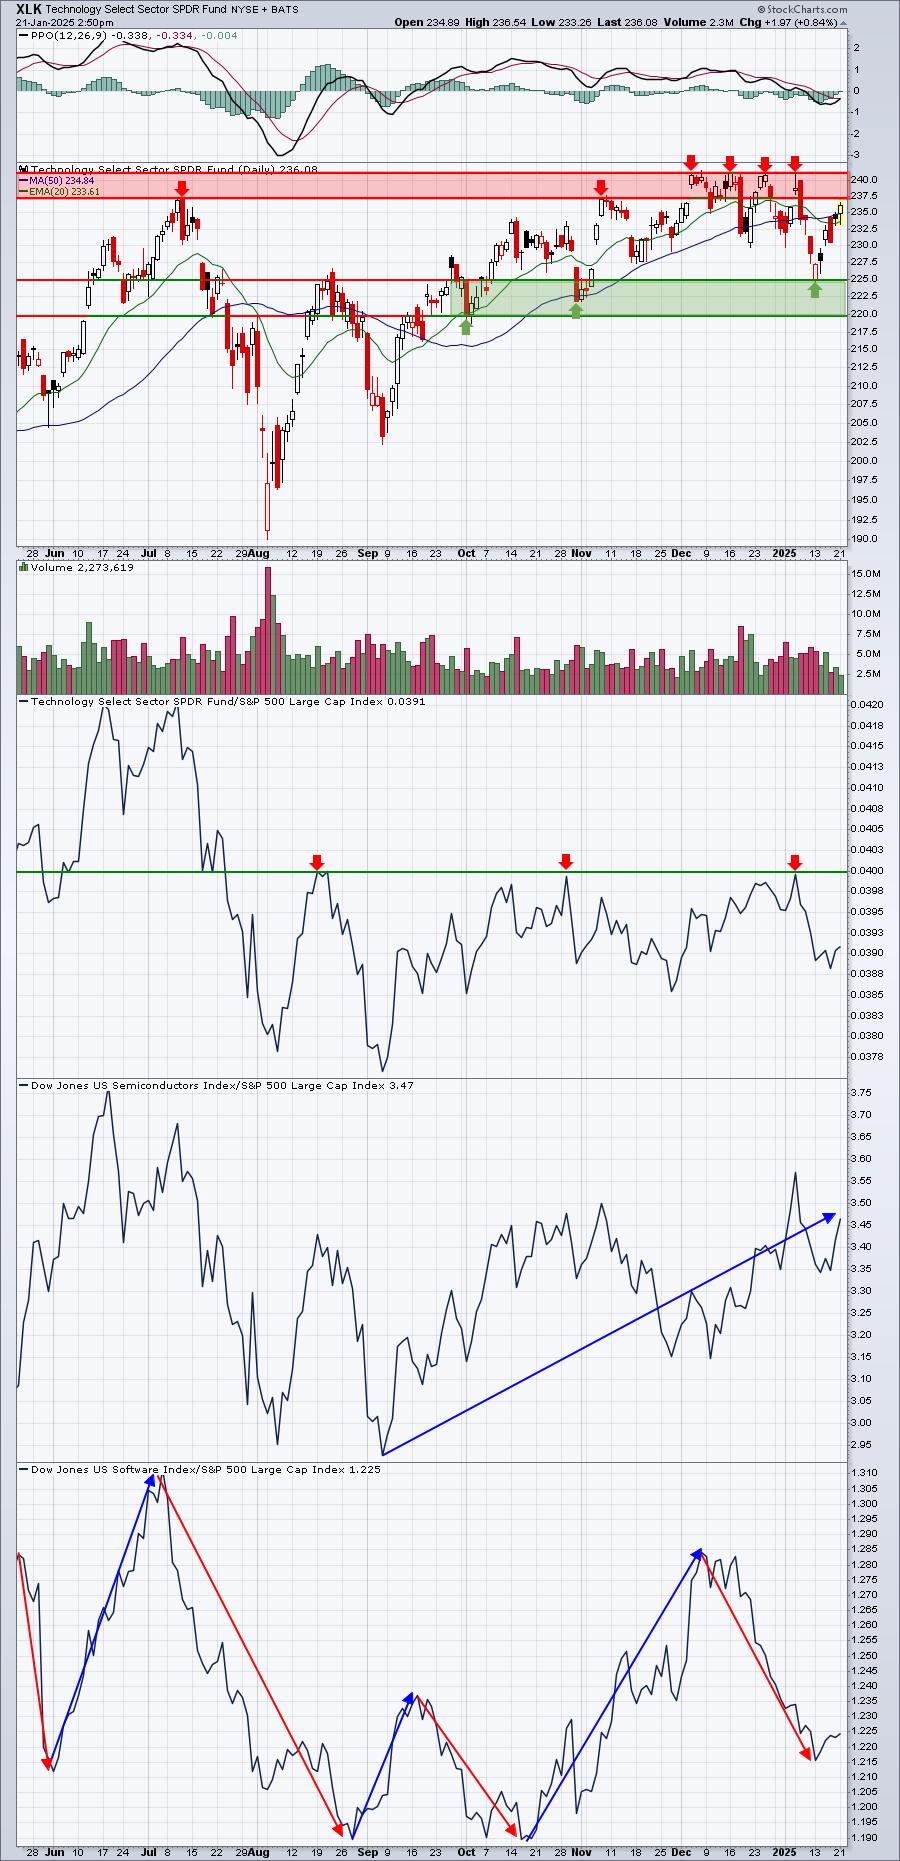
The red arrows highlight key absolute and relative price resistance that the XLK needs to get back above. In the bottom two panels, I highlight two key industry groups within technology - semiconductors ($DJUSSC) and software ($DJUSSW). Semis appear to be regaining strength, but software has been totally unreliable and inconsistent. It'll likely take both of these industry groups showing significant absolute and relative strength to help the XLK forge to new highs. If the XLK can't do it, then that means 32.5% of the S&P 500 will be holding that benchmark index down.
Long-Term Trade Setup
Since beginning this Weekly Market Report in September 2023, I've discussed the long-term trade candidates below that I really like. Generally, these stocks have excellent long-term track records and many pay nice dividends that mostly grow every year. Only in very specific cases (exceptions) would I consider a long-term entry into a stock that has a poor or limited long-term track record and/or pays no dividends. Below is a quick recap of how I viewed their long-term technical conditions two weeks ago:
- JPM - trending higher
- BA - recently tested 50-week SMA from underneath, now needs to clear 183
- FFIV - remains in strong rally since June 2024
- MA - approaching 20-week EMA test within solid uptrend
- GS - trending above rising 20-week EMA
- FDX - consolidating; needs a break above 310
- AAPL - as solid as ever; 235-238 should be excellent support
- CHRW - currently testing rising 20-week EMA
- JBHT - remains in lengthy consolidation period
- STX - drop below 50-week SMA on heavier volume a concern, next key support level is 80
- HSY - downtrend in play, but monthly RSI of 37 suggests great entry price for long-term
- DIS - pulling back recently, but clear overhead resistance is at 122-123
- MSCI - just above strong support at rising 20-week EMA
- SBUX - nice recent reversal off 50-week SMA
- KRE - tested 20-week EMA during December, poised for current advance
- ED - rough Q4 leading it back to 80-85 price support range
- AJG - weekly negative divergence, loss of 20-week EMA likely to send down to test rising 50-week SMA
- NSC - railroads and transports weak, December low of 230 is current support
- RHI - has pulled back to test both 20-week EMA and 50-week SMA
- ADM - has fallen back to test key price support at 50; monthly RSI at 34 - patience will be key here
- BG - also testing key price support in the 75-80 range
- CVS - huge December drop has stock at a critical 44-45 support level
- IPG - 3-year consolidation has stock in middle of its 15-month 26-32 price range
- HRL - still living beneath its falling 20-week EMA, need to change this trend; monthly RSI at 41
Keep in mind that our Weekly Market Reports favor those who are more interested in the long-term market picture. Therefore, the list of stocks above are stocks that we believe are safer (but nothing is ever 100% safe) to own with the long-term in mind. Nearly everything else we do at EarningsBeats.com favors short-term momentum trading, so I wanted to provide an explanation of what we're doing with this list and why it's different.
Also, please keep in mind that I'm not a Registered Investment Advisor (and neither is EarningsBeats.com nor any of its employees) and am only providing (mostly) what I believe to be solid dividend-paying stocks for the long-term. Companies periodically go through adjustments, new competition, restructuring, management changes, etc. that can have detrimental long-term impacts. The stock price nor the dividend is ever guaranteed. I simply point out interesting stock candidates for longer-term investors. Do your own due diligence and please consult with your financial advisor before making any purchases or sales of securities.
Looking Ahead
Upcoming Earnings
Q4 earnings are now underway and the banks will be welcoming in a number of other areas of the market this week. The following list of companies is NOT a list of all companies scheduled to report quarterly earnings, however, just key reports, so please be sure to check for earnings dates of any companies that you own. Any company in BOLD represents a stock in one of our portfolios and the amount in parenthesis represents the market capitalization of each company listed:
- Monday: None
- Tuesday: NFLX ($367 billion), SCHW ($136 billion), IBKR ($80 billion)
- Wednesday: PG ($379 billion), JNJ ($354 billion), ABT ($197 billion), KMI ($67 billion)
- Thursday: ISRG ($211 billion), GE ($198 billion), TXN ($176 billion) CSX ($63 billion)
- Friday: AXP ($220 billion), VZ ($163 billion)
Key Economic Reports
- Monday: None
- Tuesday: None
- Wednesday: December leading indicators
- Thursday: Initial jobless claims
- Friday: December existing home sales, January consumer sentiment
Historical Data
I'm a true stock market historian. I am absolutely PASSIONATE about studying stock market history to provide us more clues about likely stock market direction and potential sectors/industries/stocks to trade. While I don't use history as a primary indicator, I'm always very aware of it as a secondary indicator. I love it when history lines up with my technical signals, providing me much more confidence to make particular trades.
Below you'll find the next two weeks of historical data and tendencies across the 3 key indices that I follow most closely:
S&P 500 (since 1950)
- Jan 20: -67.02%
- Jan 21: -0.70%
- Jan 22: -10.42%
- Jan 23: +38.65%
- Jan 24: -14.31%
- Jan 25: +10.34%
- Jan 26: +29.56%
- Jan 27: +7.75%
- Jan 28: +54.14%
- Jan 29: +20.88%
- Jan 30: +2.25%
- Jan 31: +74.10%
- Feb 1: +47.30%
- Feb 2: +45.54%
NASDAQ (since 1971)
- Jan 20: -69.20%
- Jan 21: -21.36%
- Jan 22: -38.15%
- Jan 23: +94.39%
- Jan 24: -22.10%
- Jan 25: -5.40%
- Jan 26: +45.80%
- Jan 27: -43.49%
- Jan 28: +82.12%
- Jan 29: +14.37%
- Jan 30: -8.89%
- Jan 31: +87.33%
- Feb 1: +119.96%
- Feb 2: +37.65%
Russell 2000 (since 1987)
- Jan 20: -103.10%
- Jan 21: -39.60%
- Jan 22: +6.13%
- Jan 23: +101.18%
- Jan 24: -1.41%
- Jan 25: +4.75%
- Jan 26: +74.67%
- Jan 27: -99.42%
- Jan 28: +42.00%
- Jan 29: +1.83%
- Jan 30: -77.20%
- Jan 31: +107.92%
- Feb 1: +198.28%
- Feb 2: +21.08%
The S&P 500 data dates back to 1950, while the NASDAQ and Russell 2000 information date back to 1971 and 1987, respectively.
Final Thoughts
Clearly, the higher interest rate and higher inflation theme is playing out in the stock market short-term. The latest piece of evidence to support this was the Friday jobs report, which came in hotter than expected. We've seen treasury yields moving up and U.S. equities moving down as a result. So what should we look for this week?
- Interest Rates. The direction of the 10-year treasury yield ($TNX) seems to be driving the stock market, to some degree. As the TNX moves higher, stocks struggle, while the opposite is true when the TNX is declining. We've seen a much stronger stock market since the rather tame inflation data was released last week.
- Earnings. Earnings and interest rates drive stock prices. That may not be the case over the course of a week or a month, but over time, these are the two things that drive stock prices. Lower interest rates make earnings more valuable. And earnings themselves, along with expected future growth rates, help to set price multiples on earnings. I expect to see very strong earnings and that could absolutely be a catalyst for higher stock prices over the next 4 weeks or so. Netflix (NFLX) reports after the bell today and this could be a harbinger of things to come for the large cap growth stocks.
- Volatility ($VIX). The VIX has fallen back into a territory where bear markets, and even potential bear markets, die. This is another signal of bullish action ahead
- Seasonality. The most bullish period of the year, from the October 27th close through the January 18th close, has ended. It doesn't mean that the stock market can't or won't go higher, but we'll lose some of the strong seasonal tailwinds that we've enjoyed since late October.
Feedback
If you'd like to share your thoughts on our Weekly Market Report, positive or negative, you can reach us at "[email protected]".
Happy trading!
Tom