
EB Weekly Market Report - Monday, February 10, 2025
ChartLists Updated
The following ChartLists were updated over the weekend:
- Strong Earnings (SECL)
- Strong Future Earnings (SFECL)
- Raised Guidance (RGCL)
- Bullish Trifecta (BTCL)
These ChartLists are available to download into your StockCharts Extra or Pro account, if you have a StockCharts membership. Otherwise, we can send you an Excel file with the stocks included in these ChartLists in order to download them into other platforms. If you have any questions, please reach out to us at "[email protected]".
Weekly Market Recap
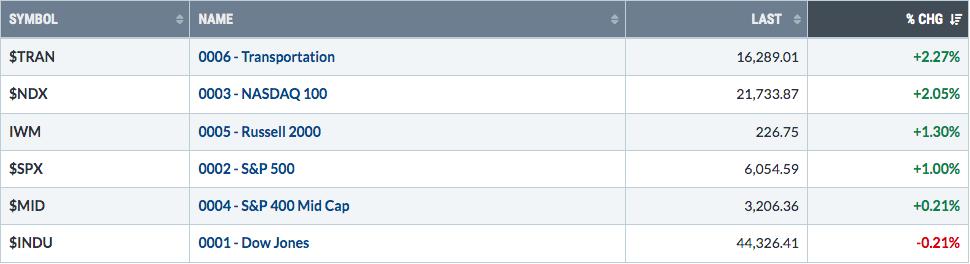
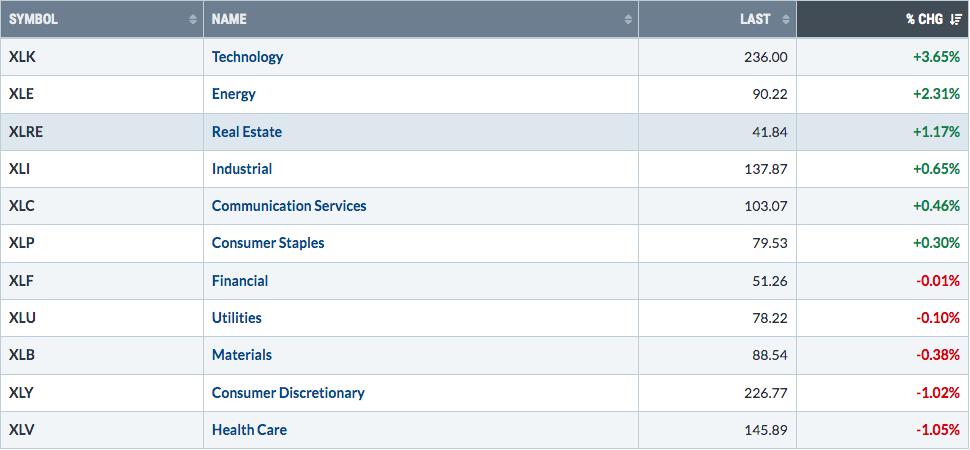
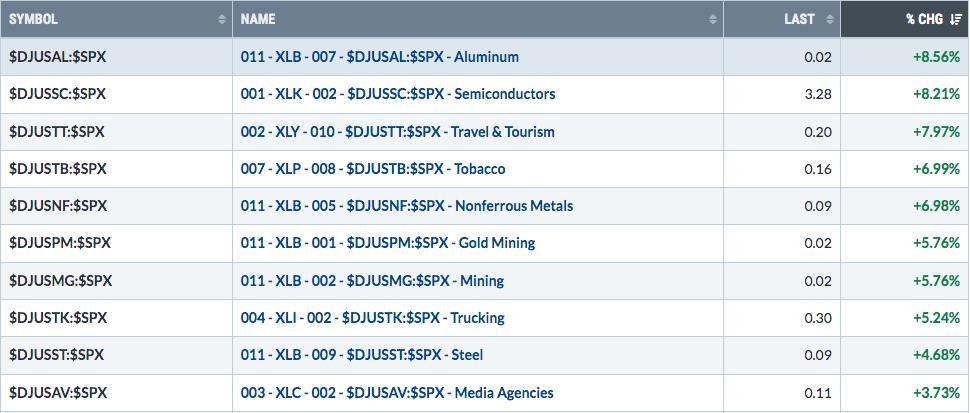
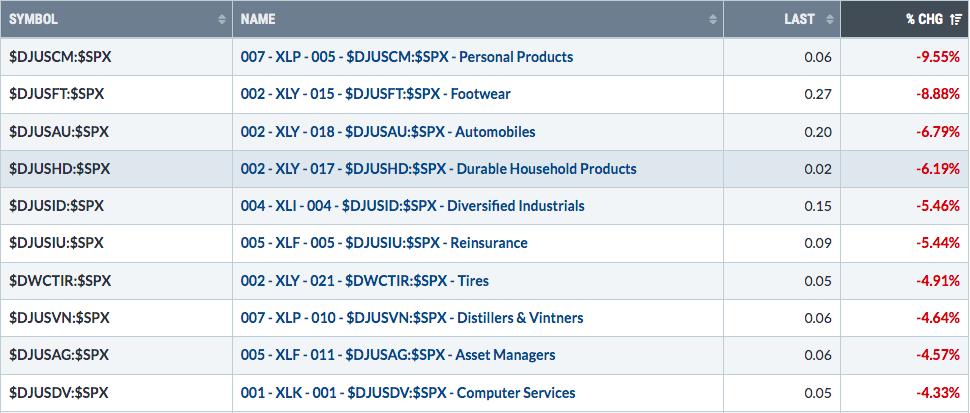
I wasn't able to capture screen shots for each of the categories below before the market opened. So all of these represent 1-week returns from the time of this writing:
Major Indices
Sectors
Top 10 Industries Last Week
Bottom 10 Industries Last Week
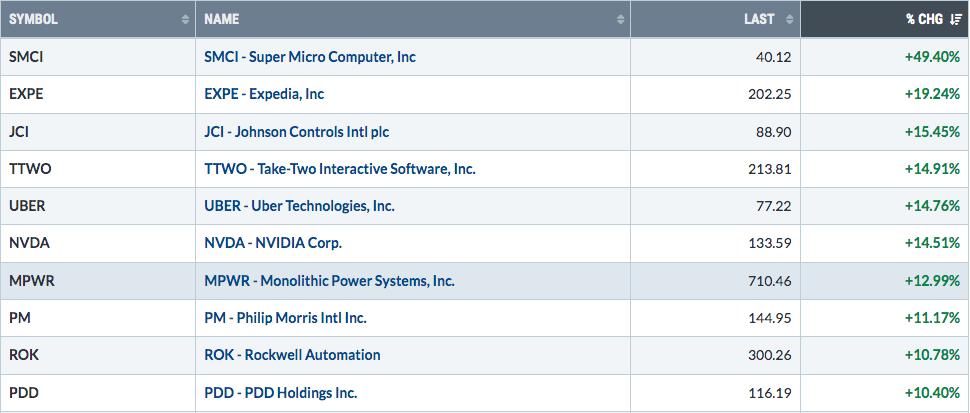
Top 10 Stocks - S&P 500/NASDAQ 100
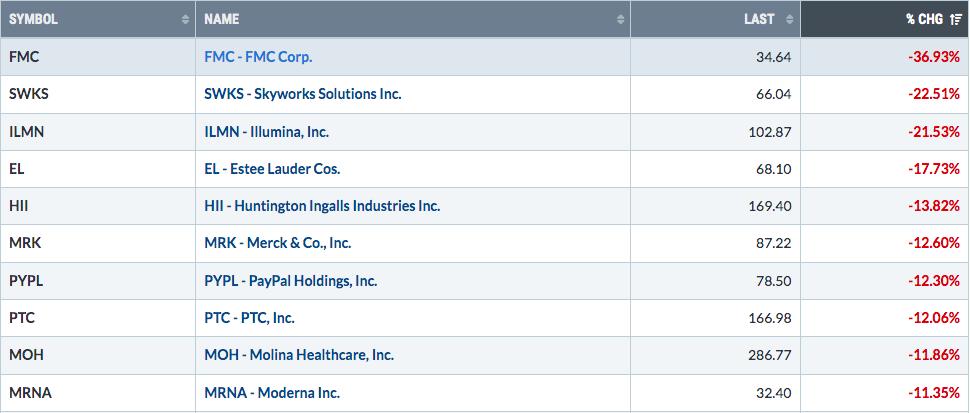
Bottom 10 Stocks - S&P 500/NASDAQ 100
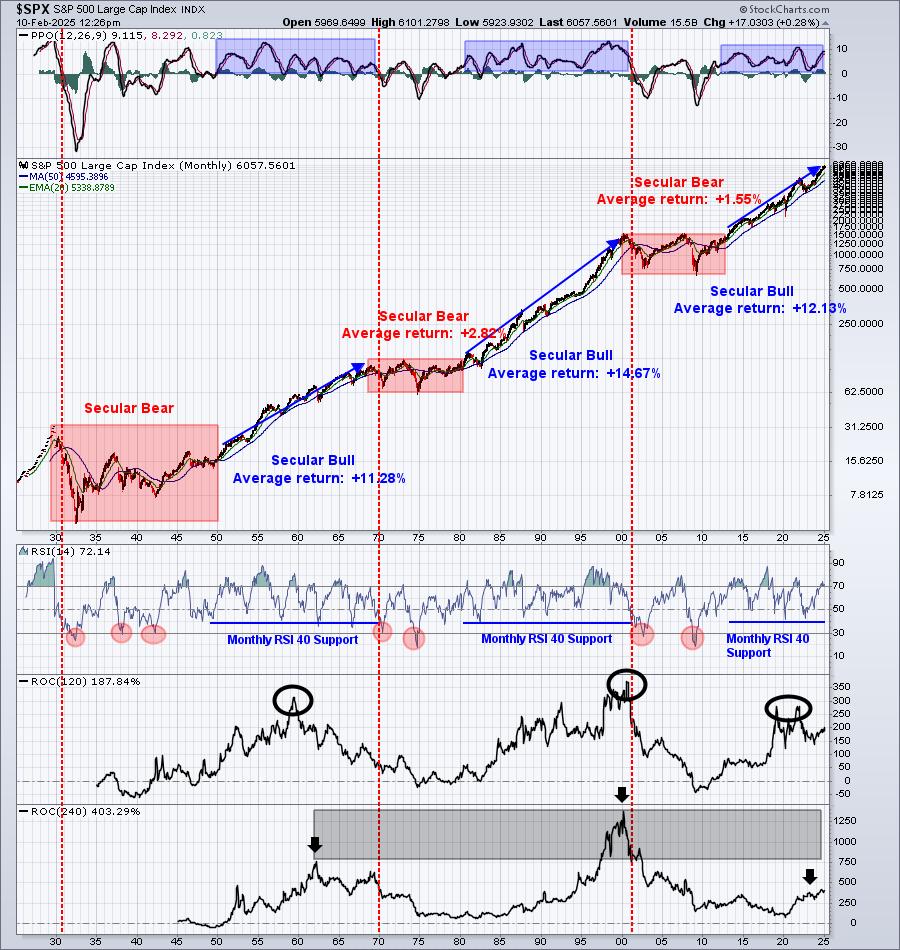
Big Picture
Last week, we saw a replay of the week before. It all started with a news-related gap down (DeepSeek two weeks ago, Trump tariffs last week). But then we rallied during the middle part of the week, erasing the Monday weakness. Then on Friday, selling returned to finish lower for the week. We've tried something new today as we saw gap ups to start this week. The real key short-term, however, is simply creating enough buying pressure to clear overhead price resistance and move into all-time high territory.
Sustainability Ratios
Here's the latest look at our key intraday ratios as we follow where the money is traveling on an INTRADAY basis (ignoring gaps):
QQQ:SPY
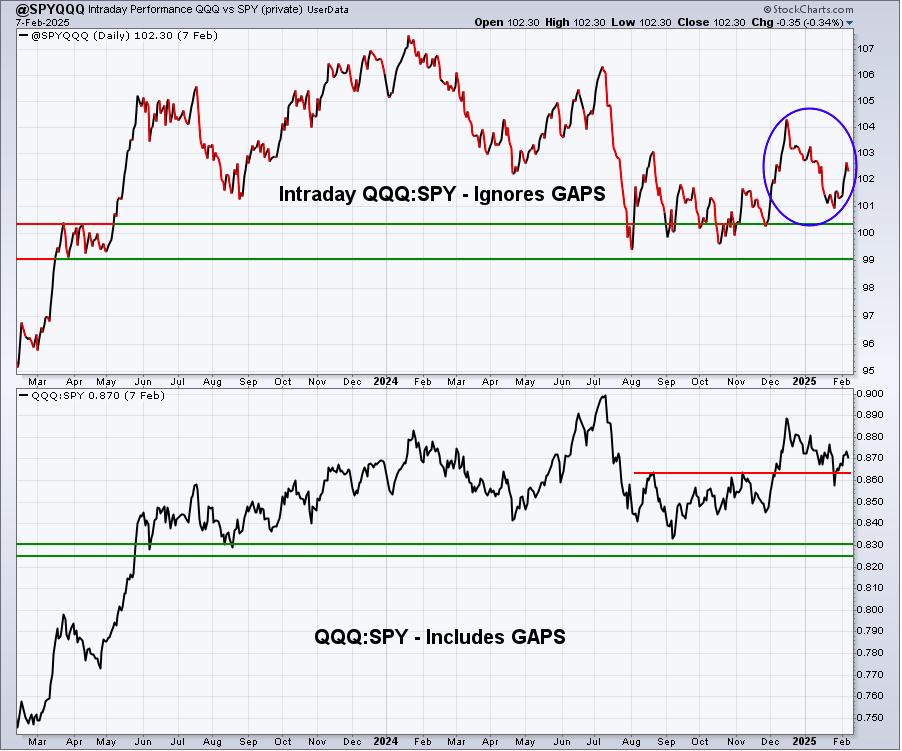
The relative downtrend since mid-December continues. If nothing else, this is like so many other relationships in the stock market - indecisive.
IWM:QQQ
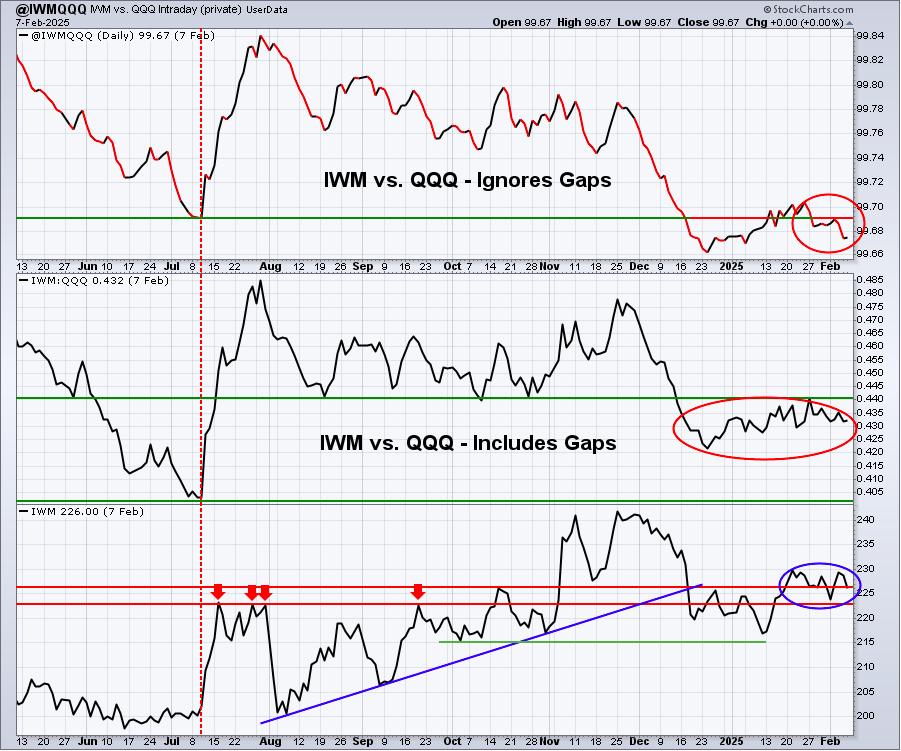
I'm keeping my eye on the July 2024 relative low in the bottom panel. Breaking below this low would be very bearish for small caps.
XLY:XLP
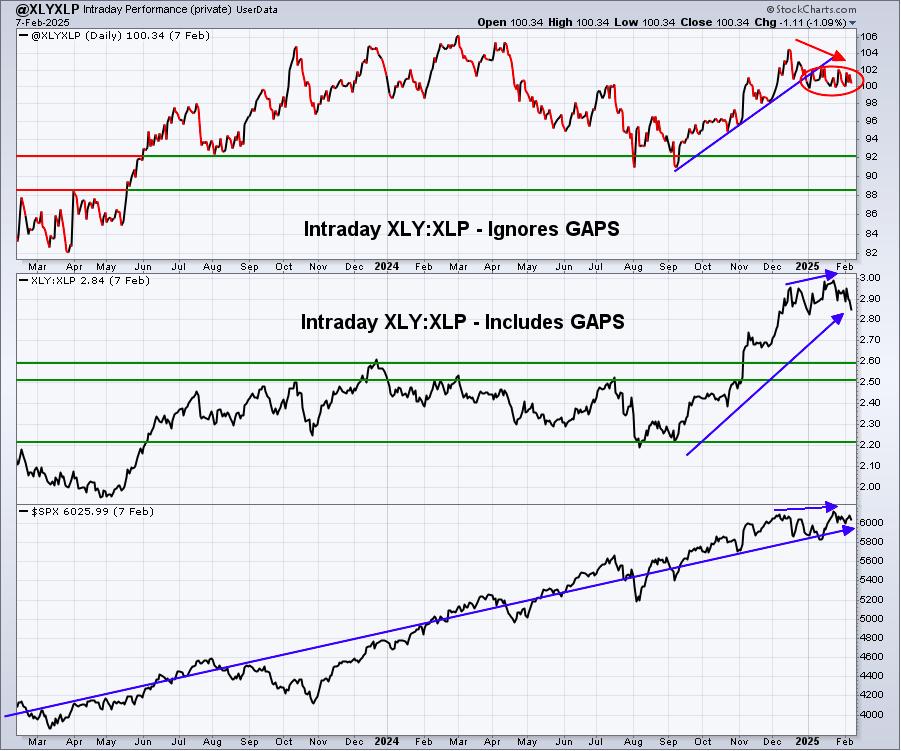
I view the XLY:XLP as the most important ratio, simply because there's been very strong positive correlation between the direction of the XLY:XLP and the direction of the benchmark S&P 500 throughout history. I'd like to see the last 3-4 weeks downtrend come to an end, but we're not there yet.
Sentiment
5-day SMA ($CPCE)
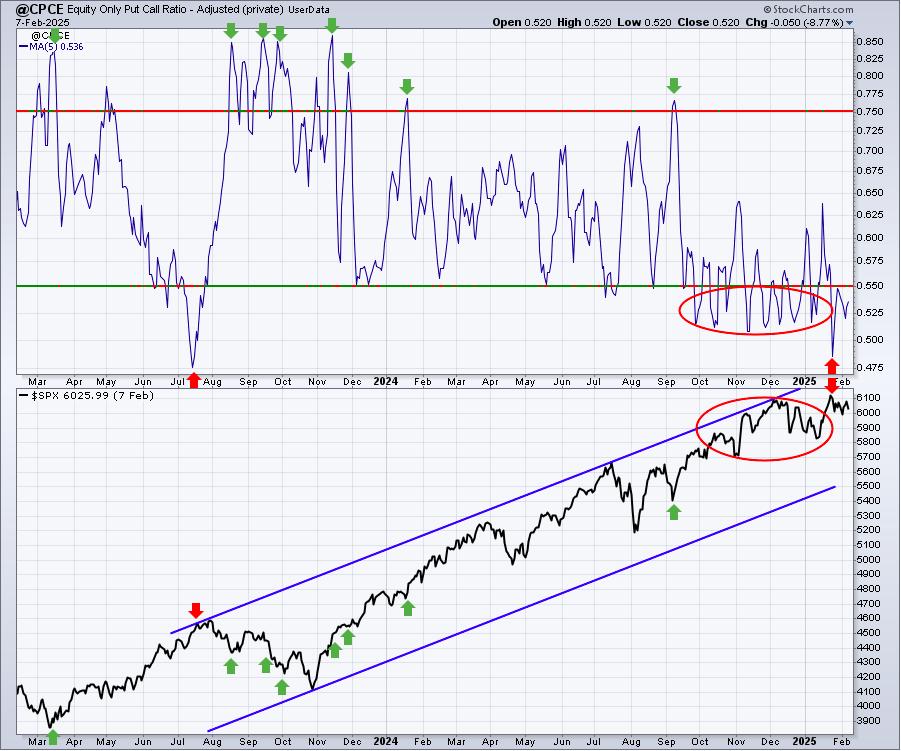
Sentiment indicators are contrarian indicators. When they show extreme bullishness, we need to be a bit cautious and when they show extreme pessimism, it could be time to become much more aggressive. Major market bottoms are carved out when pessimism is at its absolute highest level.
We've had members write in and ask us to make the above chart clearer - in terms of what's bullish and what's bearish. Keep in mind that I usually highlight bullish developments with green and bearish developments with red. For instance, when the 5-day SMA of the CPCE moves above .75, that means retail options traders are bearish. But since that is a contrarian indicator, it actually means bearish options traders are bullish for the stock market. Hence, I use green arrows to highlight (1) the high CPCE readings, and (2) corresponding market bottoms. Complacent, or bullish, CPCE readings are identified with red arrows to highlight (1) the low CPCE readings, and (2) corresponding market tops.
I hope this helps to clarify sentiment a bit.
253-day SMA ($CPCE)
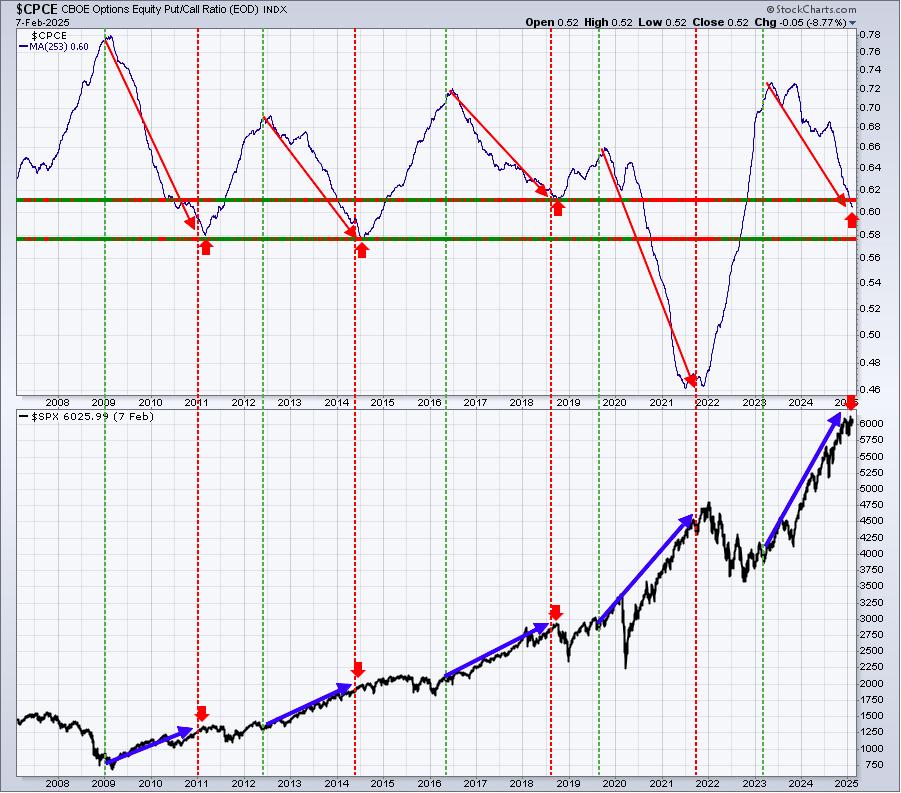
A falling 253-day SMA of the CPCE is synonymous with an extended secular bull market rally and I believe that's EXACTLY what we're in. I've added red arrows this week to identify "normal" turning points on this 253-day SMA in the .58-.61 range. We're in that range now. While it hasn't necessarily provided us with a major market top immediately, you can see from the above that moving appreciably higher with so much bullishness in options isn't likely either. This adds to my belief that we could be in for frustrating sideways action for awhile.
U.S. vs. International
Periodically, I like to review U.S. stock performance vs. many of the prominent foreign indices around the world, looking to see if any major rotation is taking place:
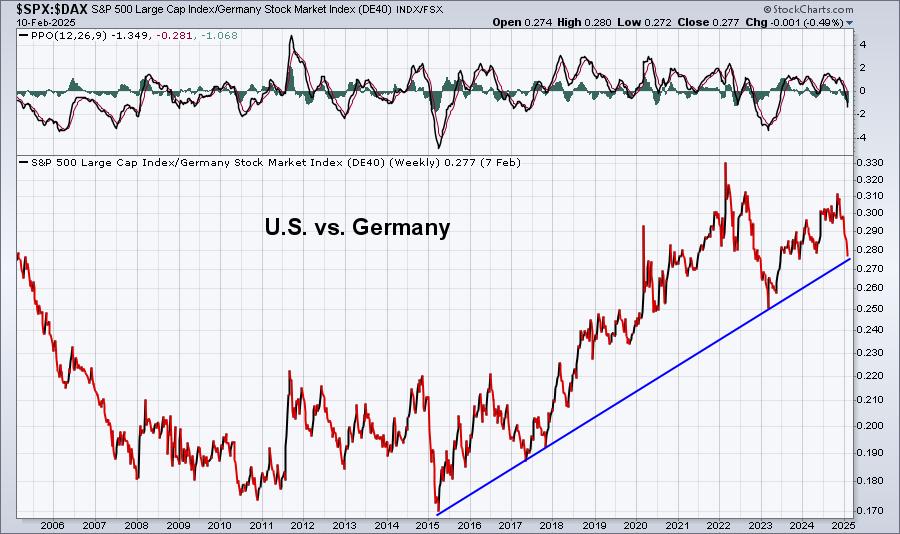
$SPX vs. $DAX (Germany)
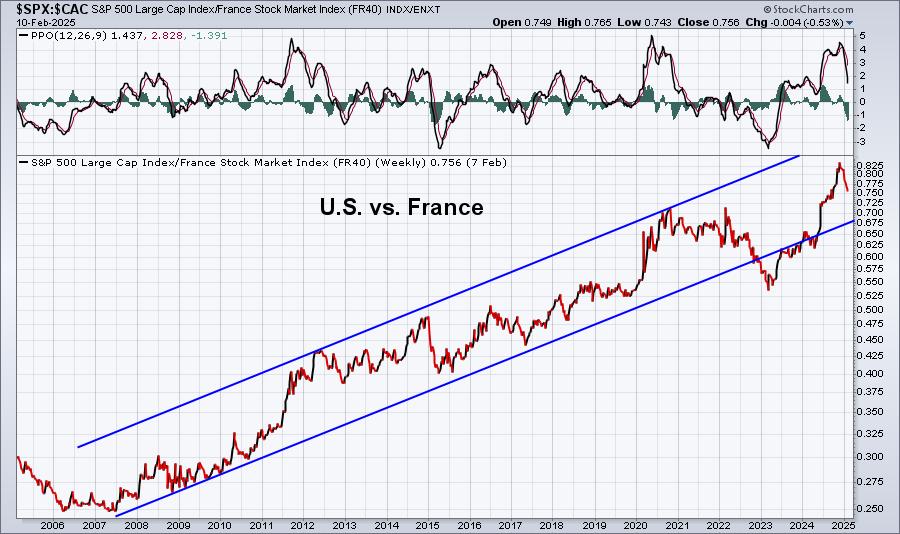
$SPX vs. $CAC (France)
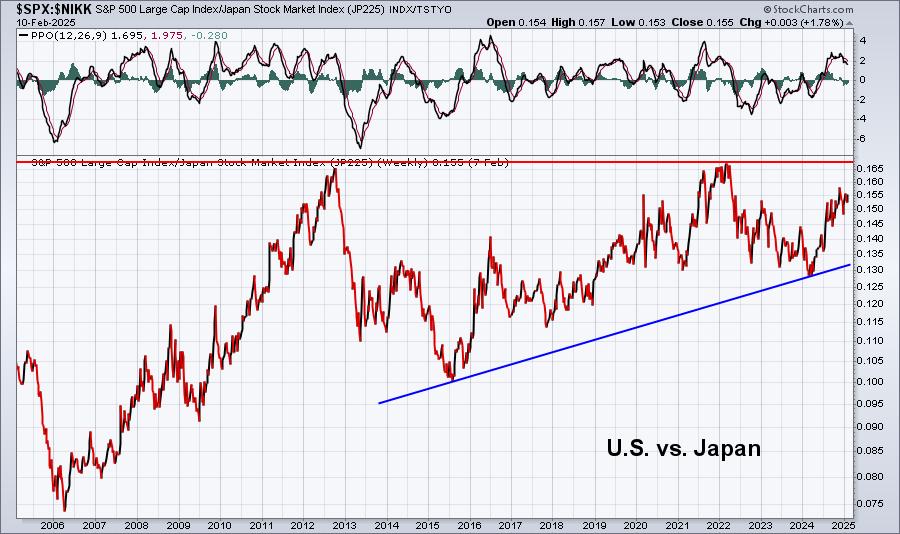
$SPX vs. $NIKK (Japan)
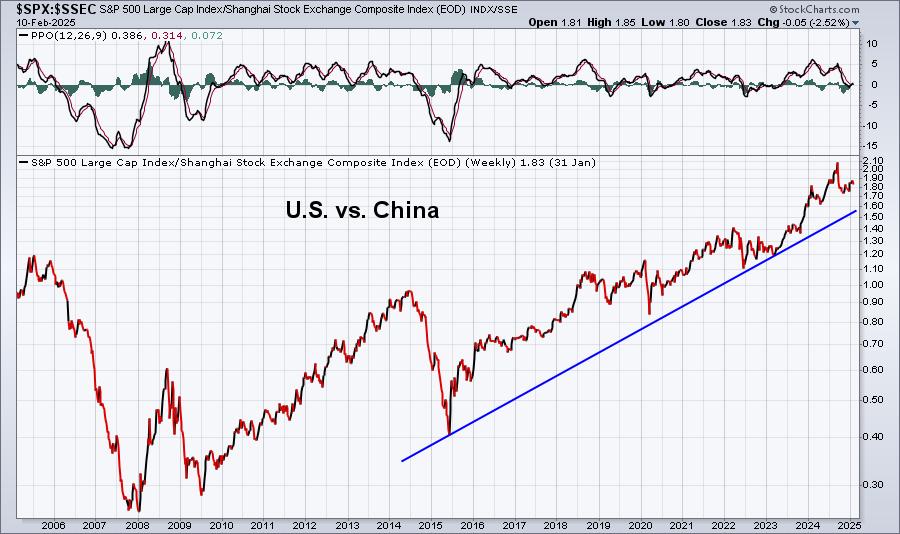
$SPX vs. $SSEC (China)
$SPX vs. $HSI (Hong Kong)
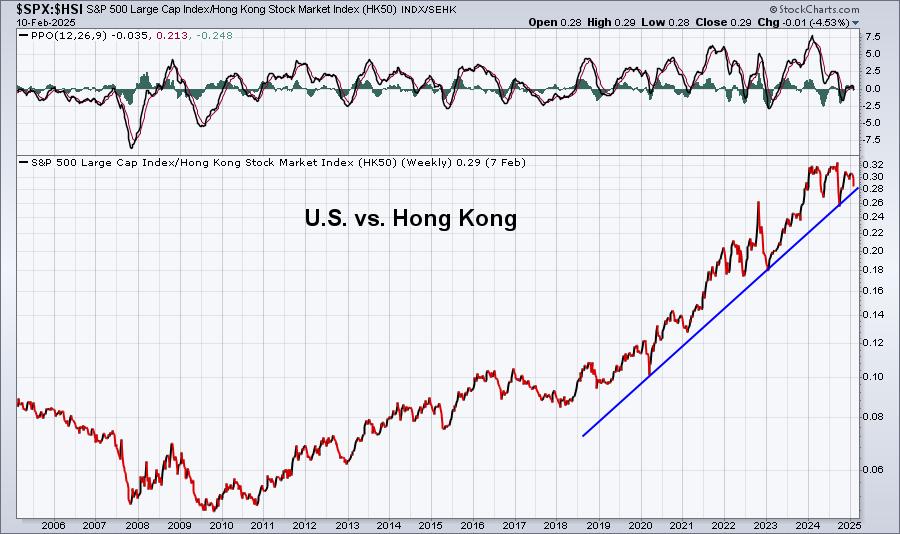
It's still safe to say that U.S. stocks remain quite healthy relative to most of its foreign counterparts. The German DAX has shown very nice relative performance vs. the S&P 500 since late-2024, and even since the relative top back in 2022. Otherwise, I'm seeing U.S. stocks leading the way.
Long-Term Trade Setup
Since beginning this Weekly Market Report in September 2023, I've discussed the long-term trade candidates below that I really like. Generally, these stocks have excellent long-term track records and many pay nice dividends that mostly grow every year. Only in very specific cases (exceptions) would I consider a long-term entry into a stock that has a poor or limited long-term track record and/or pays no dividends. Below is a quick recap of how I viewed their long-term technical conditions a couple weeks back:
- JPM - enjoying one of its best rallies in its long history
- BA - a move through 183 or so could really kick start the stock
- FFIV - new highs in place, but volume is tailing off with a negative divergence on weekly chart, may pause here
- MA - looking for next all-time high breakout
- GS - excellent uptrend in place
- FDX - tested 20-month EMA, 310 area is critical resistance until broken
- AAPL - has run into short-term selling, likely solid entry here
- CHRW - consolidating after 50% move higher in 2024
- JBHT - remains in lengthy consolidation period
- STX - great start to 2025, needs to clear resistance in 110-115 area
- HSY - brutal 25%+ drop over past 5-6 weeks, loves next few months historically
- DIS - after 6 weeks of selling, resuming strength the past week
- MSCI - continuing to trend higher, sights set on late-2021 and all-time high near 650
- SBUX - building bullish short-term momentum
- KRE - has received boost in 2025 as 10-year treasury yield ($TNX) topped and reversed
- ED - been weak, but long-term support remains intact
- AJG - one of most consistent and dependable uptrends off of pandemic low in 2020
- NSC - late stage cup with handle pattern on monthly chart, will likely lead to a solid 2025
- RHI - long-term price support is in 58-60 area, still looks solid as a long-term buy and hold
- ADM - remains in 2-year downtrend, could potentially reach key support from 40-43
- BG - continues to test key price support in the 75-80 range, monthly RSI at 40
- CVS - awesome response as buyers have poured in off of recent 43-44 price support test
- IPG - 3-year consolidation has stock in middle of its 15-month 26-32 price range
- HRL - bound between price support at 27.50 and 20-month EMA resistance at 33.07
- DE - broke out to new all-time highs recently, after its monthly PPO turned higher from near the zero line
Keep in mind that our Weekly Market Reports favor those who are more interested in the long-term market picture. Therefore, the list of stocks above are stocks that we believe are safer (but nothing is ever 100% safe) to own with the long-term in mind. Nearly everything else we do at EarningsBeats.com favors short-term momentum trading, so I wanted to provide an explanation of what we're doing with this list and why it's different.
Also, please keep in mind that I'm not a Registered Investment Advisor (and neither is EarningsBeats.com nor any of its employees) and am only providing (mostly) what I believe to be solid dividend-paying stocks for the long-term. Companies periodically go through adjustments, new competition, restructuring, management changes, etc. that can have detrimental long-term impacts. The stock price nor the dividend is ever guaranteed. I simply point out interesting stock candidates for longer-term investors. Do your own due diligence and please consult with your financial advisor before making any purchases or sales of securities.
Looking Ahead
Upcoming Earnings
Q4 earnings are in full gear and many of the biggest growth names have either just reported or are getting ready to. The following list of companies is NOT a list of all companies scheduled to report quarterly earnings, however, just key reports, so please be sure to check for earnings dates of any companies that you own. Any company in BOLD represents a stock in one of our portfolios and the amount in parenthesis represents the market capitalization of each company listed:
- Monday: MCD ($211 billion) VRTX ($124 billion)
- Tuesday: KO ($273 billion), SHOP ($153 billion), DASH ($82 billion)
- Wednesday: CSCO ($248 billion), APP ($128 billion), TTD ($57 billion), HOOD ($47 billion)
- Thursday: AMAT ($149 billion), DE ($127 billion), PANW ($123 billion), ABNB ($84 billion)
- Friday: None
Key Economic Reports
- Monday: None
- Tuesday: None
- Wednesday: January CPI
- Thursday: Initial jobless claims, January PPI
- Friday: January retail sales, January industrial production & capacity utilization, December business inventories
Historical Data
I'm a true stock market historian. I am absolutely PASSIONATE about studying stock market history to provide us more clues about likely stock market direction and potential sectors/industries/stocks to trade. While I don't use history as a primary indicator, I'm always very aware of it as a secondary indicator. I love it when history lines up with my technical signals, providing me much more confidence to make particular trades.
Below you'll find the next two weeks of historical data and tendencies across the 3 key indices that I follow most closely:
S&P 500 (since 1950)
- Feb 10: -1.93%
- Feb 11: +0.16%
- Feb 12: +46.27%
- Feb 13: +44.42%
- Feb 14: +11.65%
- Feb 15: +58.41%
- Feb 16: -21.36%
- Feb 17: -31.56%
- Feb 18: +1.24%
- Feb 19: -26.20%
- Feb 20: -1.08%
- Feb 21: -53.60%
- Feb 22: +10.49%
- Feb 23: -34.99%
NASDAQ (since 1971)
- Feb 10: +25.71%
- Feb 11: +64.51%
- Feb 12: +53.27%
- Feb 13: +29.53%
- Feb 14: +60.70%
- Feb 15: +82.64%
- Feb 16: -39.94%
- Feb 17: -52.28%
- Feb 18: -13.59%
- Feb 19: -50.81%
- Feb 20: -19.32%
- Feb 21: -111.19%
- Feb 22: -11.55%
- Feb 23: -35.59%
Russell 2000 (since 1987)
- Feb 10: -25.82%
- Feb 11: +94.21%
- Feb 12: +103.46%
- Feb 13: +34.18%
- Feb 14: +42.57%
- Feb 15: +140.61%
- Feb 16: +40.51%
- Feb 17: -66.49%
- Feb 18: -39.52%
- Feb 19: -23.58%
- Feb 20: -61.33%
- Feb 21: -115.99%
- Feb 22: -1.86%
- Feb 23: -65.05%
The S&P 500 data dates back to 1950, while the NASDAQ and Russell 2000 information date back to 1971 and 1987, respectively.
Final Thoughts
Our major indices are battling overhead price resistance as they consolidate and search for short-term direction. Here are a few things I'll be watching this week:
- Seasonality. We're in a pocket of historical strength right now, but it won't last. Just about as soon as the February calendar flips to the 16th, the 2nd half of Q1 (February 16 through March 31) kicks in.
- Inflation. Any time that CPI and PPI reports are due out, it'll be important. The January reports are due out on Wednesday and Thursday, respectively. The CPI report, in particular, could have significant short-term market implications as it's a very closely watched report by the Fed.
- Earnings. We'll see another large batch of earnings reports out this week. Continue to focus on
- Sector Rotation. Technology is a very large part of the S&P 500 and NASDAQ, so how that sector trades will influence our major market indices.
- Volatility ($VIX): Any increase in the VIX would mean to tread carefully. The VIX is down 4.6% today, down to 15.78. A close below the 14.50-15.00 range would be bullish for the market, while a move back higher into the 17-20 zone would have me much more cautious.
Happy trading!
Tom