
EB Weekly Market Report - Tuesday, February 18, 2025
ChartLists Updated
The following ChartLists were updated over the weekend:
- Strong Earnings (SECL)
- Strong Future Earnings (SFECL)
- Raised Guidance (RGCL)
- Strong AD (SADCL)
- Bullish Trifecta (BTCL)
- Upcoming Earnings
- Upcoming Earnings - Relative Strength
These ChartLists are available to download into your StockCharts Extra or Pro account, if you have a StockCharts membership. Otherwise, we can send you an Excel file with the stocks included in these ChartLists in order to download them into other platforms. If you have any questions, please reach out to us at "[email protected]".
Weekly Market Recap
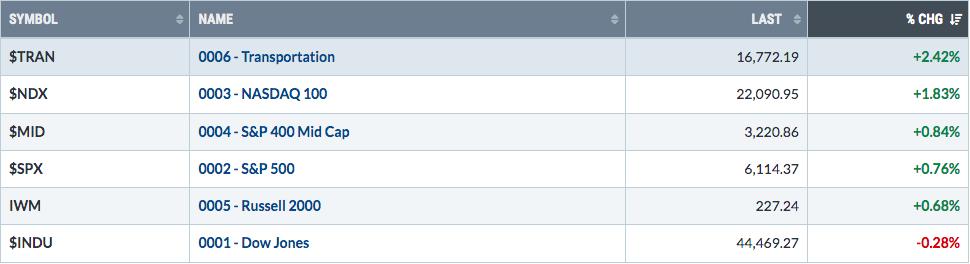
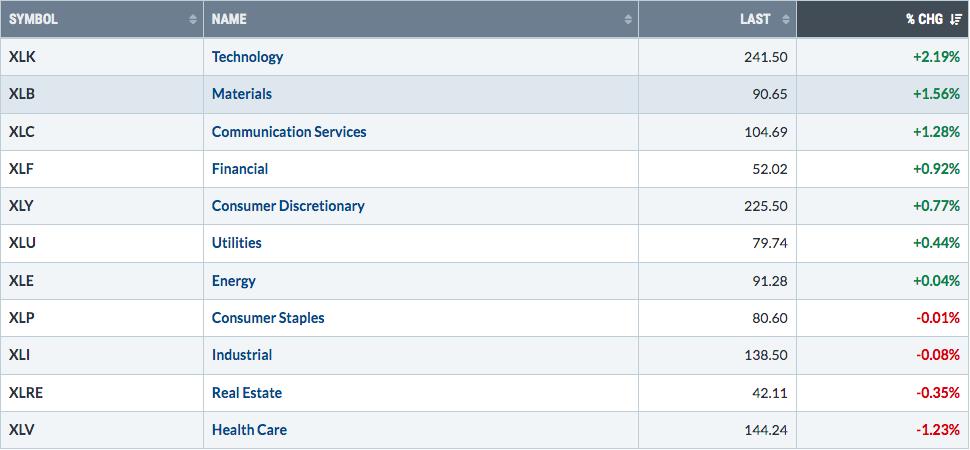
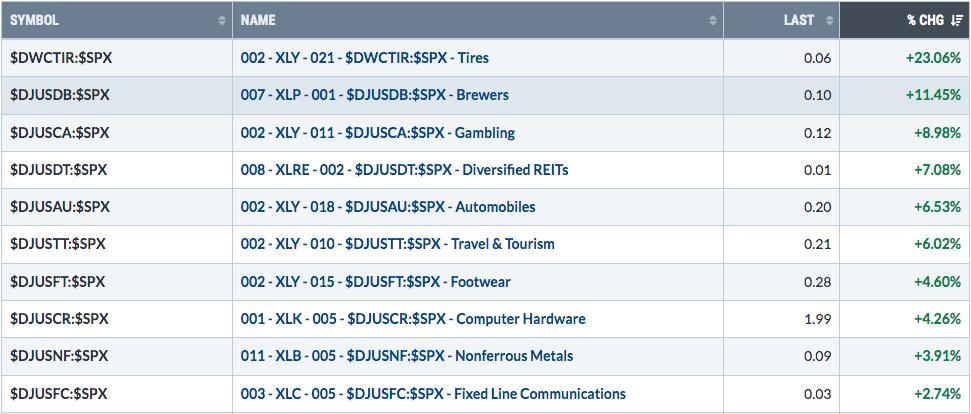
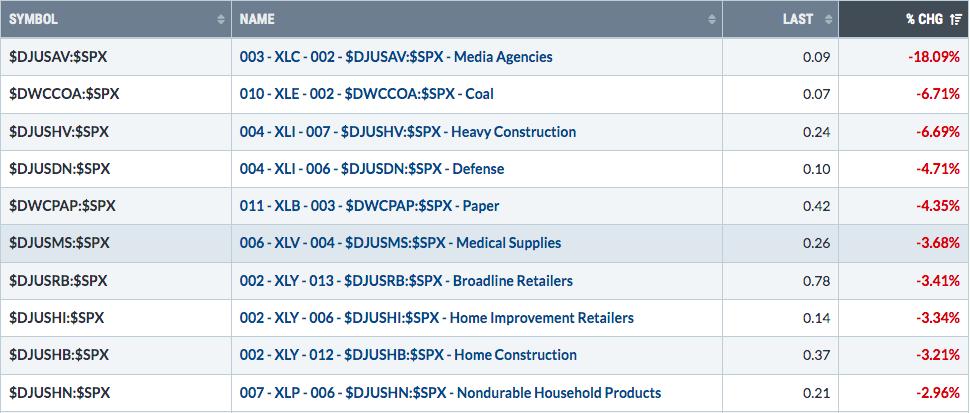
I wasn't able to capture screen shots for each of the categories below before the market opened today. So all of these represent 1-week returns from the time of this writing:
Major Indices
Sectors
Top 10 Industries Last Week
Bottom 10 Industries Last Week
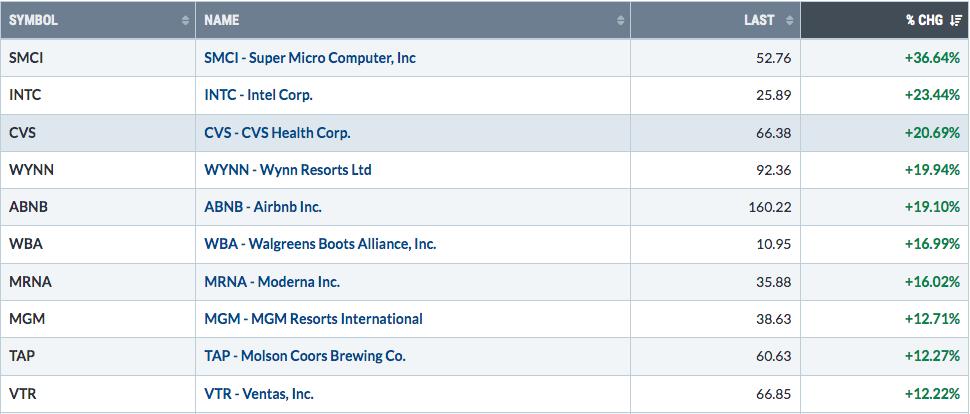
Top 10 Stocks - S&P 500/NASDAQ 100
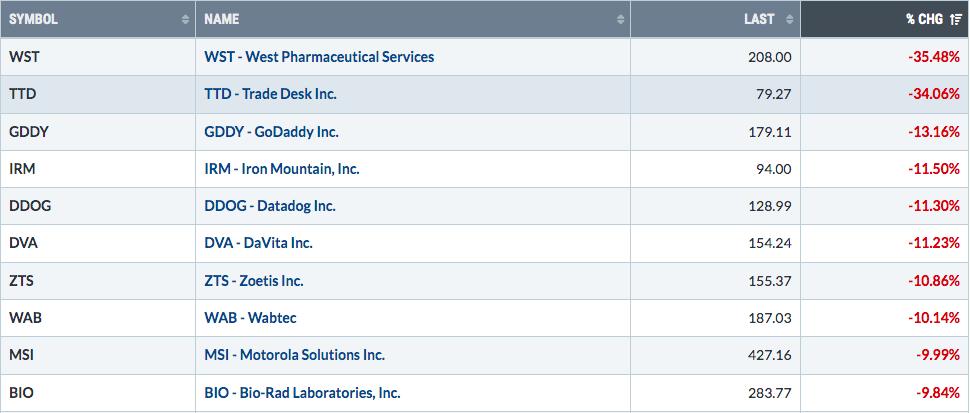
Bottom 10 Stocks - S&P 500/NASDAQ 100
Big Picture
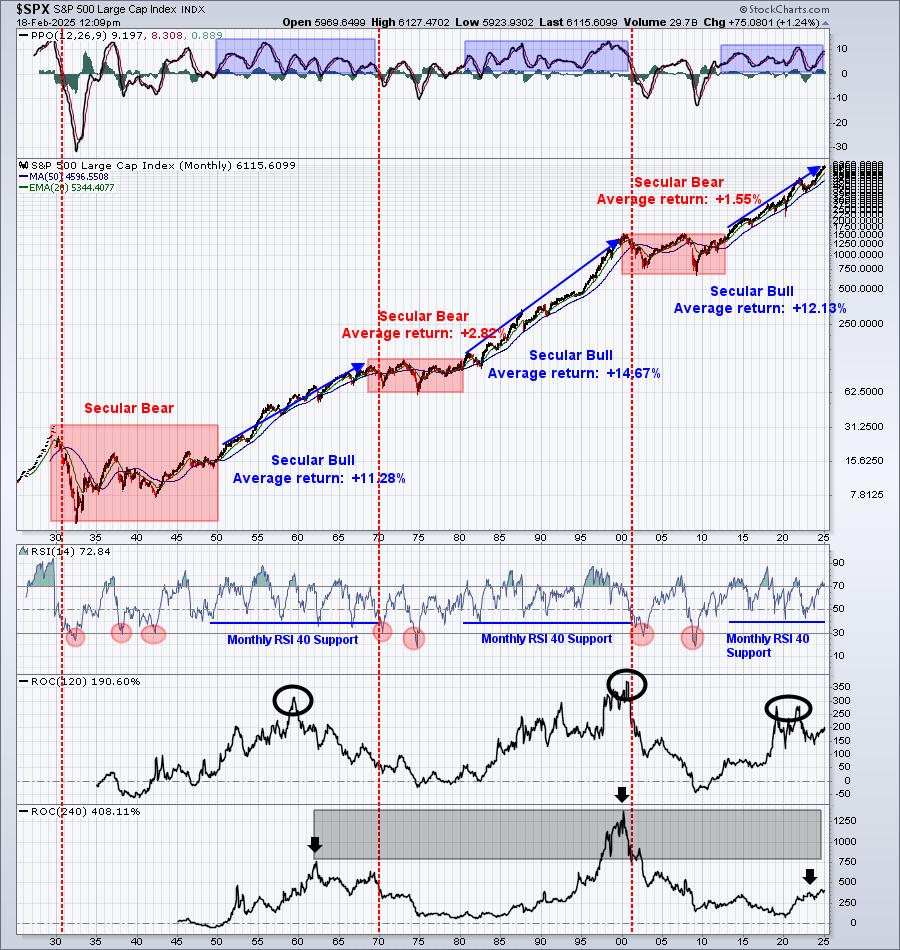
Lots of short-term noise, but no long-term damage. That's what I continue to see above. It suggests that those in it for the long-term maintain positions, even if a short-term market downturn develops.
Sustainability Ratios
Here's the latest look at our key intraday ratios as we follow where the money is traveling on an INTRADAY basis (ignoring gaps):
QQQ:SPY
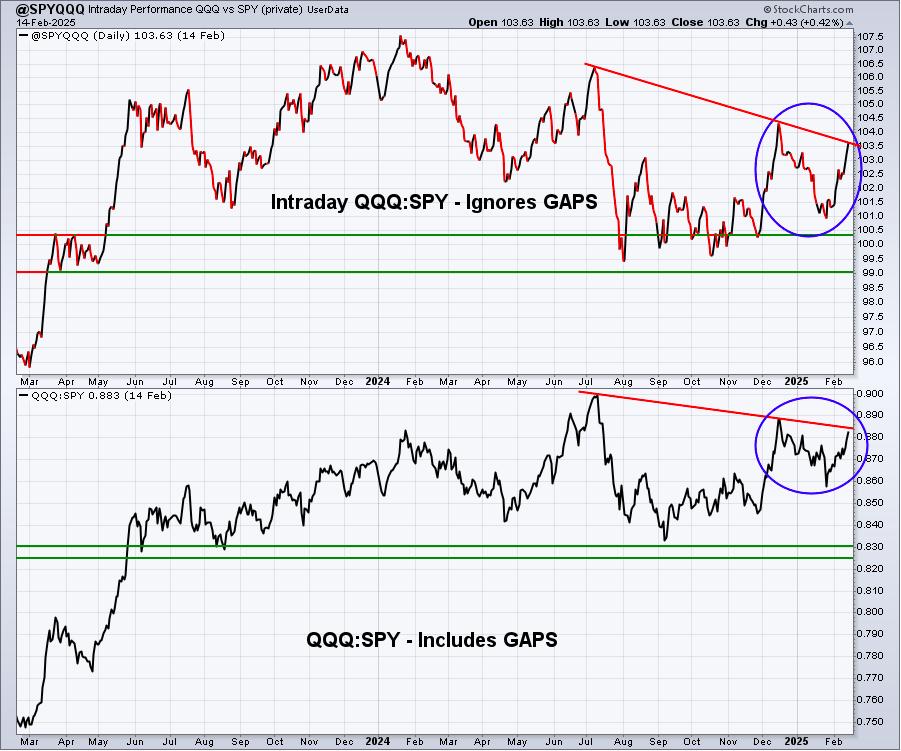
This relationship has turned more bullish for sure. We are now testing and/or approaching key relative downtrend resistance. Clearing these relative downtrend lines will be important to sustain any market advance ahead.
IWM:QQQ
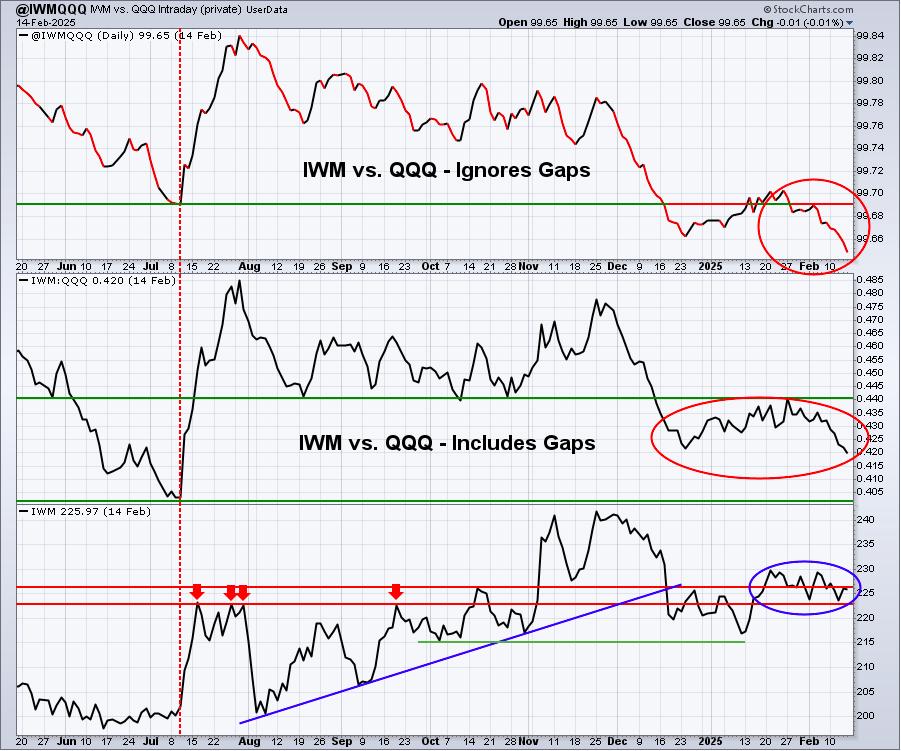
The Fed's waffling and decision to "pause" interest rate cuts (for now) has had the biggest impact on small and mid caps, which had caught fire on an absolute and relative basis in mid-2024 with the prospects of many rate cuts coming. The pausing has caused money to once again rotate away from the small cap IWM and the chart above shows this very clearly. The July 2024 IWM:QQQ relative low remains key for me.
XLY:XLP
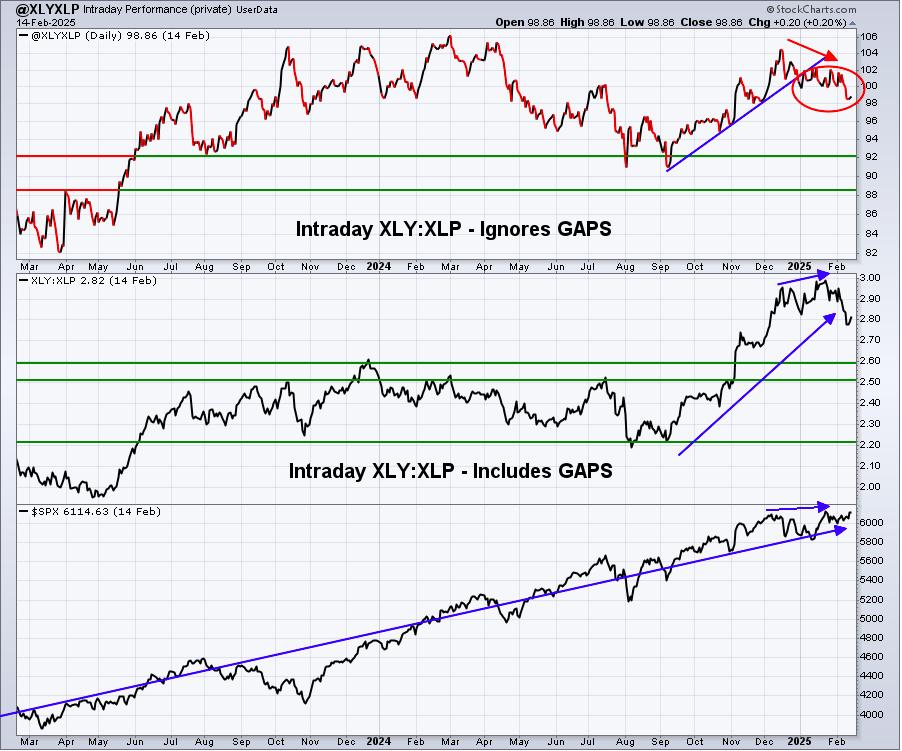
This is not a good look either. As the S&P 500 makes another attempt at breaking out to all-time highs, the XLY:XLP ratio has turned lower. Making or threatening to make new highs with defensive leadership and strength is never a bullish signal. This is one of my biggest caution signals as we enter the much-less-bullish 2nd half of Q1 (Feb 16-Mar 31).
Sentiment
5-day SMA ($CPCE)
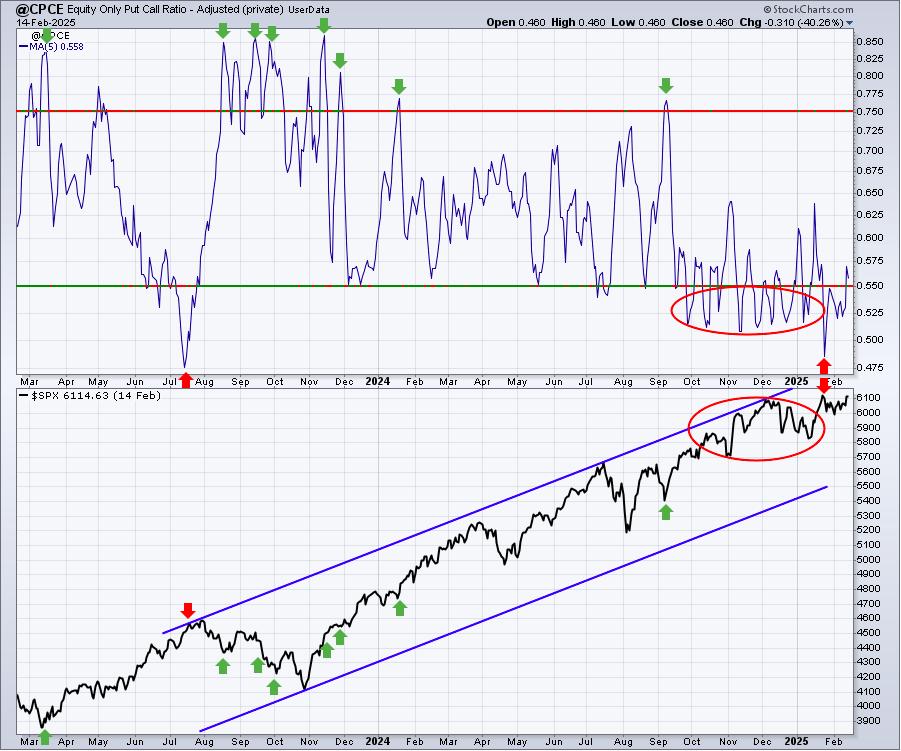
Sentiment indicators are contrarian indicators. When they show extreme bullishness, we need to be a bit cautious and when they show extreme pessimism, it could be time to become much more aggressive. Major market bottoms are carved out when pessimism is at its absolute highest level.
We've had members write in and ask us to make the above chart clearer - in terms of what's bullish and what's bearish. Keep in mind that I usually highlight bullish developments with green and bearish developments with red. For instance, when the 5-day SMA of the CPCE moves above .75, that means retail options traders are bearish. But since that is a contrarian indicator, it actually means bearish options traders are bullish for the stock market. Hence, I use green arrows to highlight (1) the high CPCE readings, and (2) corresponding market bottoms. Complacent, or bullish, CPCE readings are identified with red arrows to highlight (1) the low CPCE readings, and (2) corresponding market tops.
I hope this helps to clarify sentiment a bit.
253-day SMA ($CPCE)
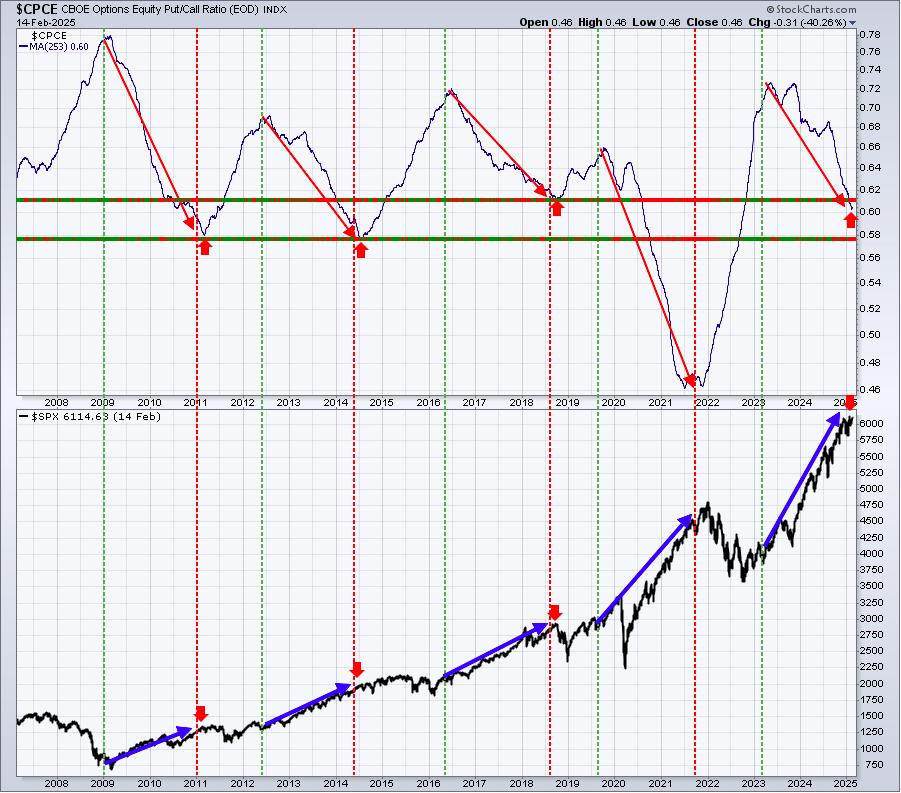
A falling 253-day SMA of the CPCE is synonymous with an extended secular bull market rally and I believe that's EXACTLY what we're in. I've shown red arrows to identify "normal" turning points on this 253-day SMA in the .58-.61 range. We're in that range now. While it hasn't necessarily provided us with a major market top immediately, you can see from the above that moving appreciably higher with so much bullishness in options isn't likely either. This adds to my belief that we could be in for frustrating sideways action for awhile, possibly even a period of selling.
Sectors
Let's check in on a couple key sectors over a longer-term, 5-year period:
XLC:
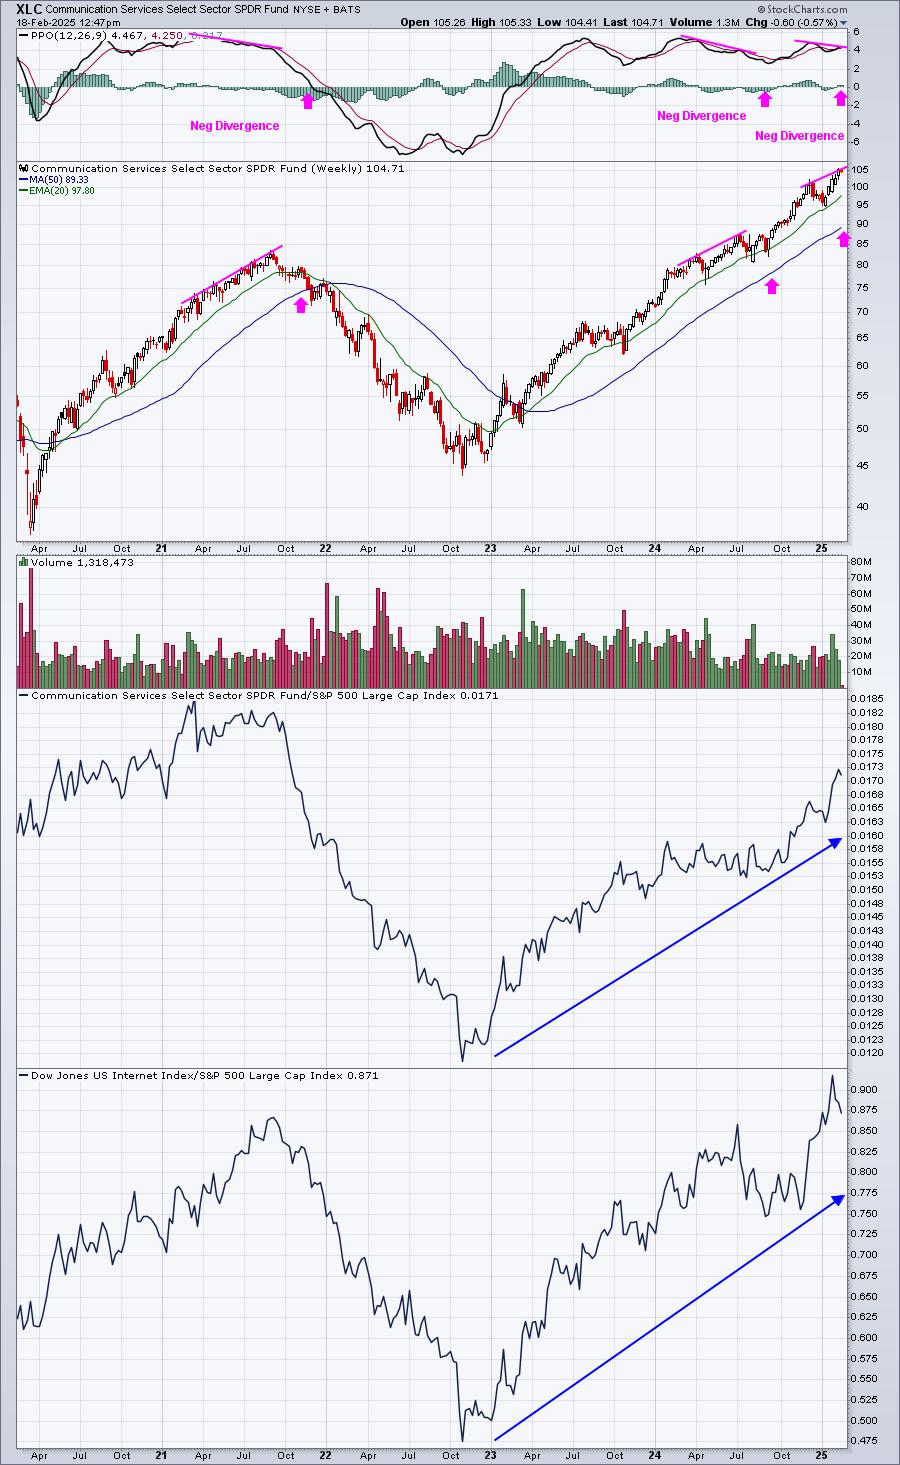
The XLC has been a leading sector for over two years, but it is currently showing a bit of slowing momentum. We've seen this in the recent past. The negative divergence in 2021 led to PPO centerline and 50-week SMA tests, which is what I expect after negative divergences print. The last negative divergence in mid-July 2024 was eliminated when prices moved higher and the weekly PPO cleared prior tops. This simply underscores the fact that technical analysis is flawed sometimes. Nothing works 100% of the time, but we should view such technical developments with caution. The negative divergence currently in play also suggests caution.
XLP:
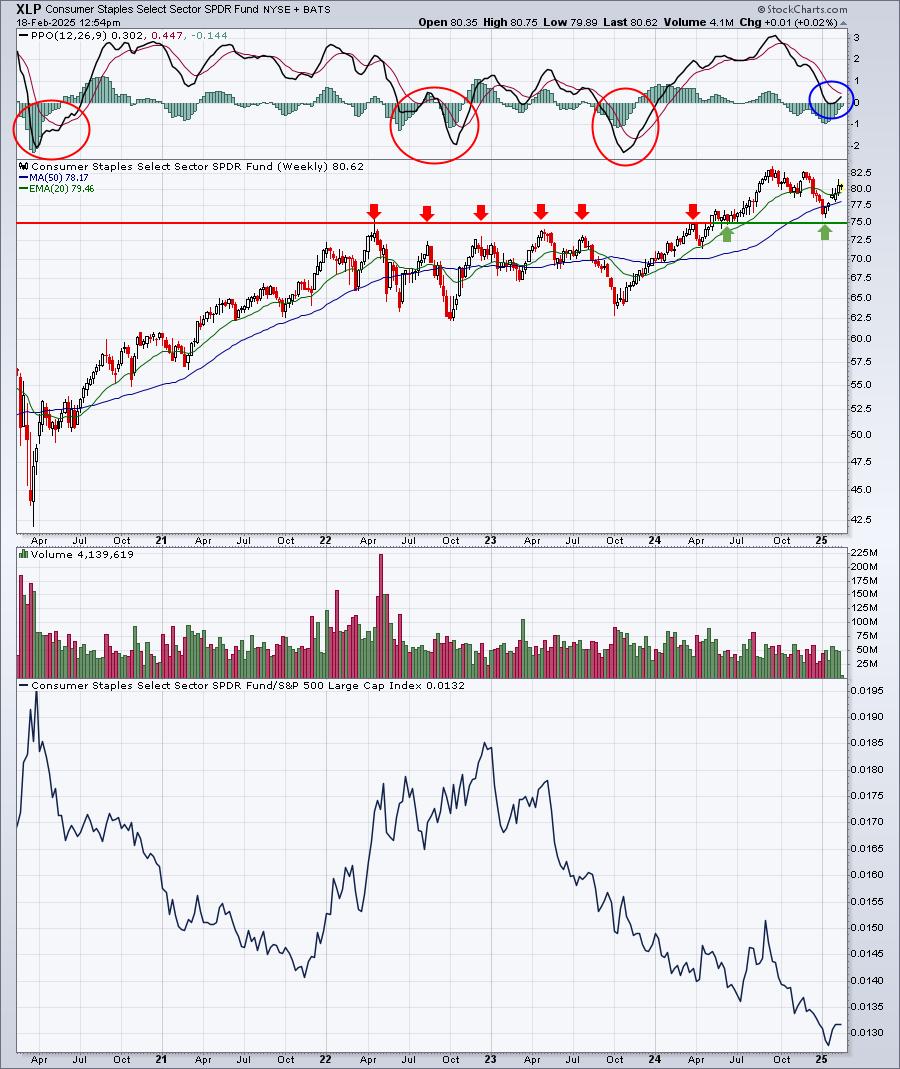
I'm watching the XLP closely, not because it's a leader. Rather, because it's in an uptrend and normally begins downtrending when the overall market turns more bearish in the short-term. Check out those PPO centerline crossovers from positive to negative. They've coincided with bearish action the last 5 years. We're not seeing a crossover just yet, but we should at least be aware of the recent PPO centerline test and make sure it holds.
The bottom panel shows that the consumer staples sector does not lead. It nearly always lags other more aggressive sectors during secular bull market advances. So, if the S&P 500 does push higher and set new all-time highs, we'll want to see the absolute price action in XLP hold up, while the relative strength in XLP rolls over and moves to new lows. That's one way to tell that we're in a bullish market environment.
Long-Term Trade Setup
Since beginning this Weekly Market Report in September 2023, I've discussed the long-term trade candidates below that I really like. Generally, these stocks have excellent long-term track records and many pay nice dividends that mostly grow every year. Only in very specific cases (exceptions) would I consider a long-term entry into a stock that has a poor or limited long-term track record and/or pays no dividends. Below is a quick recap of how I viewed their long-term technical conditions as we approached the end of January:
- JPM - enjoying one of its best rallies in its long history
- BA - a move through 183 or so could really kick start the stock
- FFIV - new highs in place, but volume is tailing off with a negative divergence on weekly chart, may pause here
- MA - looking for next all-time high breakout
- GS - excellent uptrend in place
- FDX - tested 20-month EMA, 310 area is critical resistance until broken
- AAPL - has run into short-term selling, likely solid entry here
- CHRW - consolidating after 50% move higher in 2024
- JBHT - remains in lengthy consolidation period
- STX - great start to 2025, needs to clear resistance in 110-115 area
- HSY - brutal 25%+ drop over past 5-6 weeks, loves next few months historically
- DIS - after 6 weeks of selling, resuming strength the past week
- MSCI - continuing to trend higher, sights set on late-2021 and all-time high near 650
- SBUX - building bullish short-term momentum
- KRE - has received boost in 2025 as 10-year treasury yield ($TNX) topped and reversed
- ED - been weak, but long-term support remains intact
- AJG - one of most consistent and dependable uptrends off of pandemic low in 2020
- NSC - late stage cup with handle pattern on monthly chart, will likely lead to a solid 2025
- RHI - long-term price support is in 58-60 area, still looks solid as a long-term buy and hold
- ADM - remains in 2-year downtrend, could potentially reach key support from 40-43
- BG - continues to test key price support in the 75-80 range, monthly RSI at 40
- CVS - awesome response as buyers have poured in off of recent 43-44 price support test
- IPG - 3-year consolidation has stock in middle of its 15-month 26-32 price range
- HRL - bound between price support at 27.50 and 20-month EMA resistance at 33.07
- DE - broke out to new all-time highs recently, after its monthly PPO turned higher from near the zero line
Keep in mind that our Weekly Market Reports favor those who are more interested in the long-term market picture. Therefore, the list of stocks above are stocks that we believe are safer (but nothing is ever 100% safe) to own with the long-term in mind. Nearly everything else we do at EarningsBeats.com favors short-term momentum trading, so I wanted to provide an explanation of what we're doing with this list and why it's different.
Also, please keep in mind that I'm not a Registered Investment Advisor (and neither is EarningsBeats.com nor any of its employees) and am only providing (mostly) what I believe to be solid dividend-paying stocks for the long-term. Companies periodically go through adjustments, new competition, restructuring, management changes, etc. that can have detrimental long-term impacts. The stock price nor the dividend is ever guaranteed. I simply point out interesting stock candidates for longer-term investors. Do your own due diligence and please consult with your financial advisor before making any purchases or sales of securities.
Looking Ahead
Upcoming Earnings
Q4 earnings are in full gear and many of the biggest growth names have either just reported or are getting ready to. The following list of companies is NOT a list of all companies scheduled to report quarterly earnings, however, just key reports, so please be sure to check for earnings dates of any companies that you own. Any company in BOLD represents a stock in one of our portfolios and the amount in parenthesis represents the market capitalization of each company listed:
- Monday: None
- Tuesday: ANET ($106 billion), MDT ($119 billion), CDNS ($81 billion), OXY ($45 billion)
- Wednesday: ADI ($248 billion), GRMN ($41 billion)
- Thursday: WMT ($836 billion), BABA ($296 billion), BKNG ($167 billion), MELI ($107 billion)
- Friday: None
Key Economic Reports
- Monday: None
- Tuesday: February empire state manufacturing index, February housing index
- Wednesday: January housing starts & building permits, FOMC minutes
- Thursday: Initial jobless claims, February Philadelphia manufacturing index, January leading indicators
- Friday: February PMI composite flash, January existing home sales, February consumer sentiment
Historical Data
I'm a true stock market historian. I am absolutely PASSIONATE about studying stock market history to provide us more clues about likely stock market direction and potential sectors/industries/stocks to trade. While I don't use history as a primary indicator, I'm always very aware of it as a secondary indicator. I love it when history lines up with my technical signals, providing me much more confidence to make particular trades.
Below you'll find the next two weeks of historical data and tendencies across the 3 key indices that I follow most closely:
S&P 500 (since 1950)
- Feb 17: -31.56%
- Feb 18: +1.24%
- Feb 19: -26.20%
- Feb 20: -1.08%
- Feb 21: -53.60%
- Feb 22: +10.49%
- Feb 23: -34.99%
- Feb 24: +28.75%
- Feb 25: -8.95%
- Feb 26: +14.38%
- Feb 27: -59.91%
- Feb 28: -20.24%
- Mar 1: +78.25%
- Mar 2: +39.20%
NASDAQ (since 1971)
- Feb 17: -52.28%
- Feb 18: -13.59%
- Feb 19: -50.81%
- Feb 20: -19.32%
- Feb 21: -111.19%
- Feb 22: -11.55%
- Feb 23: -35.59%
- Feb 24: +64.89%
- Feb 25: +15.15%
- Feb 26: +17.68%
- Feb 27: -94.81%
- Feb 28: -28.53%
- Mar 1: +132.23%
- Mar 2: +8.14%
Russell 2000 (since 1987)
- Feb 17: -66.49%
- Feb 18: -39.52%
- Feb 19: -23.58%
- Feb 20: -61.33%
- Feb 21: -115.99%
- Feb 22: -1.86%
- Feb 23: -65.05%
- Feb 24: +76.34%
- Feb 25: +20.01%
- Feb 26: +30.84%
- Feb 27: -57.46%
- Feb 28: -63.92%
- Mar 1: +146.28%
- Mar 2: -1.57%
The S&P 500 data dates back to 1950, while the NASDAQ and Russell 2000 information date back to 1971 and 1987, respectively.
Final Thoughts
Our major indices are battling overhead price resistance as they consolidate and search for short-term direction. Here are a few things I'll be watching this week:
- Seasonality. The February calendar has flipped to the 2nd half of Q1 (February 16 through March 31). While the stock market may do whatever it wants to do, the long-term tendency is for our major indices to struggle a bit more over the next 6 weeks or so.
- Key Price Resistance. The S&P 500 is on the doorstep to more all-time highs. Given that we remain in a long-term secular bull market, a breakout would be difficult to bet against - at least until a major price reversal were to take place.
- Earnings. There will still be a few key earnings reports out this week, but the overwhelming majority of the S&P 500 has now reported its latest quarterly results.
- Leadership. Any time we're talking about breaking out to new all-time highs, it's important to evaluate leadership. Not every all-time high looks the same. Should we move into all-time high territory and a significant shift towards defensive stocks takes place (think 2021/2022), it can be an important warning sign.
- Technology (XLK). Like our major indices, the XLK is flirting with all-time highs. This is a very important and aggressive area of the stock market and it represents more than 30% of the S&P 500. I believe our biggest clue of all is likely to come from this group. Do we make a key breakout here or are we possibly double-topping?
Happy trading!
Tom