
EB Weekly Market Report - Monday, March 10, 2025
ChartLists Updated
The following ChartLists were updated over the weekend:
- Strong Earnings (SECL) - last 70 or so have not been annotated, but should be over next day or two
- Strong Future Earnings (SFECL)
- Raised Guidance (RGCL)
- Strong AD (SADCL)
- Bullish Trifecta (BTCL)
- Short Squeeze (SSCL)
- March Seasonality (SEASCL)
- Upcoming Earnings
- Upcoming Earnings - Relative Strength
These ChartLists, except the SEASCL, are available to download into your StockCharts Extra or Pro account, if you have a StockCharts membership. The SEASCL should be available for download later today or tomorrow morning. Otherwise, we can send you an Excel file with the stocks included in these ChartLists in order to download them into other platforms. If you have any questions, please reach out to us at "[email protected]".
Weekly Market Recap
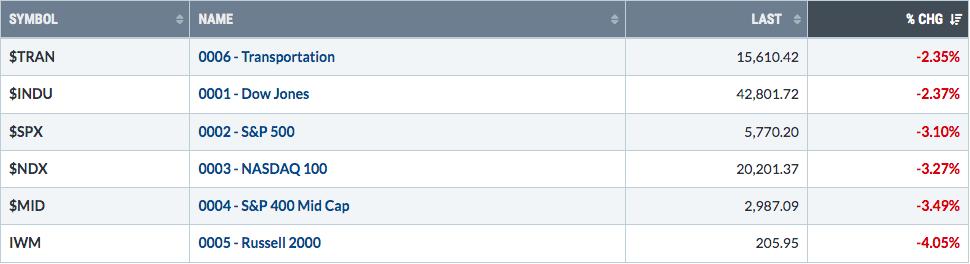
Major Indices
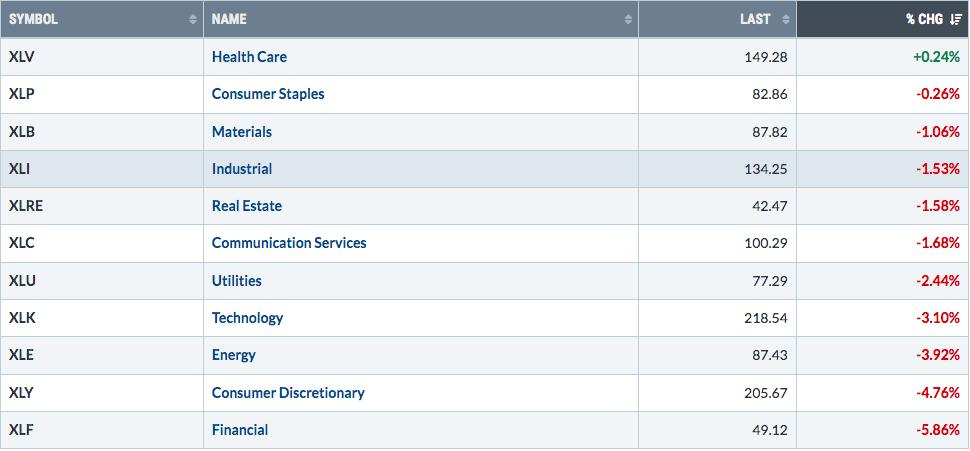
Sectors
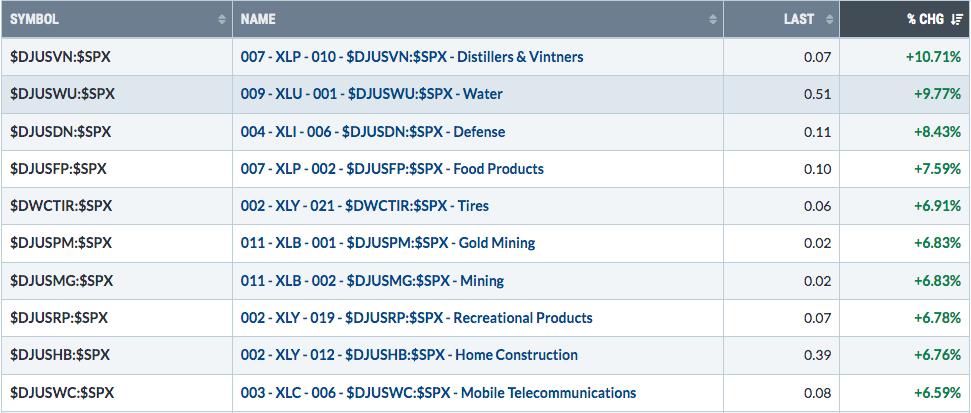
Top 10 Industries Last Week
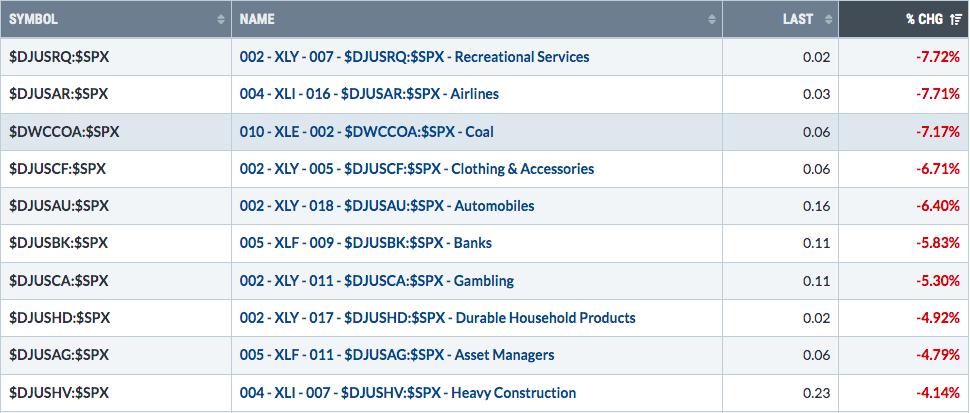
Bottom 10 Industries Last Week
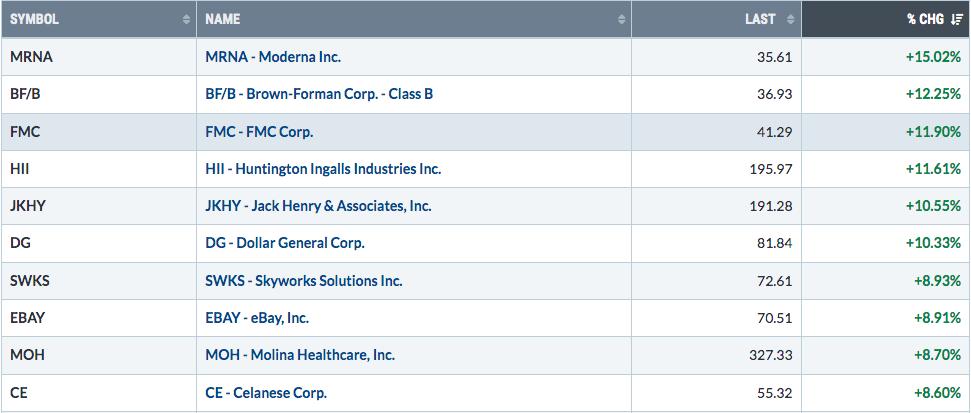
Top 10 Stocks - S&P 500/NASDAQ 100
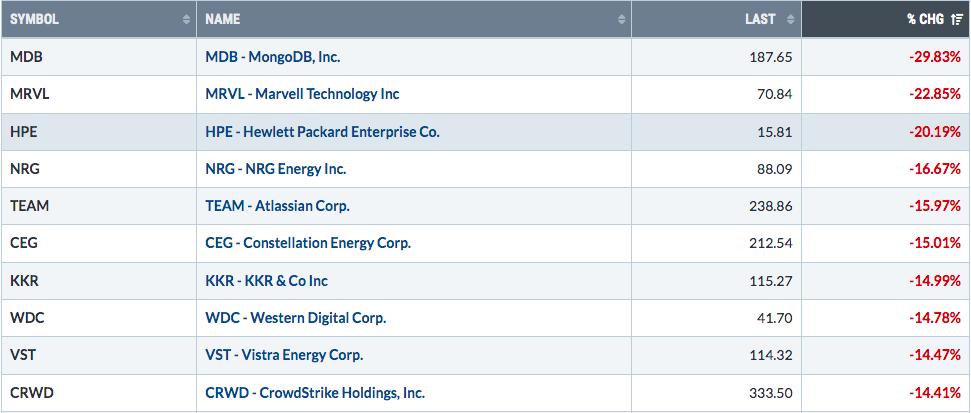
Bottom 10 Stocks - S&P 500/NASDAQ 100
Big Picture
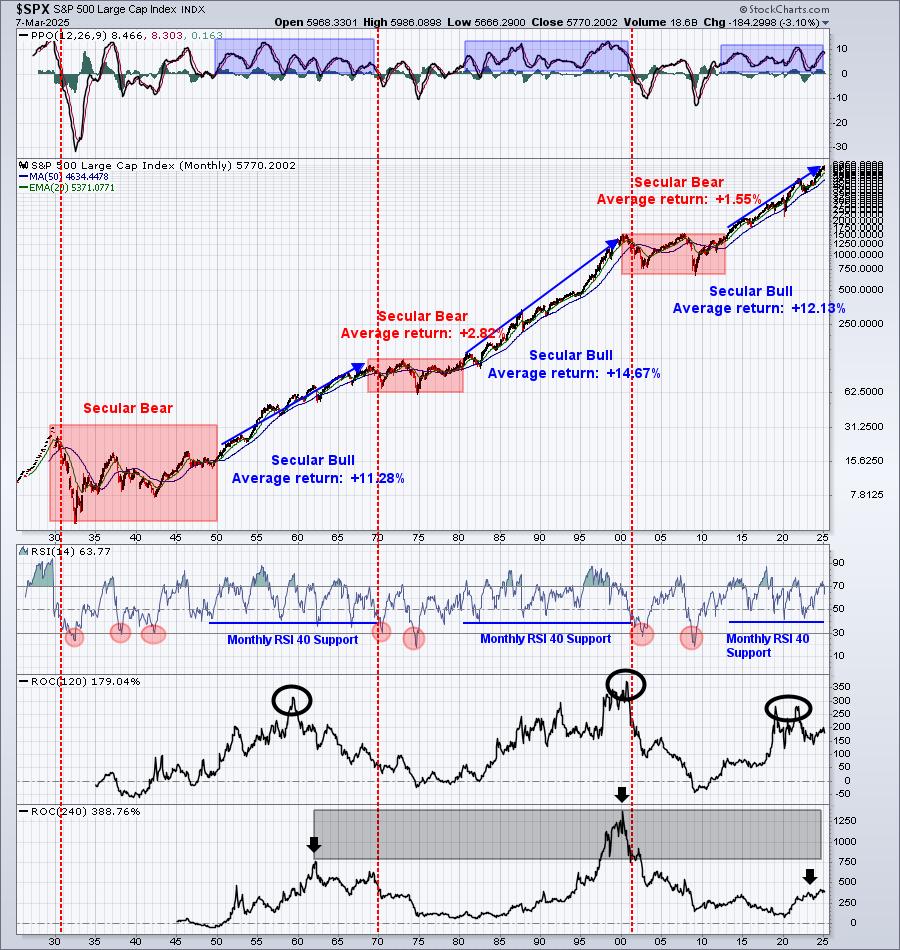
It's been a pretty rough period over the past 2-3 weeks, but that weakness isn't even recognizable on this Big Picture chart. It looks like the monthly PPO has begun to turn a bit lower, but nothing to be alarmed about.
Sustainability Ratios
Here's the latest look at our key intraday ratios as we follow where the money is traveling on an INTRADAY basis (ignoring gaps):
QQQ:SPY
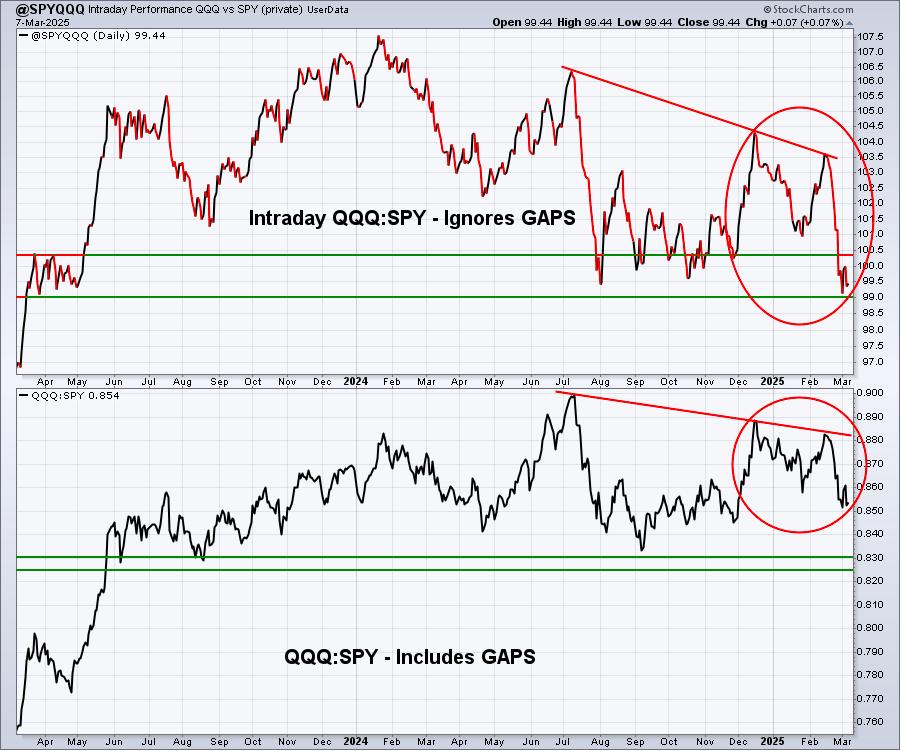
I pointed out last week that the continuing deterioration here is not good and that we should remain very cautious. The selling then continued this past week and this chart, quite honestly, doesn't look any better. If anything, it's getting worse.
IWM:QQQ
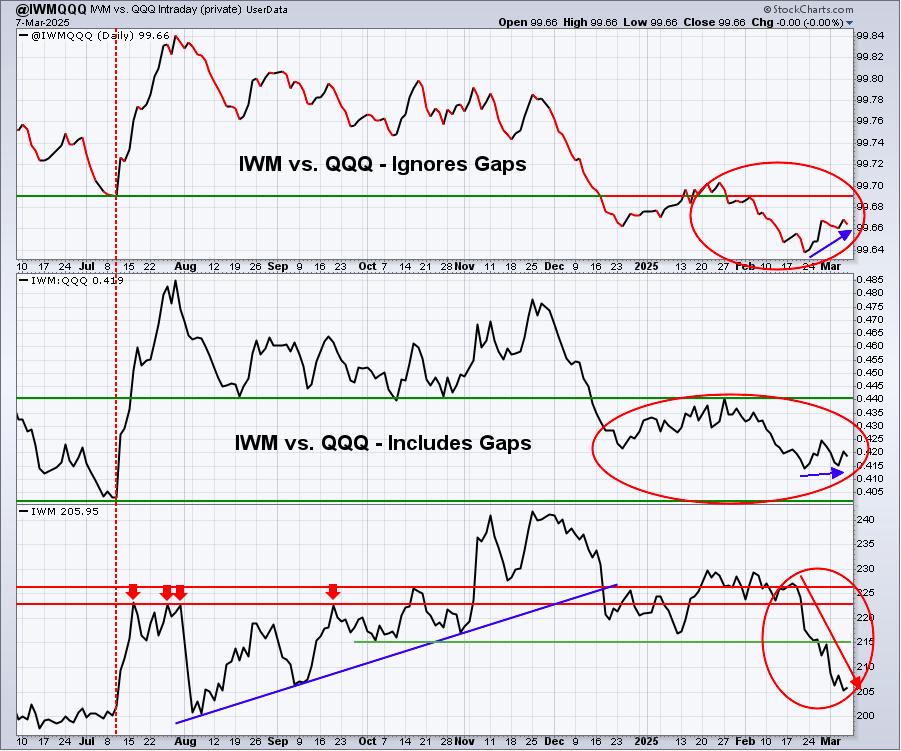
There's been a bit of improvement in terms of intraday rotation into small caps, but we're going to need to see much more in order to turn bullish on this asset class again. Perhaps the inflation report this week will be better than expected.
XLY:XLP
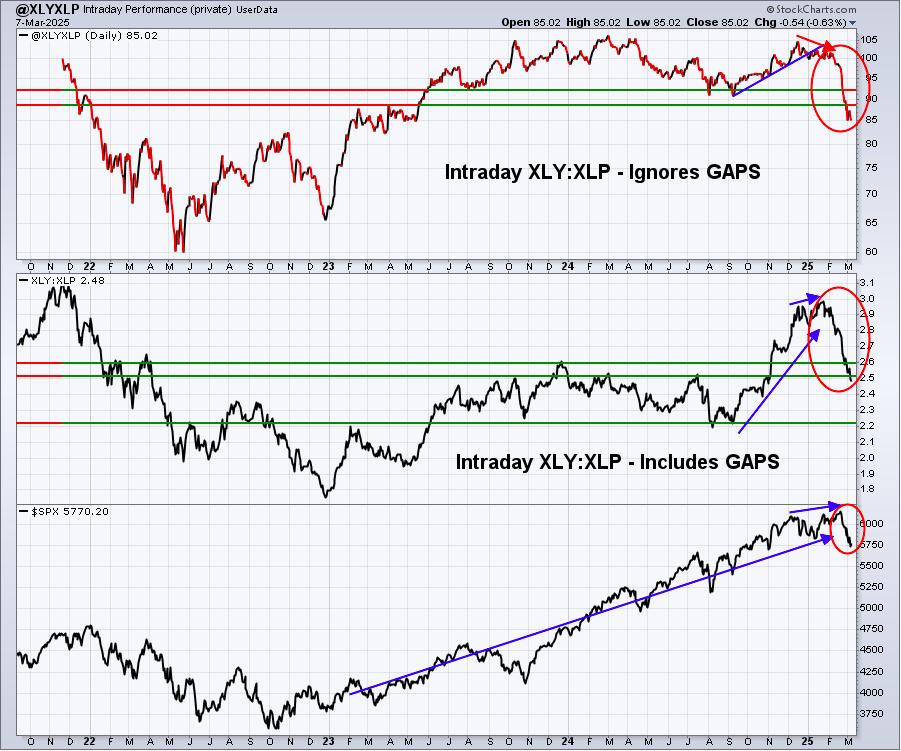
This is one of the worst signals right now, in my opinion. There's such a tight long-term positive correlation between this XLY:XLP ratio and the benchmark S&P 500, so it's unsettling to see such a severe drop in the consumer discretionary sector. It reeks of a weakening economy.
Sentiment
5-day SMA ($CPCE)
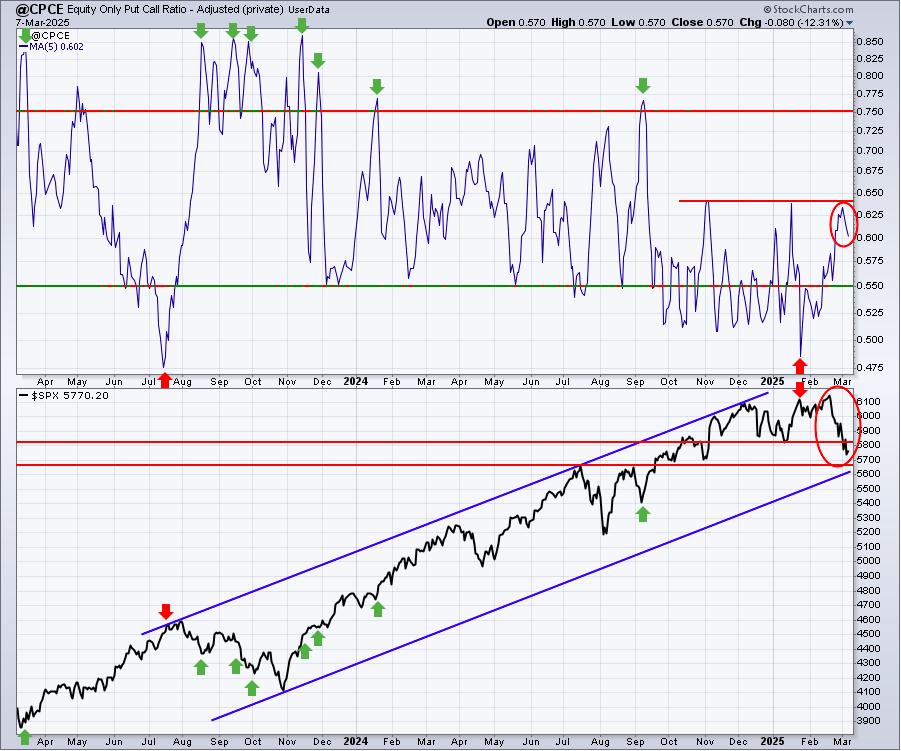
Sentiment indicators are contrarian indicators. When they show extreme bullishness, we need to be a bit cautious and when they show extreme pessimism, it could be time to become much more aggressive. Major market bottoms are carved out when pessimism is at its absolute highest level.
One reason why the stock market was down so much today could be attributable to the 5-day SMA of the CPCE, which actually FELL last week, which is MORE BULLISH, despite the rapidly-declining indices. We want to see this 5-day SMA rise to .75 or higher in order to mark a more definitive top. Last week, it actually headed in the opposite direction....lower.
253-day SMA ($CPCE)
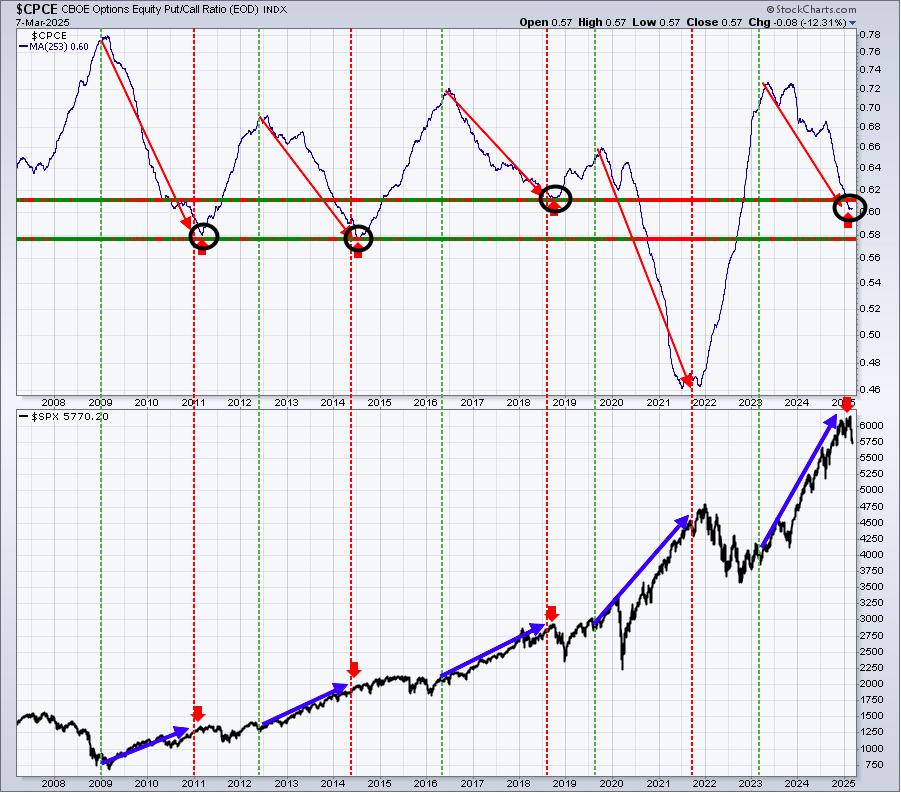
We're seeing as much hesitation in this 253-day SMA downtrend as we've seen in several months. It's probably too early to draw any sort of conclusion about the long-term and whether this current bearish phase escalates over the summer, but it is worth noting.
Volatility ($VIX)
Here's the current view of the VIX:
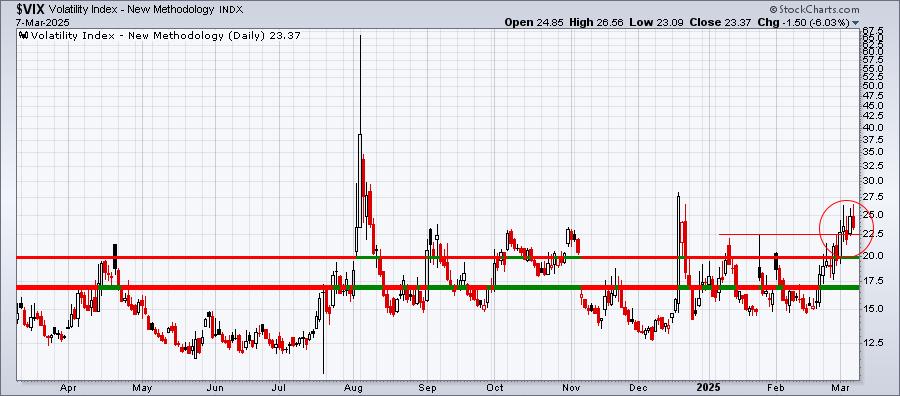
I mentioned the following last week: Folks, this is extreme danger territory. It's a point where 5-6% losses on the S&P 500 could become a 10% loss overnight. The good news is that when the VIX tops and rolls over, the worst will likely be behind us. Of course, we'll want to confirm this based on market rotation and price action. But RIGHT NOW, it's extremely important for short-term traders to be careful. When the VIX is in the mid-20s and rising, rational trading behavior can be thrown right out the window. Technical trading rules like price support holding, or moving averages providing support, can and should be ignored.
Literally, the S&P 500 is down another 3% today, doing EXACTLY what I suggested could happen last week. All of a sudden, a little hiccup turns into a correction. And if we blink a few more times, it could morph into a cyclical bear market. I'm still not certain that'll be the case on the S&P 500, the Russell 200o ETF (IWM) is closing in on a 20% drop since its all-time high was set in Q4 2024.
U.S. vs. International
The international market environment is changing and I just want to point that out. The following relative chart shows how the U.S. has been performing vs. Germany over the past year. That chart is followed by a 10-year relative chart highlighting the same relationship:
1-Year Daily
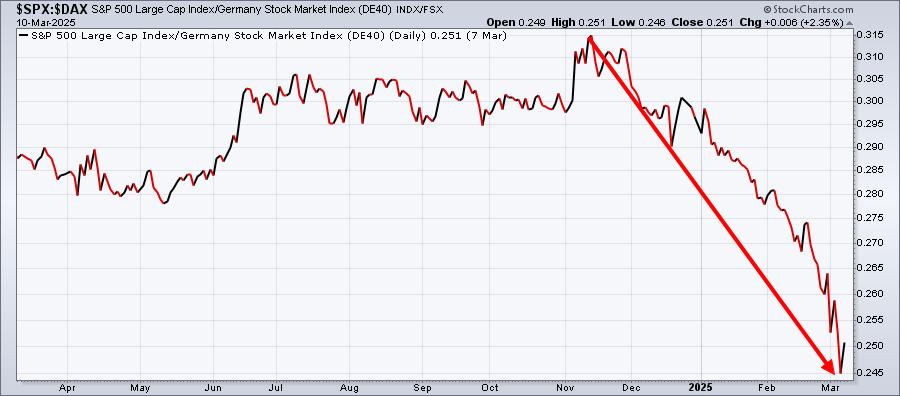
That's a MASSIVE decline. Does it change the long-term trend, though? You decide....
10-Year Weekly
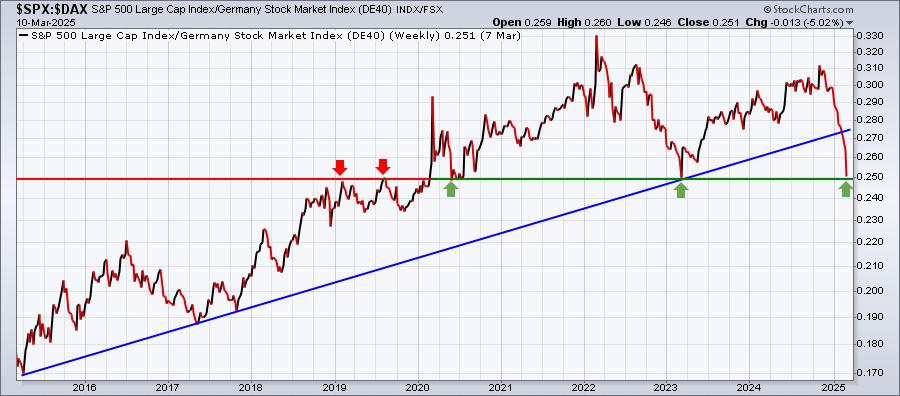
I think we're just now testing a key relative price support level at 0.25. If that support level is lost, that would represent a 5-year relative low on the S&P 500 vs. the German DAX. It would be hard to argue that a long-term uptrend remained in play.
I'd expect to at least see a bounce from here - on a relative basis. That doesn't mean the S&P 500 has to go screaming higher. It simply means it would have to perform better than the DAX in the near-term.
Long-Term Trade Setup
Since beginning this Weekly Market Report in September 2023, I've discussed the long-term trade candidates below that I really like. Generally, these stocks have excellent long-term track records and many pay nice dividends that mostly grow every year. Only in very specific cases (exceptions) would I consider a long-term entry into a stock that has a poor or limited long-term track record and/or pays no dividends. Below is a quick recap of how I viewed their long-term technical conditions as of two weeks ago:
- JPM - pulling back recently, but a well-deserved break after a very strong 2024
- BA - improving, but only has 2-3 daily closes above 190 in last 11 months, so watch this key resistance level
- FFIV - eliminated recent weekly negative divergence, but taking a breather
- MA - remains near an all-time high
- GS - difficult end to last week, but long-term trend remains very bullish
- FDX - trending lower last couple months, I believe support in the 220-240 area will hold
- AAPL - long-term uptrend is solid
- CHRW - failed to sustain breakout above August 2022 high, hoping to see 95 support hold
- JBHT - remains in lengthy consolidation period, has not closed below 150 in 4 years
- STX - unable to clear resistance in 110-115 area, consolidating in bullish fashion
- HSY - very strong rebound after brutal 6-month stretch where it dropped 30%
- DIS - in uptrend, but won't get significant confirmation until it clears 120-125 range
- MSCI - approached all-time high in December, but has backed off a bit
- SBUX - very nice rally near all-time high since announcing new CEO from Chipotle (CMG)
- KRE - in solid 21-month uptrend, but Fed's pausing of rate cuts having recent negative impact
- ED - rallying back near all-time high, loves March, where it's risen 8 of last 9 years
- AJG - continues one of most consistent and dependable uptrends, now at all-time high
- NSC - still in long period (3+ years) of consolidation
- RHI - weak in 2025, back to testing multi-year low near 60 level
- ADM - recently hit 44.42, close to critical long-term price support in the 40-43 range; bouncing
- BG - printing monthly hammer, so far holding 65-70 long-term price support
- CVS - very nice bounce off 44-45 support to open its 2025 campaign
- IPG - 3-year consolidation has stock at lower end of its 16-month 26-32 price range
- HRL - still bound between price support at 27.50 and 20-month EMA resistance at 32.63
- DE - still like the turn higher off its recent monthly PPO centerline test; uptrend in play
Keep in mind that our Weekly Market Reports favor those who are more interested in the long-term market picture. Therefore, the list of stocks above are stocks that we believe are safer (but nothing is ever 100% safe) to own with the long-term in mind. Nearly everything else we do at EarningsBeats.com favors short-term momentum trading, so I wanted to provide an explanation of what we're doing with this list and why it's different.
Also, please keep in mind that I'm not a Registered Investment Advisor (and neither is EarningsBeats.com nor any of its employees) and am only providing (mostly) what I believe to be solid dividend-paying stocks for the long-term. Companies periodically go through adjustments, new competition, restructuring, management changes, etc. that can have detrimental long-term impacts. The stock price nor the dividend is ever guaranteed. I simply point out interesting stock candidates for longer-term investors. Do your own due diligence and please consult with your financial advisor before making any purchases or sales of securities.
Looking Ahead
Upcoming Earnings
Q4 earnings are in full gear and many of the biggest growth names have either just reported or are getting ready to. The following list of companies is NOT a list of all companies scheduled to report quarterly earnings, however, just key reports, so please be sure to check for earnings dates of any companies that you own. Any company in BOLD represents a stock in one of our portfolios and the amount in parenthesis represents the market capitalization of each company listed:
- Monday: ORCL ($422 billion)
- Tuesday: None
- Wednesday: ADBE ($194 billion)
- Thursday: DG ($17 billion), ULTA ($16 billion), DOCU ($16 billion)
- Friday: LI ($29 billion)
Key Economic Reports
- Monday: None
- Tuesday: January JOLTS
- Wednesday: February CPI
- Thursday: Initial jobless claims, February PPI
- Friday: March consumer sentiment
Historical Data
I'm a true stock market historian. I am absolutely PASSIONATE about studying stock market history to provide us more clues about likely stock market direction and potential sectors/industries/stocks to trade. While I don't use history as a primary indicator, I'm always very aware of it as a secondary indicator. I love it when history lines up with my technical signals, providing me much more confidence to make particular trades.
Below you'll find the next two weeks of historical data and tendencies across the 3 key indices that I follow most closely:
S&P 500 (since 1950)
- Mar 10: +41.86%
- Mar 11: +36.59%
- Mar 12: -32.40%
- Mar 13: +44.60%
- Mar 14: -22.51%
- Mar 15: +65.38%
- Mar 16: +32.01%
- Mar 17: +85.33%
- Mar 18: +41.45%
- Mar 19: -30.05%
- Mar 20: -9.56%
- Mar 21: -12.87%
- Mar 22: -25.58%
- Mar 23: +32.57%
NASDAQ (since 1971)
- Mar 10: +42.11%
- Mar 11: +28.82%
- Mar 12: -82.06%
- Mar 13: +116.54%
- Mar 14: -27.83%
- Mar 15: +3.76%
- Mar 16: -8.26%
- Mar 17: +97.19%
- Mar 18: +47.15%
- Mar 19: -16.76%
- Mar 20: -65.89%
- Mar 21: +13.36%
- Mar 22: -6.61%
- Mar 23: +38.54%
Russell 2000 (since 1987)
- Mar 10: +10.07%
- Mar 11: +11.23%
- Mar 12: -78.21%
- Mar 13: +92.54%
- Mar 14: -60.62%
- Mar 15: -22.48%
- Mar 16: -89.92%
- Mar 17: +159.72%
- Mar 18: +15.67%
- Mar 19: +27.99%
- Mar 20: -75.34%
- Mar 21: +29.93%
- Mar 22: -102.39%
- Mar 23: +13.92%
The S&P 500 data dates back to 1950, while the NASDAQ and Russell 2000 information date back to 1971 and 1987, respectively.
Final Thoughts
We've moved quickly from a market where we needed to be cautious to a market that's in near free-fall. But our below-the-surface signals do not lie. I'm not saying they work every time, but hopefully you can see now why I grow so cautious when certain warning signals begin to flash.
- Rotation. Money continues to rotate in bearish fashion. Simply put, that needs to change.
- Inflation. We have two key inflation reports out this week. First, on Wednesday, we'll get the latest CPI numbers, then on Thursday, it'll be the PPI.
- Sentiment. When the market begins to selloff quickly and the VIX accelerates through 20, or even 30, to the upside, history tells us that "impulsive" selling can take over. Impulsive selling is what ruins portfolios and turns market "believers" into "I don't ever want to own another stock again....EVER!" To ultimately mark a major stock market bottom, we may need the pessimism and fear to grow and the 5-day SMA of the CPCE to hit .75 or higher.
- The Fed. They don't meet until next week, but they're going to be in the news, for sure.
Happy trading!
Tom