
EB Weekly Market Report - Monday, March 24, 2025
ChartLists Updated
The following ChartLists were updated over the weekend:
- Strong Earnings (SECL)
- Strong Future Earnings (SFECL)
- Raised Guidance (RGCL)
- Bullish Trifecta (BTCL)
- Short Squeeze (SSCL)
These ChartLists are available to download into your StockCharts Extra or Pro account, if you have a StockCharts membership. Otherwise, we can send you an Excel file with the stocks included in these ChartLists in order to download them into other platforms. If you have any questions, please reach out to us at "[email protected]".
Weekly Market Recap
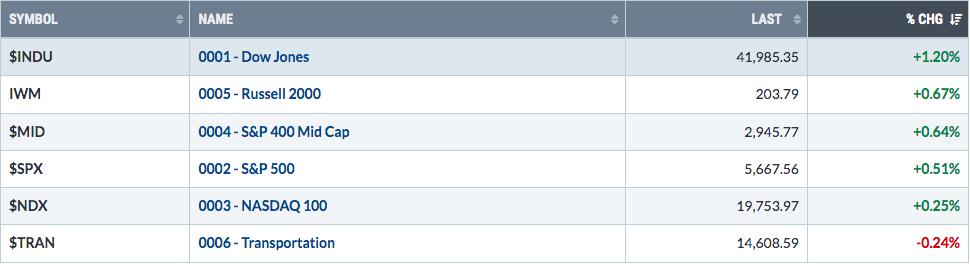
Major Indices
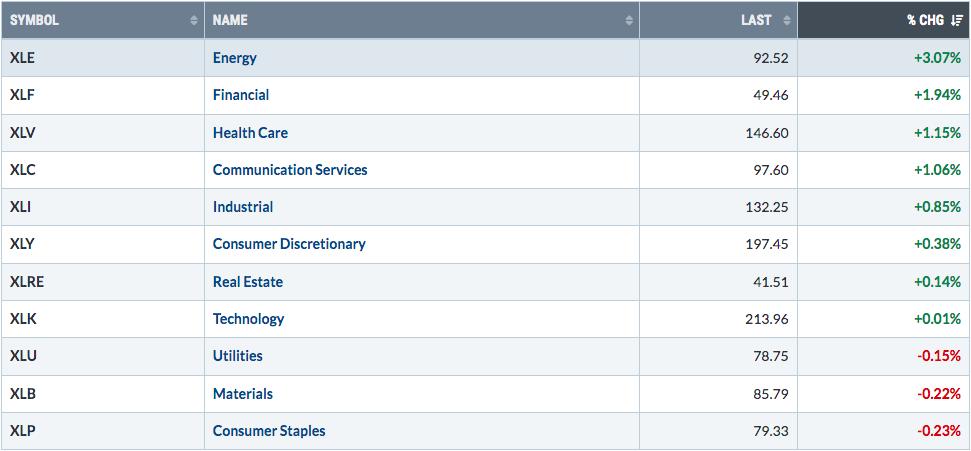
Sectors
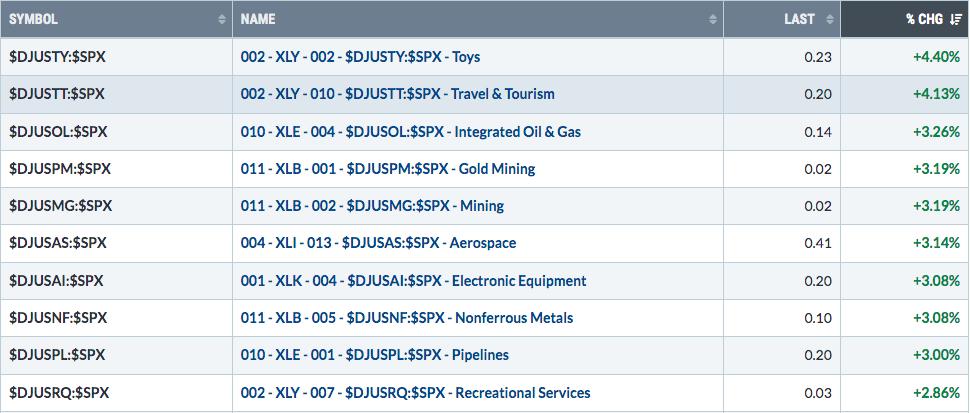
Top 10 Industries Last Week
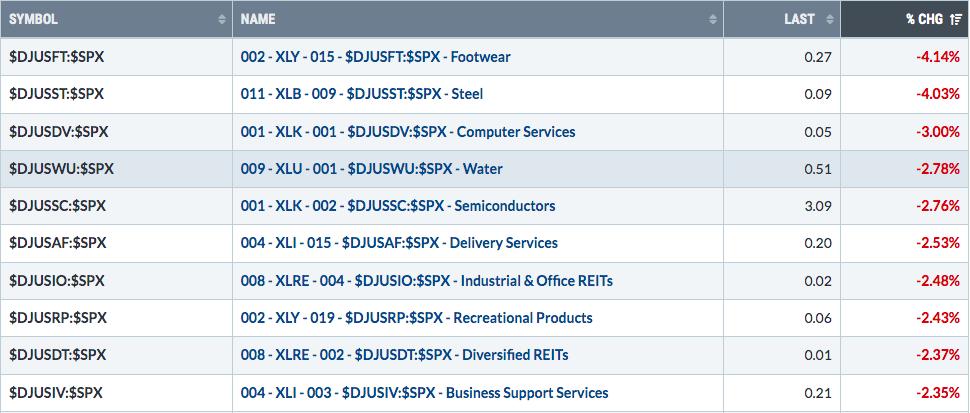
Bottom 10 Industries Last Week
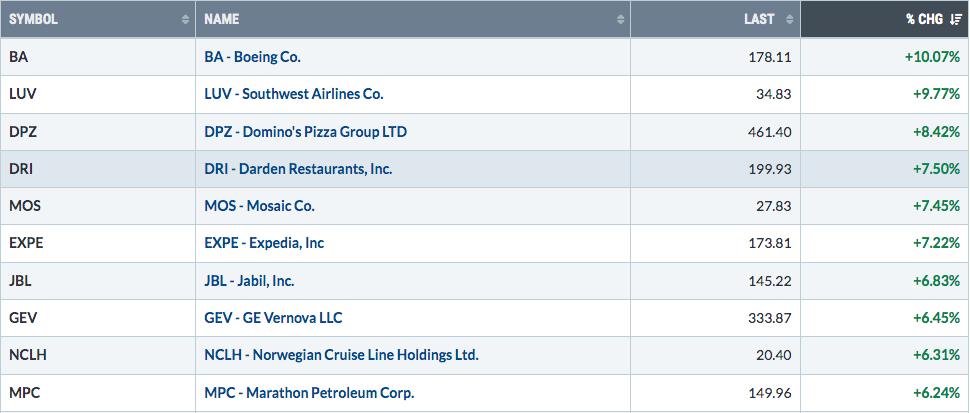
Top 10 Stocks - S&P 500/NASDAQ 100
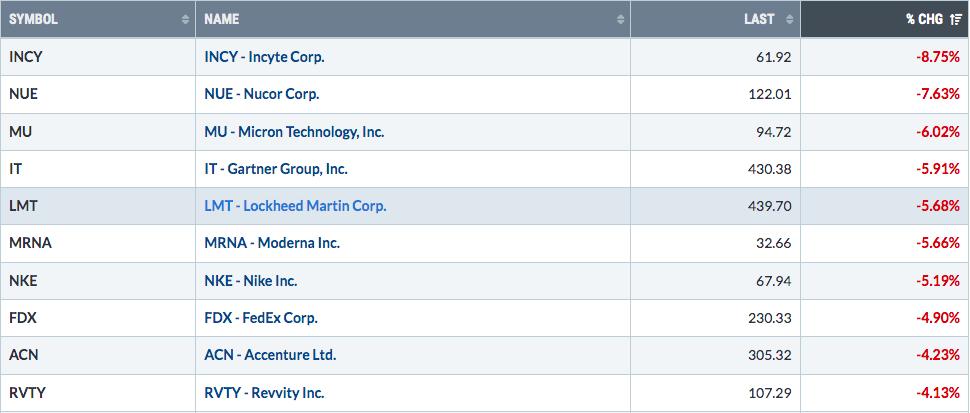
Bottom 10 Stocks - S&P 500/NASDAQ 100
Big Picture
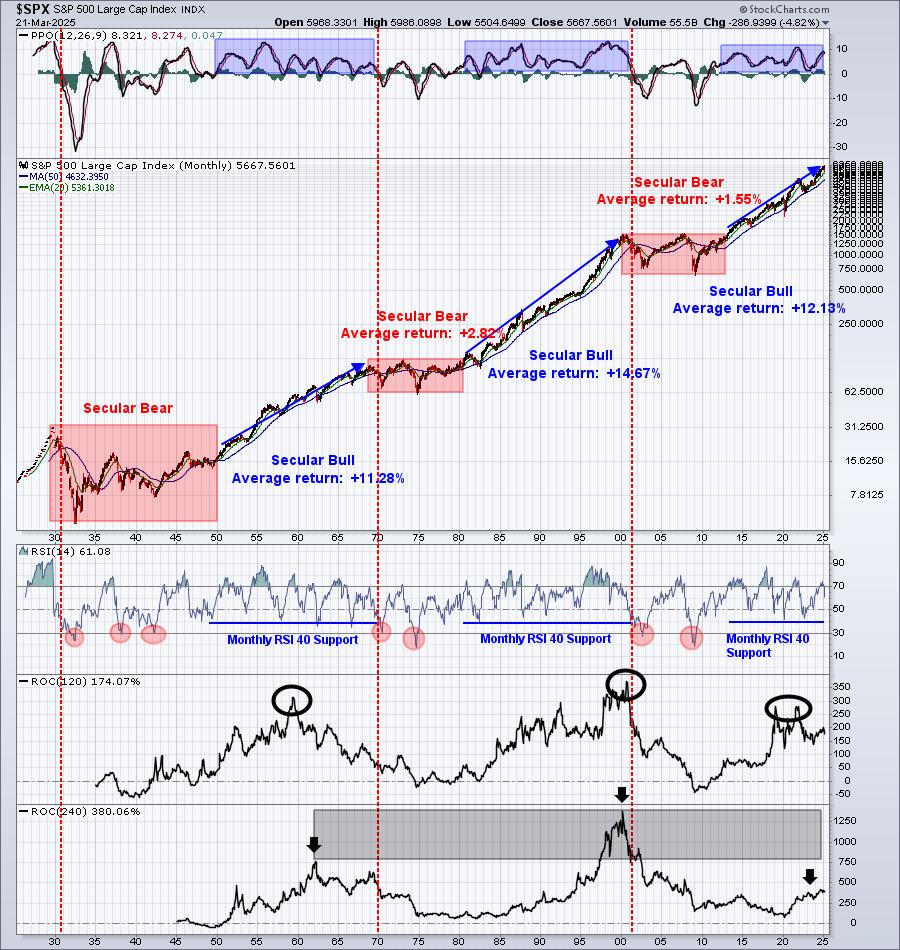
Listen, I know all the current events and how many media outlets are ready to call their next BIG BAD BEAR MARKET. If you've done this as long as I have, that part of this job never changes. There is ALWAYS a crisis that will tear down the U.S. stock market and there are always the "well, this time is different" folks that will try to convince everyone that we're doomed. How much attention do I pay to this constant rhetoric? ZERO. I follow the charts. Secular bull markets take this "doom and gloom" media BS in stride, occasionally pausing in a correction or cyclical bear market, but with the ultimate direction higher. Do you think we had no problems in the 1980s and 1990s? It was littered with the doom and gloom folks and you can see from this Big Picture chart that price action really never hesitated for long before new highs were reached.
We're in the midst of another secular bull market and the same is happening now. Most investors, however, don't consider long-term perspective. Instead, they try to call the market based on the "news" of the day. <sarcasm>
If you want an unbiased, objective source of stock market analysis, you've found the place right here at EarningsBeats.com. We remain in a secular bull market. Please don't forget that, despite all the short-term noise that we listen to every day. The truth (price action) will set us free.
Sustainability Ratios
Here's the latest look at our key intraday ratios as we follow where the money is traveling on an INTRADAY basis (ignoring gaps):
QQQ:SPY
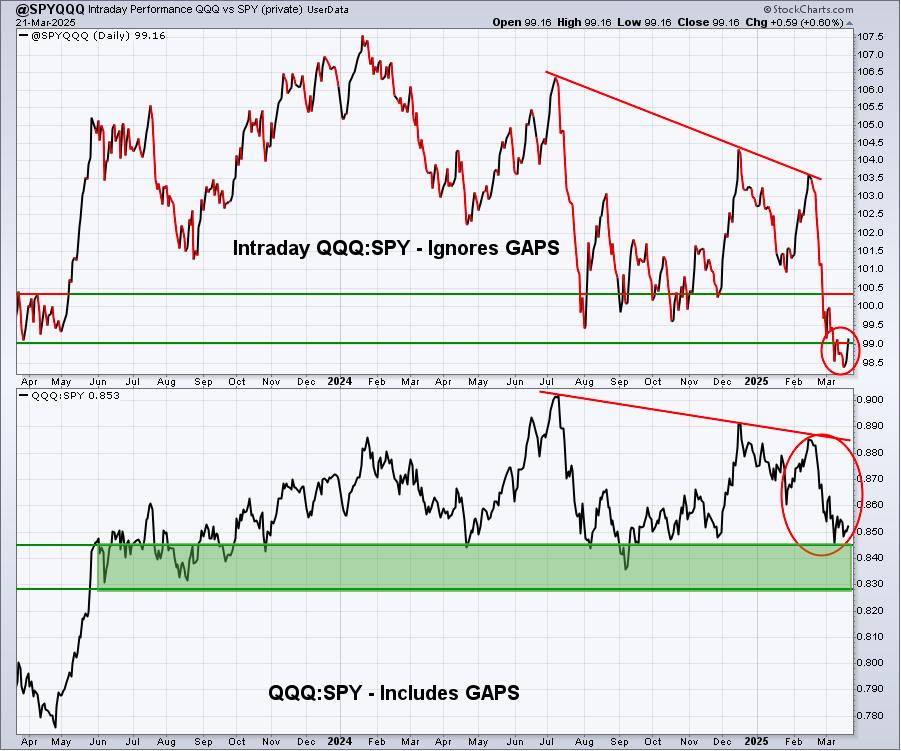
The only good news here is that it appears that the more growth-oriented NASDAQ has finally printed a relative bottom - at least in the near-term. I'll be watching this relative performance very closely this week as it could provide us important clues as we approach Q2.
IWM:QQQ
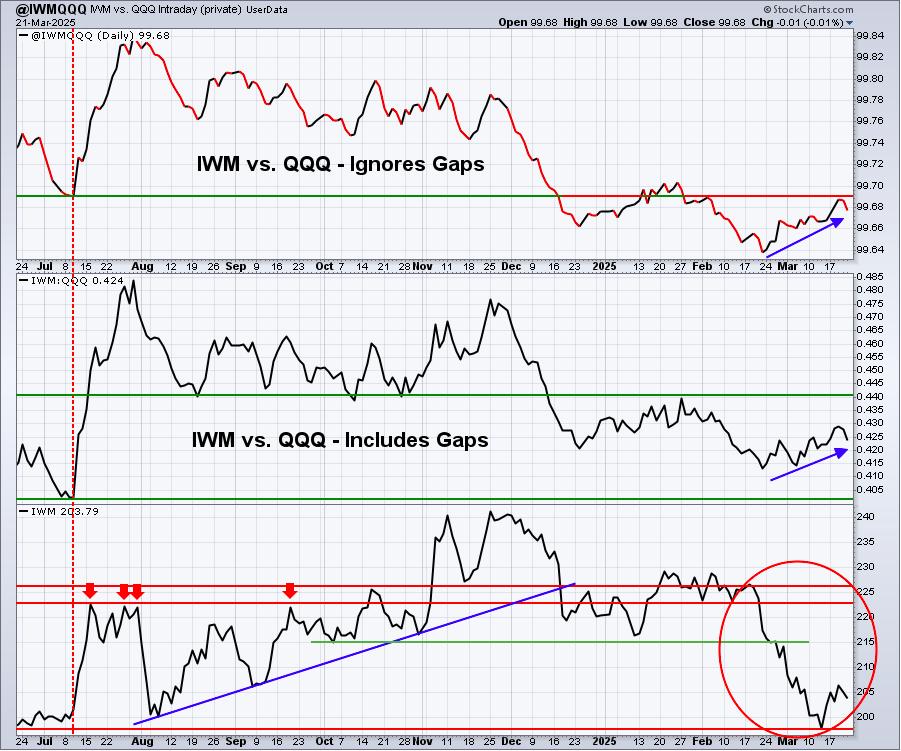
We saw this small cap vs. large cap ratio turn lower in the second half of the week. I still see a short-term uptrend, but the small cap bulls will need to show up fighting next week to maintain their recent bullish bias. Continuing improvement here would signal that Wall Street still believes rate cuts are coming, and likely much sooner than the Fed is suggesting. Unfortunately, the opposite is true if this ratio breaks beneath recent lows.
XLY:XLP
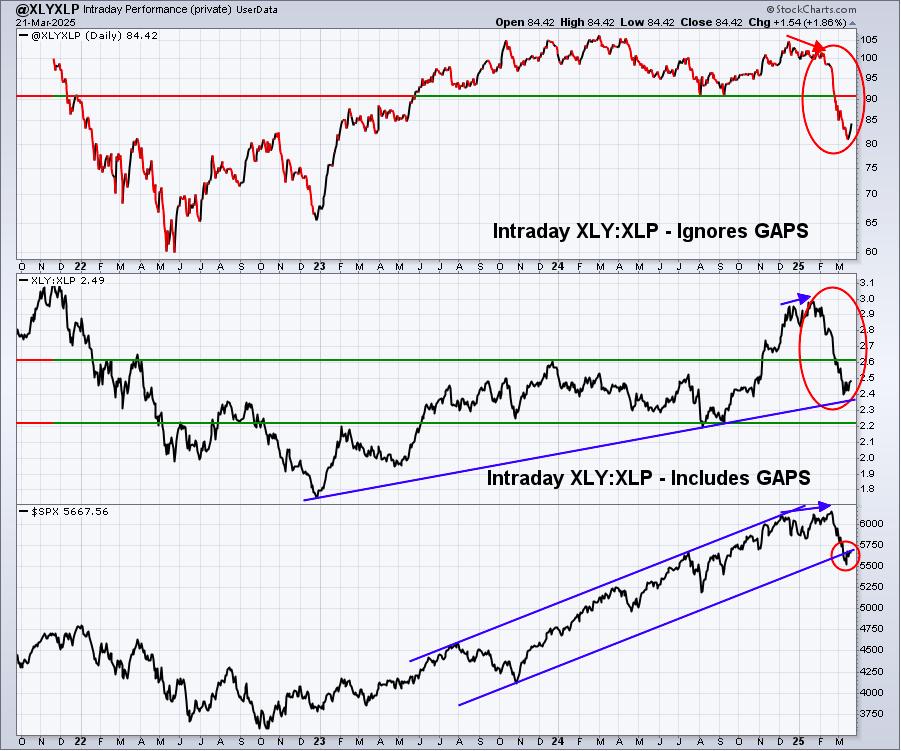
This chart was the biggest positive of last week. Perhaps it had more to do with options expiration than anything, but at this point, I'll take it. We've now established two lows that will be quite important to hold as we move forward. The middle panel shows an XLY:XLP low (including gaps) at 2.40 and the top panel shows an XLY:XLP low of roughly 81. It's hard for me to imagine these lows breaking down, while the S&P 500 moves higher. Another set of lows on these two panels would argue for a potential recession ahead.
Sentiment
5-day SMA ($CPCE)
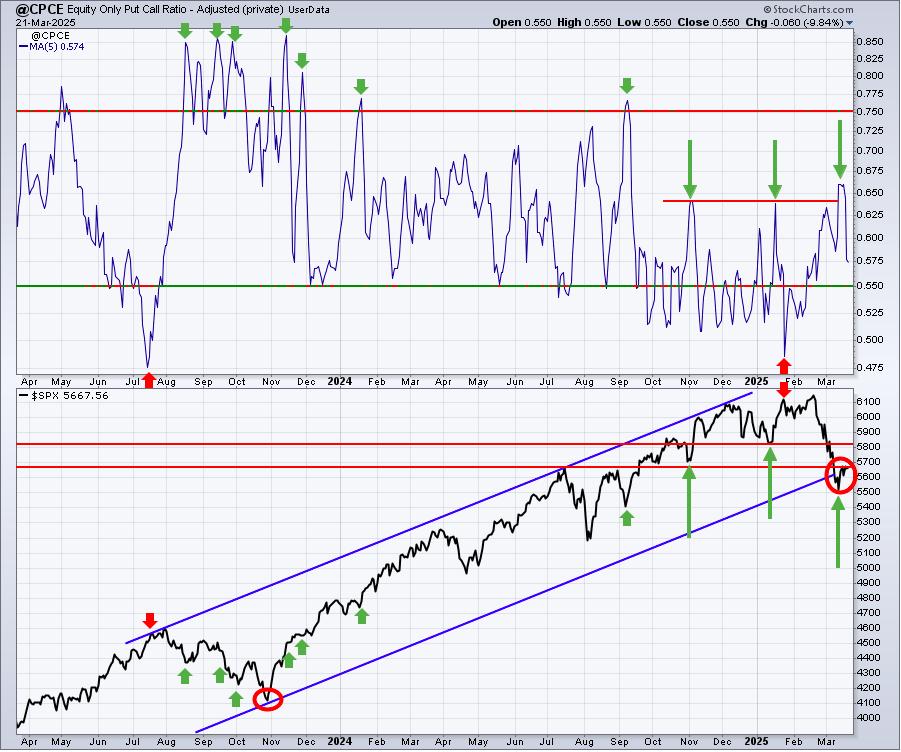
Sentiment indicators are contrarian indicators. When they show extreme bullishness, we need to be a bit cautious and when they show extreme pessimism, it could be time to become much more aggressive. Major market bottoms are carved out when pessimism is at its absolute highest level.
When an elevated Volatility Index ($VIX) sends a signal that we could see pain ahead, which is exactly the message sent recently as the VIX approached 30, I usually turn my attention to a rising 5-day SMA of the equity-only put-call ratio ($CPCE) to help identify market bottoms. Once the stock market turns emotionally and begins to show fear and panic, key price support levels tend to fail and a high reading in the VIX, combined with a huge reversal on the S&P 500 (think capitulation), usually are typical ingredients to establish a key bottom.
The CPCE has definitely risen in recent weeks, but quite honestly, it hasn't come close to the high readings that I'm looking for. We should see a 5-day SMA of at least .75 to be comfortable that fear has reached a level high enough for greedy Wall Street firms to buy stocks dirt cheap. While the recent spike in the 5-day SMA of the CPCE was nice (reaching .66), I don't believe it was enough.
253-day SMA ($CPCE)
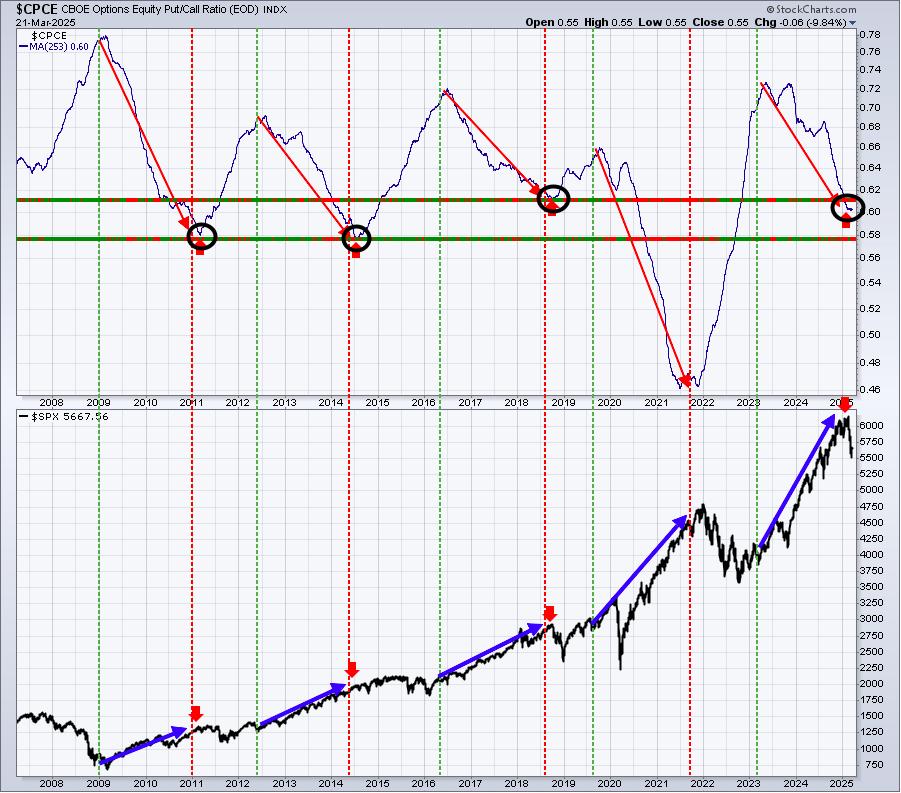
The 253-day SMA of the CPCE is trying to turn higher. It should be easy, given the selloff in stocks, but options traders are still remaining somewhat bullish, even in this volatile environment. It may take more believers in put options to help us find a market bottom.
Volatility ($VIX)
Here's the current view of the VIX:
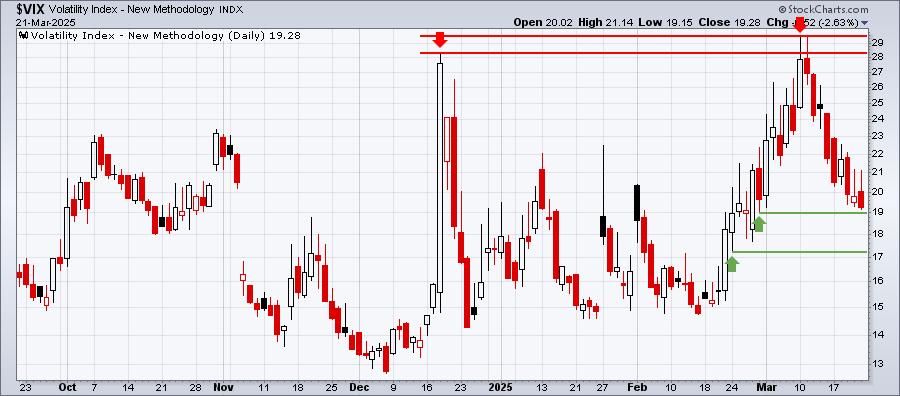
The VIX has provided us nice clues recently. The move through 20 saw accelerated selling in the S&P 500, as we would normally expect. I also mentioned last week that our biggest test would likely be on a VIX drop to 20 or just beneath it after the Fed policy statement and that's exactly where we are now. The current market environment is fairly similar to March 2022. The stock market was under intense pressure during that cyclical bear market, yet we saw a nice bounce in the 2nd half of March - first with monthly options expiration and that strength continued for another week before the bears regained control. I don't know if we see an exact duplicate of 2022, but I certainly wouldn't be surprised to see another downturn in U.S. equities after the current strength comes to an end.
Next week should be interesting.
Our Major Indices
Is it possible that this is a V-bottom, meaning that price action goes straight down and then straight back up to form a V? Listen, if you've followed the stock market for several decades, as I have, then you know ANYTHING is possible. So I won't rule out a V-bottom. But I just don't see it happening without a major shift from the Fed. There's simply too much uncertainty right now and if there's one thing that the stock market absolutely loathes, it's uncertainty. There's a reason I suggested we would likely see a challenging Q1, and possibly even a 10% correction, back in early January. It was mostly due to all the uncertainty that we were likely to experience.
I don't know about anyone else, but is it any clearer now for you than it was 2 months ago? Nearly every economic report coming out shows weakness and numbers below expectations. The housing market has been an utter mess. There's no way to accurately predict company earnings and those companies' valuations when there's uncertainty if or when interest rates will be cut again by the Fed. Discounting future earnings is paramount to obtaining a reasonable valuation. If we don't know if a recession is coming, even if it's mild, how can you forecast earnings and earnings growth with any accuracy? And with a Fed that literally just said the economy and inflation are uncertain moving forward, what interest rate should be used to discount those earnings that you're not sure of? Wall Street is not going to price equities with a premium when they don't have clarity as to future earnings and interest rates.
So we'll just have to muddle on with the knowledge that it's unlikely that we'll see a V-bottom.
We've seen a lot of technical damage in our major indices, especially with the Mag 7 stocks performing so poorly. Here's a 6-month chart of the S&P 500 and NASDAQ 100, with the Mag 7 stocks relative performance vs. the benchmark S&P 500 shown as well:
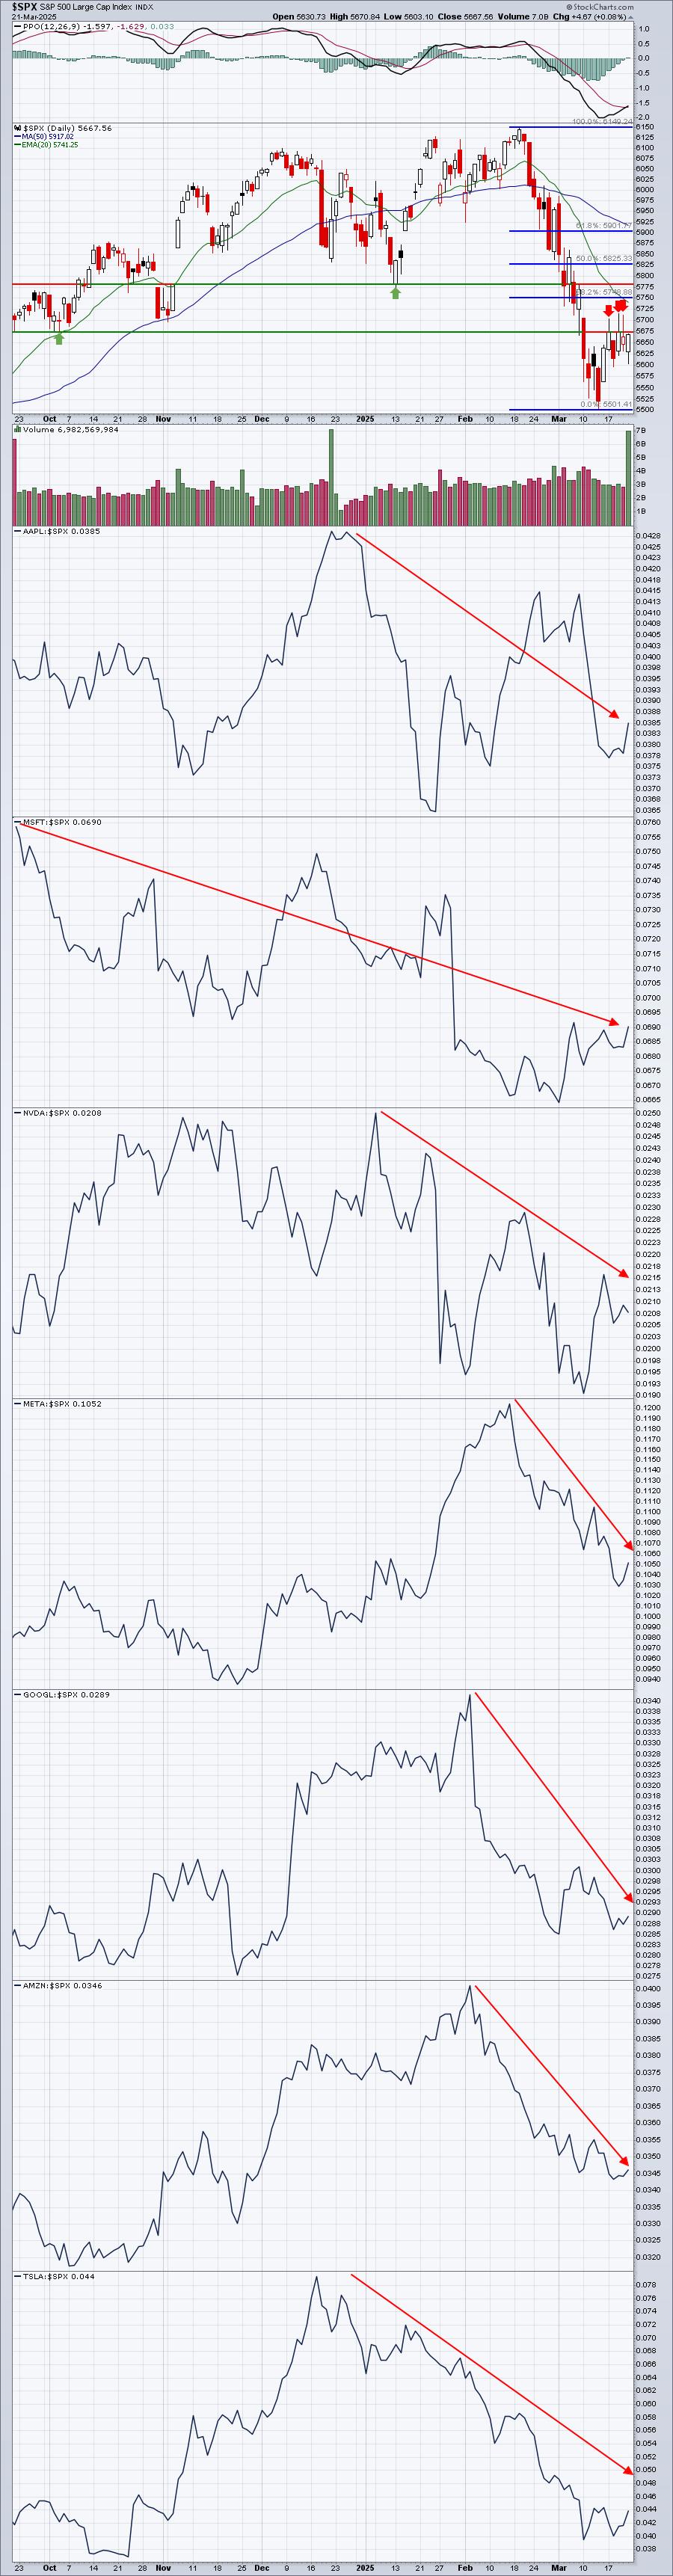
The S&P 500 is a market-cap-weighted index, meaning that the largest companies in terms of market capitalization will have the most impact in the index. The Mag 7 stocks shown above all are significant components of the S&P 500 (and are even a larger representation of the NASDAQ 100). They are all underperforming the S&P 500, which is why the drop on the S&P 500 has been so significant in such a short period of time. When these 7 stocks stabilize, the drop in the S&P 500 will slow considerably.
If we include the Fibonacci retracement tool on this chart, the initial Fibonacci retracement (38.2%) is at 5749. The 20-day SMA is at 5741. Price resistance is at roughly 5675 and 5782. While the rally last week was nice to see, it barely scraped the surface of the initial resistance zone and much of it could be attributable to options expiring.
Now for the NASDAQ 100, where the picture is actually a bit worse:
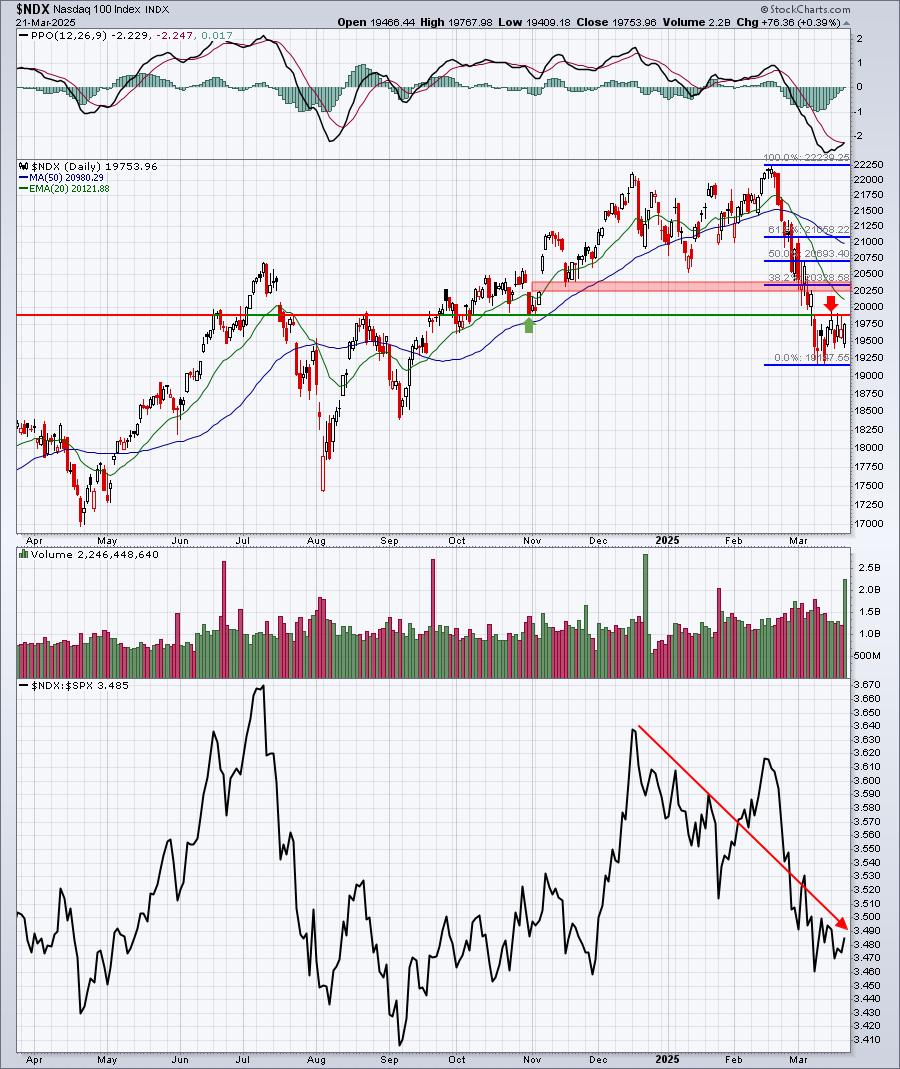
Initial price resistance is at approximately 19875 and, thus far, that's held as the NASDAQ has been unable to penetrate that level on a closing basis. Beyond that, however, remains more formidable resistance in the 20227-20394 area. The 20-day EMA falls just shy of that range at 20122.
The bulls have a TON of work to do to right the ship technically. Can they do it before a new low is reached? I don't believe they will, but only time will tell.
Long-Term Trade Setup
Since beginning this Weekly Market Report in September 2023, I've discussed the long-term trade candidates below that I really like. Generally, these stocks have excellent long-term track records and many pay nice dividends that mostly grow every year. Only in very specific cases (exceptions) would I consider a long-term entry into a stock that has a poor or limited long-term track record and/or pays no dividends. Below is a quick recap of how I view their long-term technical conditions currently:
- JPM - nice bounce off of recent 50-week SMA test
- BA - up more than 20% in less than 2 weeks; 190-192 likely to prove a difficult level to pierce
- FFIV - 20-week EMA test successful thus far
- MA - another with a 20-week SMA test holding
- GS - 10% bounce off its recent 50-week SMA test
- FDX - lengthy 4-month decline finally tested, and held, price support near 220
- AAPL - weakness has not cleared best price support on chart at 200 or just below
- CHRW - testing significant 95 level, where both price and 50-day SMA support reside
- JBHT - has fallen slightly beneath MAJOR support around 150
- STX - 85 support continues to hold
- HSY - did it just print a reverse right shoulder bottom on its weekly chart?
- DIS - trendless as weekly moving averages are not providing support or resistance
- MSCI - 3-year uptrend remains in play, though it's been in a rough 6-7 week stretch
- SBUX - first critical price test at all-time high near 116 failed miserably; support resides at 85
- KRE - looking to establish short-term bottom at 55, with 2-year uptrend intact
- ED - showing strength in March for 9th time in 10 years, moving to new all-time high
- AJG - continues one of most consistent and dependable uptrends, trading just below all-time high
- NSC - testing 230 price support as transportation woes continue
- RHI - has broken recent price support in upper-50s; searching for new bottom with 4.4% dividend yield
- ADM - struggled again at 20-week EMA, 45 represents a significant test of long-term uptrend
- BG - approaching 4-year price support at 65 after failed test of declining 20-week EMA
- CVS - bottom now seems light years away as CVS trades nearly 1-year high
- IPG - how long can it hold onto multi-year price support at 26?
- HRL - still bound between price support at 27.50 and 20-week EMA resistance at 30.15
- DE - still trending above its rising 20-week EMA
Keep in mind that our Weekly Market Reports favor those who are more interested in the long-term market picture. Therefore, the list of stocks above are stocks that we believe are safer (but nothing is ever 100% safe) to own with the long-term in mind. Nearly everything else we do at EarningsBeats.com favors short-term momentum trading, so I wanted to provide an explanation of what we're doing with this list and why it's different.
Also, please keep in mind that I'm not a Registered Investment Advisor (and neither is EarningsBeats.com nor any of its employees) and am only providing (mostly) what I believe to be solid dividend-paying stocks for the long-term. Companies periodically go through adjustments, new competition, restructuring, management changes, etc. that can have detrimental long-term impacts. The stock price nor the dividend is ever guaranteed. I simply point out interesting stock candidates for longer-term investors. Do your own due diligence and please consult with your financial advisor before making any purchases or sales of securities.
Looking Ahead
Upcoming Earnings
Very few companies will report quarterly results the next few weeks. The following list of companies is NOT a list of all companies scheduled to report quarterly earnings, however, just key reports, so please be sure to check for earnings dates of any companies that you own. Any company in BOLD represents a stock in one of our portfolios and the amount in parenthesis represents the market capitalization of each company listed:
- Monday: None
- Tuesday: MKC ($22 billion)
- Wednesday: CTAS ($78 billion), PAYX ($52 billion)
- Thursday: LULU ($40 billion)
- Friday: CCL ($22 billion)
Key Economic Reports
- Monday: March PMI composite flash
- Tuesday: January Case-Shiller home price index, January FHFA house price index, March consumer confidence, February new home sales
- Wednesday: February durable goods
- Thursday: Initial jobless claims, Q4 GDP & PCE (annual rate), February pending home sales
- Friday: February personal income & spending, February Core PCE index, March consumer sentiment
Historical Data
I'm a true stock market historian. I am absolutely PASSIONATE about studying stock market history to provide us more clues about likely stock market direction and potential sectors/industries/stocks to trade. While I don't use history as a primary indicator, I'm always very aware of it as a secondary indicator. I love it when history lines up with my technical signals, providing me much more confidence to make particular trades.
Below you'll find the next two weeks of historical data and tendencies across the 3 key indices that I follow most closely:
S&P 500 (since 1950)
- Mar 24: +16.48%
- Mar 25: +15.73%
- Mar 26: +82.36%
- Mar 27: -38.09%
- Mar 28: -4.03%
- Mar 29: +51.39%
- Mar 30: -39.66%
- Mar 31: -7.16%
- Apr 1: +67.49%
- Apr 2: +17.08%
- Apr 3: -0.40%
- Apr 4: -17.99%
- Apr 5: +68.25%
- Apr 6: +45.38%
NASDAQ (since 1971)
- Mar 24: +7.04%
- Mar 25: +13.51%
- Mar 26: +123.50%
- Mar 27: -104.48%
- Mar 28: -60.91%
- Mar 29: +53.31%
- Mar 30: -12.85%
- Mar 31: +39.81%
- Apr 1: +83.56%
- Apr 2: +18.47%
- Apr 3: -86.48%
- Apr 4: -70.46%
- Apr 5: +112.55%
- Apr 6: +26.71%
Russell 2000 (since 1987)
- Mar 24: +29.36%
- Mar 25: +105.65%
- Mar 26: +187.41%
- Mar 27: -74.99%
- Mar 28: -69.28%
- Mar 29: +64.48%
- Mar 30: +26.93%
- Mar 31: +78.83%
- Apr 1: +27.91%
- Apr 2: +18.08%
- Apr 3: -113.26%
- Apr 4: -75.19%
- Apr 5: +101.16
- Apr 6: +51.29%
The S&P 500 data dates back to 1950, while the NASDAQ and Russell 2000 information date back to 1971 and 1987, respectively.
Final Thoughts
Well, I had a pipe dream last week that the Federal Reserve would discuss how they were preparing to restart their interest rate cutting campaign. Not too surprisingly, that didn't happen. We proceeded to see January retail sales revised lower to -1.2% from -0.9%, while February retail sales were positive, but fell short of expectations. The empire state manufacturing saw a massive drop from February's 5.7 level to March's -20.0. There was another precipitous drop and negative surprise in the March housing market index, which took another tumble from 42 to 39. Existing home sales did finally end their recent string of horrendous reports as the February number came in 4.2% higher, even though forecasts showed another dip was likely. Housing starts and industrial production did come in better than expected, so it wasn't all bad economic news.
I've done a lot of research, trying to get a handle on where we're heading. I don't believe we've hit our ultimate 2025 low, but I'm sticking with my earlier call of no cyclical bear market on the S&P 500, which would require a 20% drop from the February high. As always, however, I'll remain open and objective as to the cyclical bear market possibility, I just don't believe at this time that it'll happen.
- The Rebound. We're still in rebound mode - until we aren't. I provided index charts above, highlighting key areas of resistance to watch.
- Options Expiration. Yes, March options expiration is officially over. However, the impact may not be. Options can be exercised and, if they are, market makers will remain on the long side of those exercised puts, potentially adding to last week's rebound.
- Sentiment. This is likely to be a big issue near-term. Market makers are sending a signal via the VIX that more volatility ahead is likely, though the VIX has dropped close to a third from its high near 30. However, sentiment from the retail trader hasn't shown anything in the form of capitulation. I'd feel better calling a bottom with a better (panicked) CPCE signal than what I've seen thus far.
- Rotation. Where Wall Street is putting its money to work is always very important to track. It was a significant reason why I turned so much more cautious into 2025 and during the first 2 months. As the S&P 500 drops, the risk of being OUT of the stock market begins to grow. Therefore, I keep an eye on our sectors to look for any signs that money if rotating back INTO aggressive areas of the market. A "risk on" market environment is nearly always a bullish market environment.
- Seasonality. The upcoming week will be the final full week in March. Once the calendar turns to April, stock market behavior historically turns more bullish. Since 1950, the S&P 500 has risen 53 times in April, while falling just 22 times. Only December (55 vs. 20) has risen more often than April over the past 75 years. We do occasionally see weakness in April, but we need to be aware of historical tendencies, and they are clearly bullish in April.
- Discretionary vs. Staples, the battle of the consumer groups. It's my favorite "below the surface" signal in the market. Discretionary stocks are the better performing consumer group when Wall Street believes we have good times ahead. On the flip side, staples stocks are used by Wall Street to hunker down for potential market weakness and volatility ahead. We started to see a bit of a shift back towards discretionary last week, but there's a lot more required from this group before I'd turn much more bullish.
Happy trading!
Tom