
EB Weekly Market Report - CORRECTED for Sustainability Ratios - Monday, April 7, 2025
Personal Time
During last week's Live Trading Room on Wednesday, I received more bad family news and immediately headed back to Florida, where there was a passing in my family early this morning. I apologize for not being around much during a very tumultuous market week, but remaining inactive and mostly in cash continued to make perfect sense. And I'm hopeful that everyone is understanding and patient as we mourn the passing of a loved one. Rest assured, I was in touch with John Hopkins last week, discussing the action, and will continue to be during my stay here in Florida.
I don't have a time schedule for returning from Florida, but it should be over the next day or two. I'll keep everyone posted.
ChartLists Updated
The following ChartLists were updated over the weekend:
- Strong Earnings (SECL)
- Strong Future Earnings (SFECL)
- Raised Guidance (RGCL)
- Bullish Trifecta (BTCL)
- April Seasonality (SEASCL)
One casualty from this latest trip to FL was the April Seasonality Report. I did select the Top 20 stocks for April and a ChartList has been created and should be available on the website by tomorrow. We'll track the April performance for these 20 stocks vs. the benchmark S&P 500 over the balance of April (from the Friday, April 4th close). I haven't looked to see how these 20 stocks have fared thus far this month, but the indiscriminate selling has probably left most, if not all, deeply underwater during the first week of April.
All of these ChartLists should be available to download into your StockCharts Extra or Pro account by tomorrow, if you have a StockCharts membership. Otherwise, we can send you an Excel file with the stocks included in these ChartLists in order to download them into other platforms. If you have any questions, please reach out to us at "[email protected]".
Weekly Market Recap
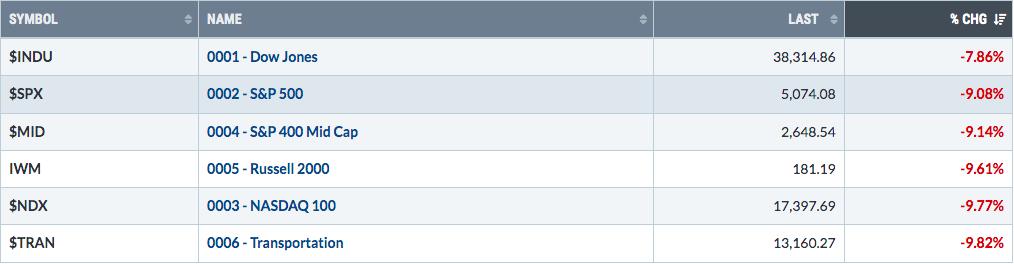
Major Indices
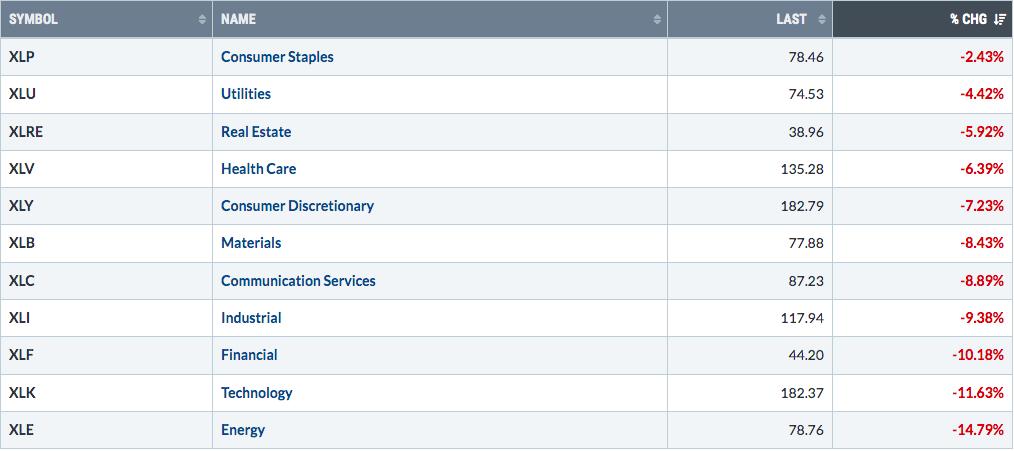
Sectors
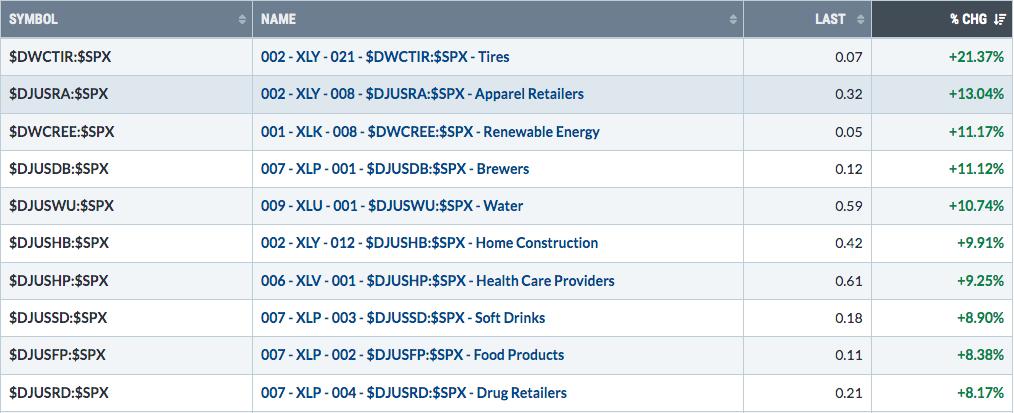
Top 10 Industries Last Week
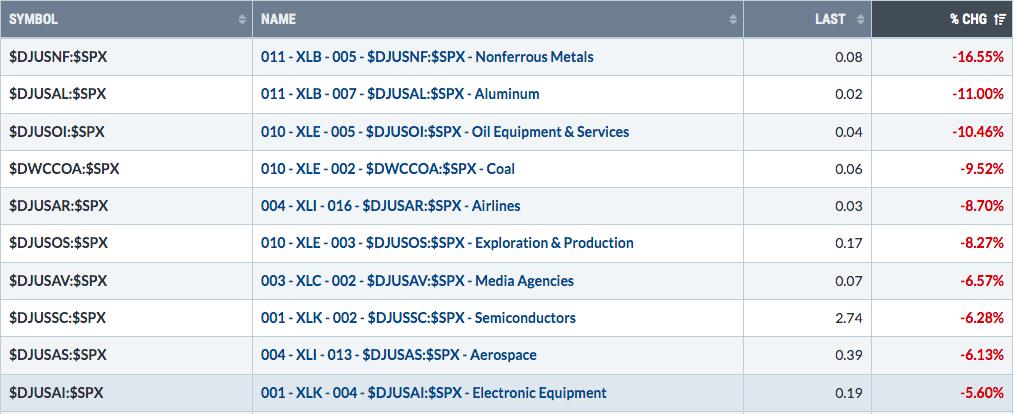
Bottom 10 Industries Last Week
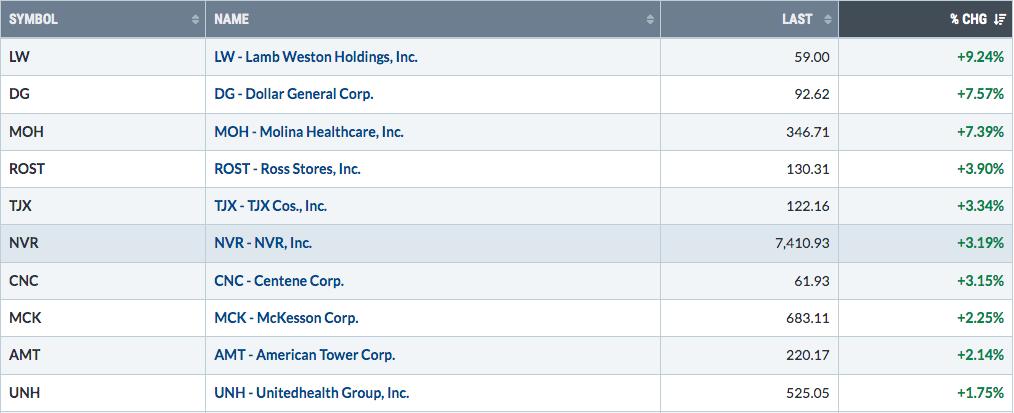
Top 10 Stocks - S&P 500/NASDAQ 100
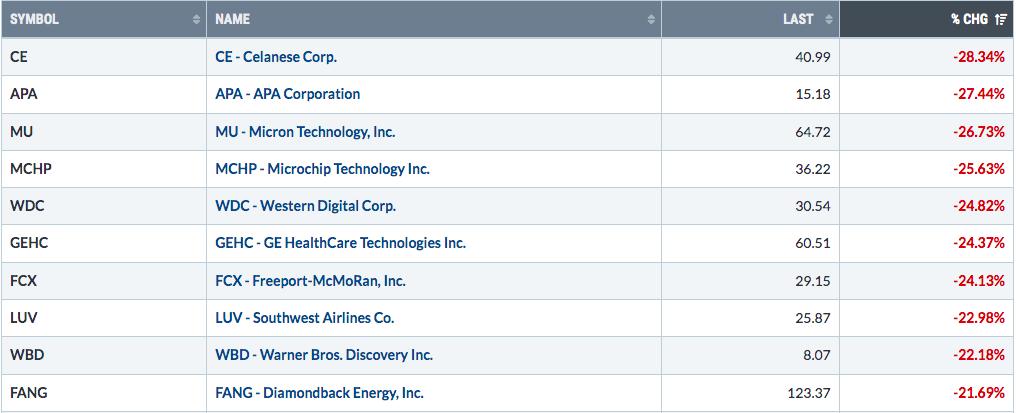
Bottom 10 Stocks - S&P 500/NASDAQ 100
Big Picture
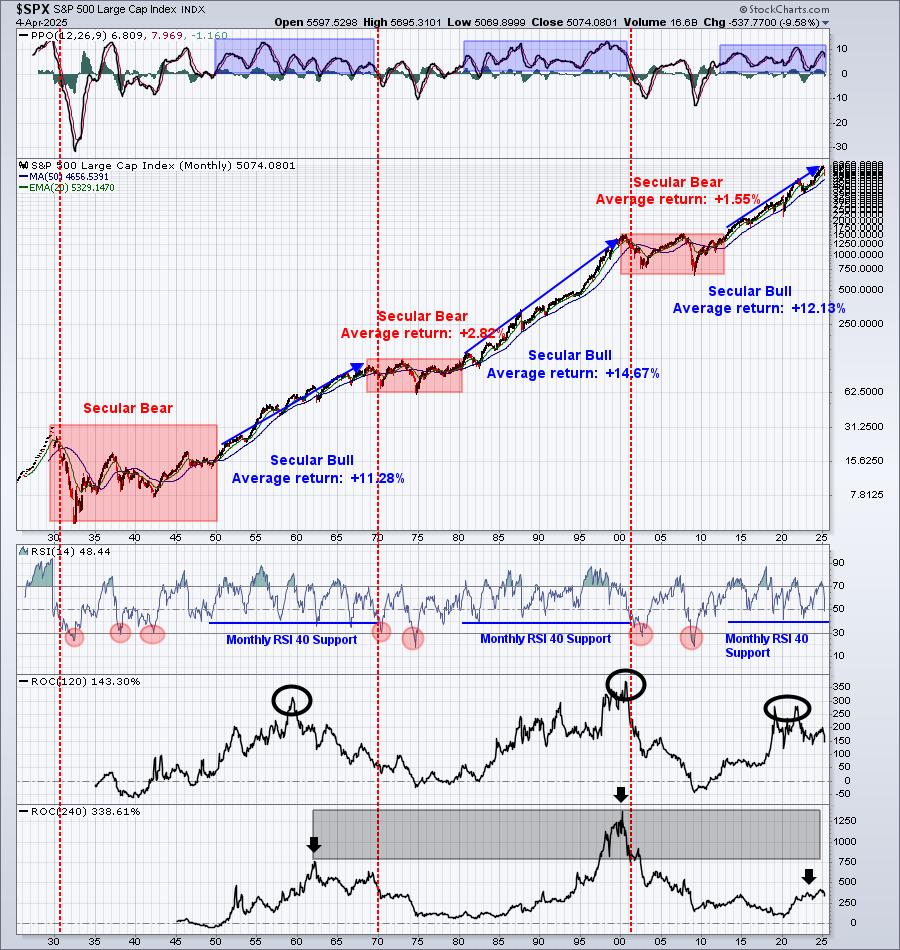
We now clearly see the monthly PPO rolling over on this Big Picture chart. That happens during any cyclical bear market and/or correction, so I don't find it alarming at all, despite the big losses on Thursday and Friday. Both the 2020 pandemic and the 2022 cyclical bear market saw the monthly PPO approach its centerline and the monthly RSI dip into the 40s. As of Friday, the monthly RSI stands at 48.44. There remains plenty of downside on the monthly RSI before printing a warning sign of a potential secular bear market. I don't see that coming, but the stock market is obviously reeling from the tariff, inflation, economic, and interest rate uncertainties.
Sustainability Ratios
Here's the latest look at our key intraday ratios as we follow where the money is traveling on an INTRADAY basis (ignoring gaps):
QQQ:SPY
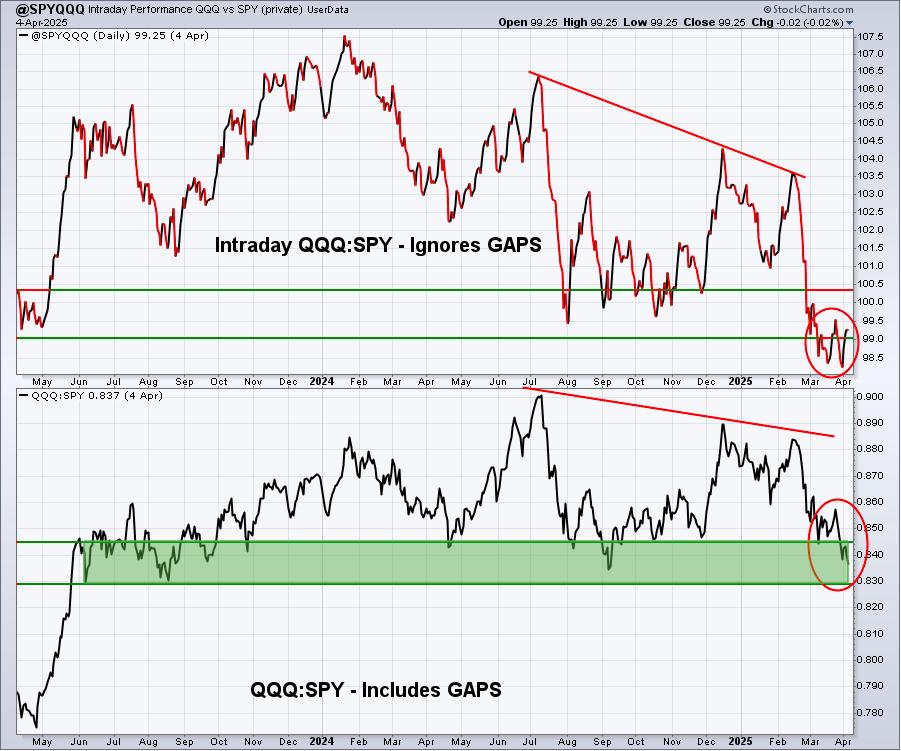
The QQQ:SPY ratio fell again last week, but the intraday QQQ:SPY actually rebounded nicely. It may be nothing, or it could be an initial signal of market rotation that favors a bottom printing very soon. It's a start.
IWM:QQQ
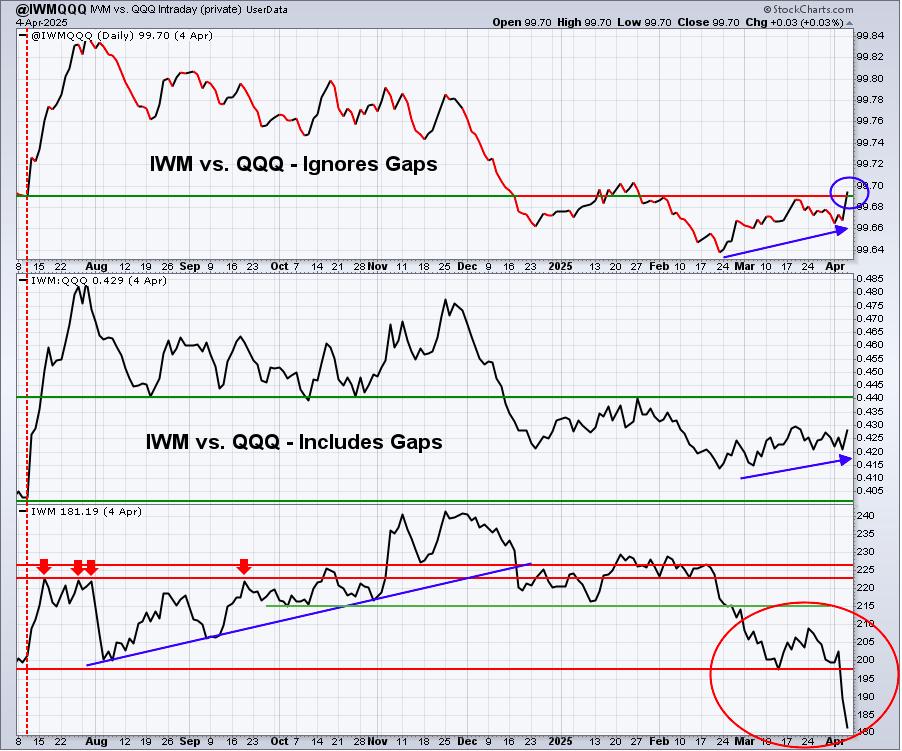
Just like the QQQ:SPY ratio, the IWM:QQQ ratio is improving immensely on an intraday basis, touching a 2 1/2 month relative high. If we include gaps, we're also seeing improvement. The IWM itself, in the bottom panel, appears to be collapsing, but keep in mind that market makers manipulate prices early during trading days to encourage panic by retail traders, so the market makers can line their pockets with shares in order to accumulate for their institutional clients. This is a positive development as well.
XLY:XLP
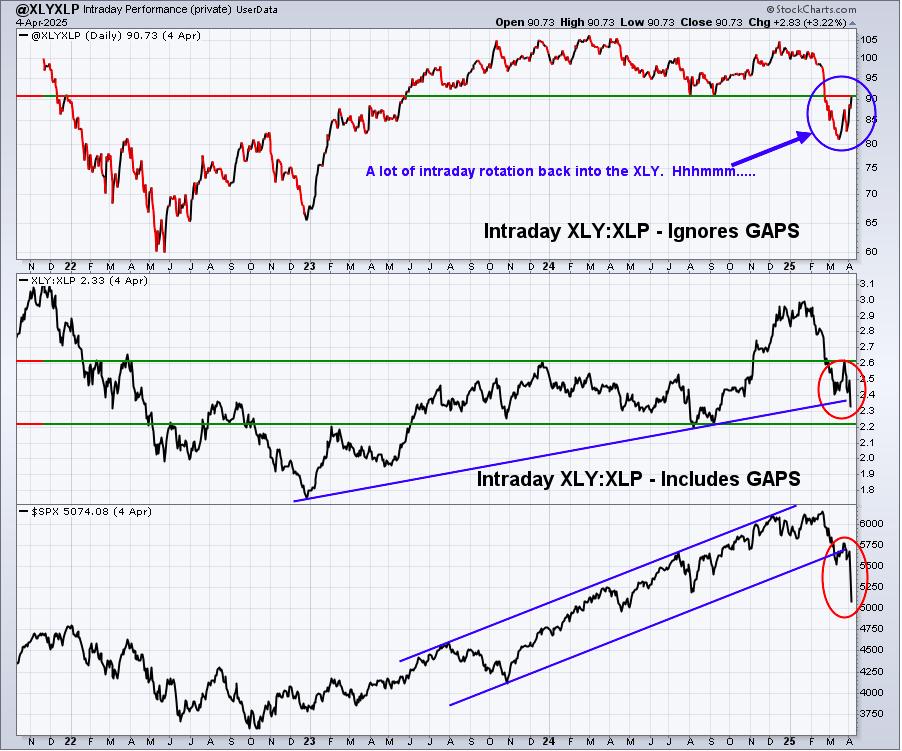
We've seen a lot of volatility in this XLY:XLP ratio, but I find it very difficult not to get excited when I see the intraday XLY:XLP surge like it did last week, while the S&P 500 tumbles and the "gaps included" XLY:XLP ratio fall further. To me, it's simply a disconnect between what the media is selling us and what market makers are doing during the trading day.
Sentiment
5-day SMA ($CPCE)
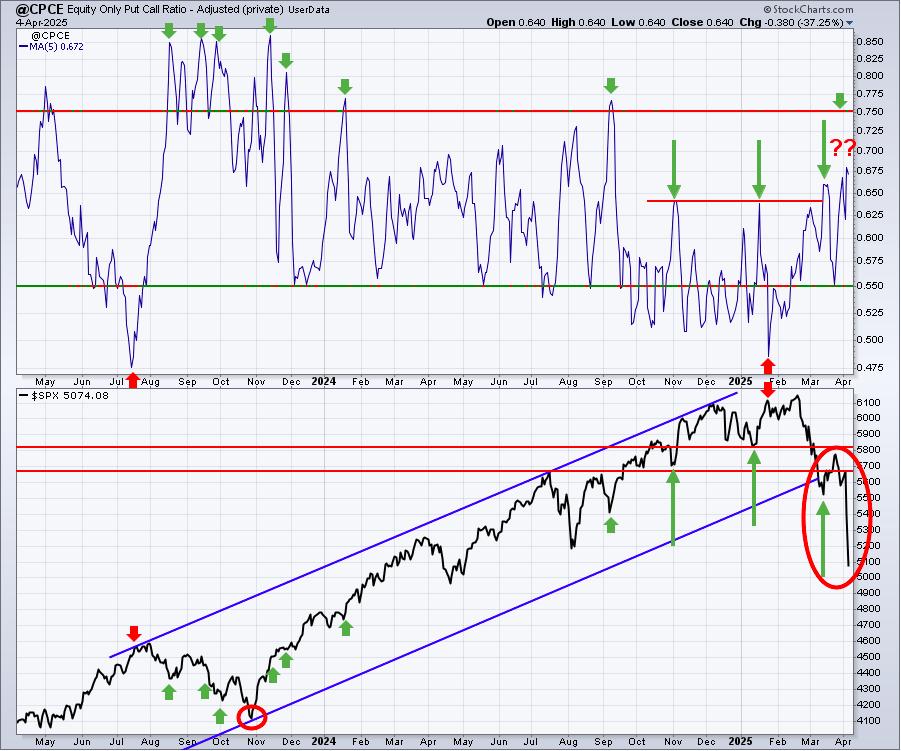
Sentiment indicators are contrarian indicators. When they show extreme bullishness, we need to be a bit cautious and when they show extreme pessimism, it could be time to become much more aggressive. Major market bottoms are carved out when pessimism is at its absolute highest level.
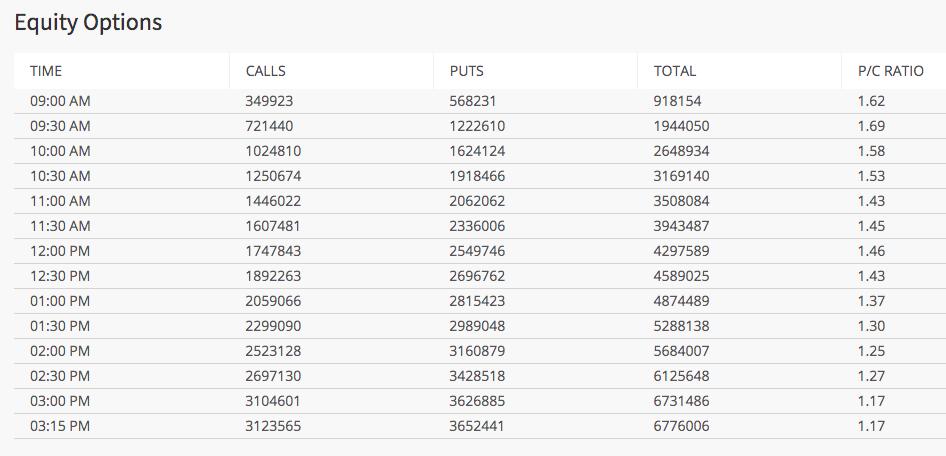
I am now officially saying the equity only put call ratio ($CPCE) at StockCharts.com is wrong. There is ZERO chance that the equity only put call ratio on Friday was .64. Here's what the CBOE.com showed for Friday:
And here was Thursday's reading at the CBOE.com:
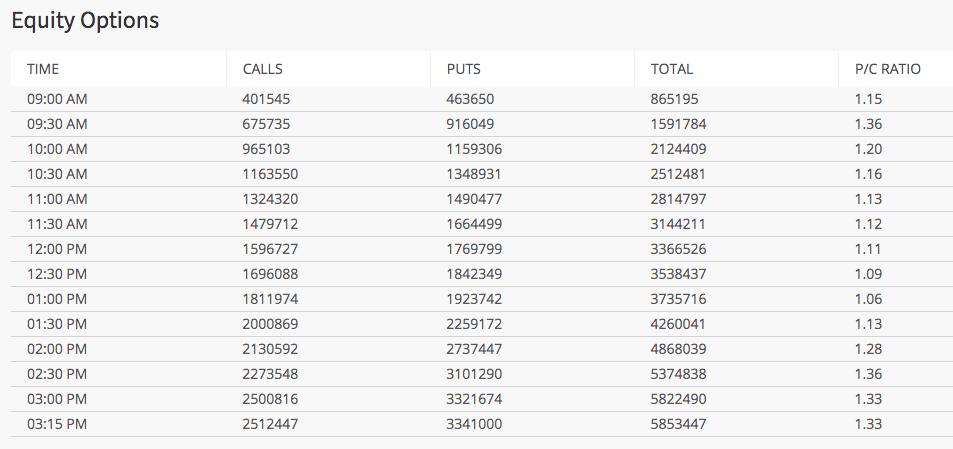
Those two readings of 1.33 and 1.17 on Thursday and Friday would be sending our 5-day SMA of the CPCE absolutely SOARING! I've sent both of these images for Thursday and Friday into StockCharts and they've responded, saying they will look into it today. When I hear, I'll let you know. In the meantime, I am treating the 5-day SMA of the CPCE as though it's WELL ABOVE .75, likely above .85 and that we're getting a massive buy signal from our sentiment indicators. Trying to time the EXACT bottom is not easy and it can be very, very painful if we're off by a day or two. But I don't look at it that way. I look at it as getting back into the market much, much lower than it was at the February 19th top. Now, if you're talking about jumping into leveraged ETF products, then timing the exact bottom is much more important.
I don't know if I'll be able to watch the market and the above hourly CPCE readings closely today as we have family issues to deal with down here in FL, but if I were home, I'd be checking out these half hour readings every time they print and if you see the market really start to plunge and individual half hour readings of the CPCE start to reach 3:1 or 4:1, we could very well be capitulating and bottoming. Call options will be extremely expensive for those of you with an aggressive trading mindset, but leveraged ETFs might be worth considering. Again, I want to emphasize that the stock market is already extremely volatile and leveraged ETFs potentially represent RISK ON STEROIDS, so please, please be careful!
253-day SMA ($CPCE)
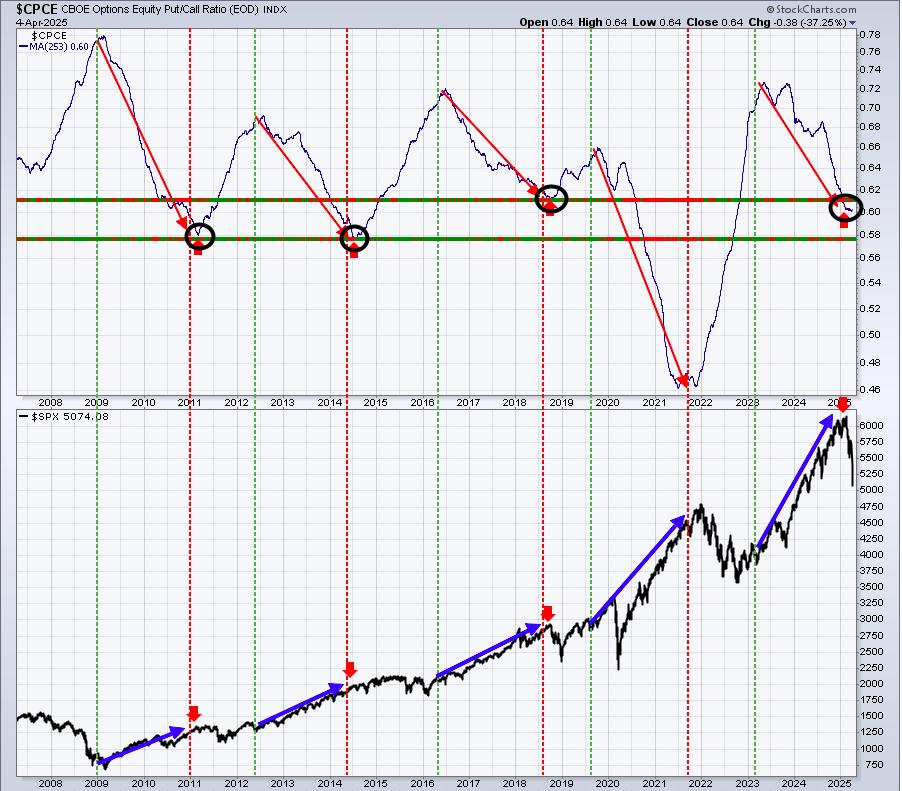
Remember, this 253-day SMA is our ocean-liner signal, not our speed boat. This chart is very helpful with the long-term picture. The 5-day SMA is my favorite short-term sentiment signal to try to catch short-term market reversals.
Volatility ($VIX)
Here's the current view of the VIX:
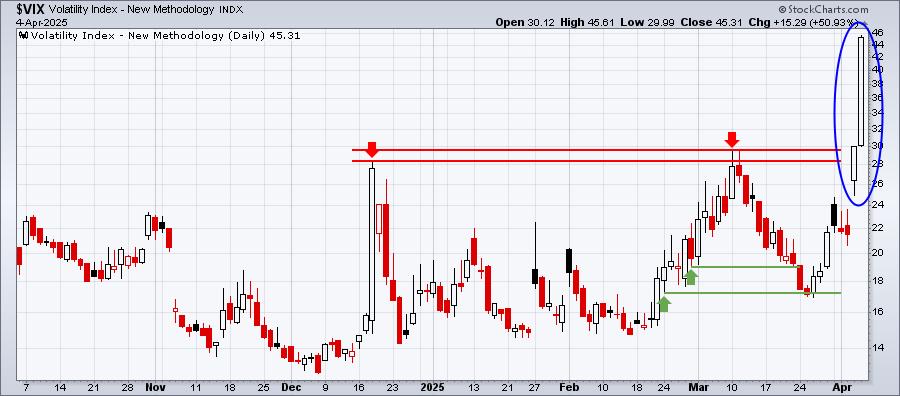
This is a perfect example of why it pays to be careful when the Volatility Index ($VIX) moves above 20. The faster the VIX accelerates to the upside, the larger the losses on the S&P 500. There is a silver lining, however. Buying stocks at a VIX peak is a great strategy, but if your timing is off by a day or two or three, you will see short-term losses mount very quickly. For those who exited and moved to cash in 2025, I believe incrementally moving back into stocks via index ETFs is a sound strategy. I prefer index ETFs (SPY, QQQ, IWM) over individual stocks, but it really depends on your risk tolerance. Leveraged ETFs could be considered by the riskiest of traders, but just remember these can generate huge gains OR huge losses very quickly. Do not consider leveraged ETFs in this environment, unless you acknowledge having a gambler's mentality.
Individual stocks can present tremendous opportunities. In my experience, the first stocks to bounce back from this type of panicked selloff are the long-term leaders like AAPL, MSFT, NVDA, etc. and perhaps stocks in previously-hot areas like AI. I would consider something like PLTR, CLS, VST, ALAB, etc. These are much more aggressive, but would likely rebound very quickly if the overall market does the same.
While I know many of you highly value our market guidance at EarningsBeats.com, ultimately the risk of investment is entirely yours. I always feel the need to say that, because we have no idea the risk tolerance that each individual might be willing to accept and the stock market doesn't get any riskier than it's been of late. And that risk may continue to accelerate further in this market environment. Remember, we are not Registered Investment Advisors and are not licensed to provide security recommendations or advice. Please consult your own personal financial advisor before buying or selling ANY financial securities.
Long-Term Trade Setup
Since beginning this Weekly Market Report in September 2023, I've discussed the long-term trade candidates below that I really like. Generally, these stocks have excellent long-term track records, and many pay nice dividends that mostly grow every year. Only in specific cases (exceptions) would I consider a long-term entry into a stock that has a poor or limited long-term track record and/or pays no dividends. Below is a quick recap of how I viewed their long-term technical conditions as of a few weeks ago:
- JPM - nice bounce off the recent 50-week SMA test
- BA - up more than 20% in less than 2 weeks; 190-192 likely to prove a difficult level to pierce
- FFIV - 20-week EMA test successful thus far
- MA - another with a 20-week SMA test holding
- GS - 10% bounce off its recent 50-week SMA test
- FDX - lengthy four-month decline finally tested, and held, price support near 220
- AAPL - weakness has not cleared best price support on the chart at 200 or just below
- CHRW - testing significant 95 level, where both price and 50-day SMA support reside
- JBHT - has fallen slightly beneath MAJOR support around 150
- STX - 85 support continues to hold
- HSY - did it just print a reverse right shoulder bottom on its weekly chart?
- DIS - trendless as weekly moving averages are not providing support or resistance
- MSCI - 3-year uptrend remains in play, though it's been in a rough 6-7 week stretch
- SBUX - first critical price test at all-time high near 116 failed miserably; support resides at 85
- KRE - looking to establish short-term bottom at 55, with 2-year uptrend intact
- ED - showing strength in March for 9th time in 10 years, moving to new all-time high
- AJG - continues one of most consistent and dependable uptrends, trading just below all-time high
- NSC - testing 230 price support as transportation woes continue
- RHI - has broken recent price support in upper-50s; searching for new bottom with 4.4% dividend yield
- ADM - struggled again at 20-week EMA, 45 represents a significant test of long-term uptrend
- BG - approaching 4-year price support at 65 after failed test of declining 20-week EMA
- CVS - bottom now seems light years away as CVS trades nearly 1-year high
- IPG - how long can it hold onto multi-year price support at 26?
- HRL - still bound between price support at 27.50 and 20-week EMA resistance at 30.15
- DE - still trending above its rising 20-week EMA
Keep in mind that our Weekly Market Reports favor those who are more interested in the long-term market picture. Therefore, the list of stocks above are stocks that we believe are safer (but nothing is ever 100% safe) to own with the long-term in mind. Nearly everything else we do at EarningsBeats.com favors short-term momentum trading, so I wanted to explain what we're doing with this list and why it's different.
Also, please keep in mind that I'm not a Registered Investment Advisor (and neither is EarningsBeats.com nor any of its employees) and am only providing (mostly) what I believe to be solid dividend-paying stocks for the long term. Companies periodically go through adjustments, new competition, restructuring, management changes, etc. that can have detrimental long-term impacts. Neither the stock price nor the dividend is ever guaranteed. I simply point out interesting stock candidates for longer-term investors. Do your due diligence and please consult with your financial advisor before making any purchases or sales of securities.
Looking Ahead
Upcoming Earnings
Very few companies will report quarterly results until mid-April. The following list of companies is NOT a list of all companies scheduled to report quarterly earnings, however, just key reports, so please be sure to check for earnings dates of any companies that you own. Any company in BOLD represents a stock in one of our portfolios and the amount in parenthesis represents the market capitalization of each company listed:
- Monday: None
- Tuesday: None
- Wednesday: STZ ($33 billion), DAL ($25 billion)
- Thursday: None
- Friday: JPM ($639 billion), WFC ($214 billion), BLK ($138 billion), BK ($57 billion), FAST ($45 billion)
Key Economic Reports
- Monday: None
- Tuesday: None
- Wednesday: FOMC minutes
- Thursday: Initial jobless claims, March CPI
- Friday: March PPI, April consumer sentiment
Historical Data
I'm a true stock market historian. I am absolutely PASSIONATE about studying stock market history to provide us more clues about likely stock market direction and potential sectors/industries/stocks to trade. While I don't use history as a primary indicator, I'm always very aware of it as a secondary indicator. I love it when history lines up with my technical signals, providing me with much more confidence to make particular trades.
Below you'll find the next two weeks of historical data and tendencies across the three key indices that I follow most closely:
S&P 500 (since 1950)
- Apr 7: -48.59%
- Apr 8: +62.64%
- Apr 9: +60.32%
- Apr 10: +47.37%
- Apr 11: -29.33%
- Apr 12: +63.88%
- Apr 13: -21.35%
- Apr 14: -1.74%
- Apr 15: +36.44%
- Apr 16: +60.82%
- Apr 17: +85.67%
- Apr 18: +38.75%
- Apr 19: -27.13%
- Apr 20: -31.69%
NASDAQ (since 1971)
- Apr 7: -38.23%
- Apr 8: +44.64%
- Apr 9: +60.64%
- Apr 10: +47.74%
- Apr 11: -51.08%
- Apr 12: +33.04%
- Apr 13: -0.08%
- Apr 14: -63.47%
- Apr 15: +8.34%
- Apr 16: +92.83%
- Apr 17: +87.79%
- Apr 18: +114.19%
- Apr 19: -37.48%
- Apr 20: -48.16%
Russell 2000 (since 1987)
- Apr 7: -90.50%
- Apr 8: +59.63%
- Apr 9: +137.22%
- Apr 10: +5.20%
- Apr 11: -80.66%
- Apr 12: +45.00%
- Apr 13: -37.09%
- Apr 14: -79.71%
- Apr 15: -48.82%
- Apr 16: +115.58%
- Apr 17: +84.30%
- Apr 18: +96.02%
- Apr 19: +3.47%
- Apr 20: -104.74%
The S&P 500 data dates back to 1950, while the NASDAQ and Russell 2000 information date back to 1971 and 1987, respectively.
Final Thoughts
My final thoughts this week is that we're staring at a completely irrational market. I'm saying this strictly because I know how a stock market performs and reacts in a market environment that has a VIX in the mid-40s. Think back to the 1987 market crash, the turn-of-the-century dot com bubble, the 2008/2009 financial crisis, and the 2020 pandemic. During these rough market times, valuations were priced at ridiculously low levels - as we now know. We need to learn from these experiences when we see another one - 2025 tariffs - rocking U.S. stocks. I always say you have to "hold your nose and buy". Many folks are panicking out of stocks AFTER they've dropped 20%, 30%, 50%, or even more. We need to be thinking OPPOSITE of the crowd.
Late last week, I began buying the SPY, QQQ, and IWM on the huge gap downs. I plan to add more this morning during weakness. And I am planning to add more when panic drives prices lower and lower. I also added or will add VERY small positions in Mag 7 stocks, and potentially a few AI stocks. The stock market tends to try to price the worst-case scenario into stocks, without any rational thoughts. I look to take advantage of these types of opportunities. I cannot guarantee that prices don't move lower. In fact, if the VIX continues to rise into the 50s, 60s and higher, don't be shocked if we wake up one morning to a 10% decline. It is my opinion that we are seeing TONS of manipulation with most selling taking place at the opening bell or in the first 30-90 minutes of trading. Losses have been considerably lower after 11am ET, so one strategy I tend to use is to buy when things feel the worst - during those early morning hours.
Time will tell if this strategy pays off. But the further and further the market drops, the better and better the reward to risk becomes.
There won't be much in the way of earnings or economic reports the first half of this week, but we could see fireworks in the second half of the week. The March CPI and PPI reports will be out on Thursday and Friday, respectively. The latest consumer sentiment reading will be out. Last month, it hit 57 and this month it's anticipated that we'll come in at 55. Let me just say that throughout history, consumer sentiment has bottomed in the 50-55 area, only touching this area on a handful of occasions. The 50-55 area has historically marked MAJOR market bottoms, which makes sense. If consumers are already expecting the very worst, there's likely not much downside left in the stock market, which looks ahead 6-9 months, not behind.
Key banks will kick off earnings season on Friday as both JP Morgan (JPM) and Wells Fargo (WFC) will report their latest quarterly results. I expect solid numbers, but guidance is what the market will worry about. The falling 10-year treasury yield could put a squeeze on banks' net interest margin in the quarter ahead. I'm expecting Mr. Doom, Jaime Dimon, to say there's a ton of uncertainties out there, especially with regard to the tariffs. How will the market hold up vs. that? We'll find out later this week.
Happy trading!
Tom