
EB Weekly Market Report - Monday, April 14, 2025
ChartLists/Spreadsheets Updated
The following ChartLists/Spreadsheets were updated over the weekend:
- Strong Earnings (SECL)
- Strong Future Earnings (SFECL)
- Strong AD (SADCL)
- Raised Guidance (RGCL)
- Bullish Trifecta (BTCL)
- Manipulation Spreadsheet
All of these ChartLists should be available to download into your StockCharts Extra or Pro account, if you have a StockCharts membership. Otherwise, we can send you an Excel file with the stocks included in these ChartLists in order to download them into other platforms.
The Manipulation Spreadsheet has been updated for our 3 primary index ETFs - SPY, QQQ, and IWM. Also updated were AAPL, MSFT, NVDA, META, GOOGL, AMZN, TSLA, NFLX, AMD, JPM, PLTR, and CLS (new addition over weekend). If the link on our website has not yet been updated, it will either later today or tomorrow, so be sure to check it out.
If you have any questions, please reach out to us at "[email protected]".
Weekly Market Recap
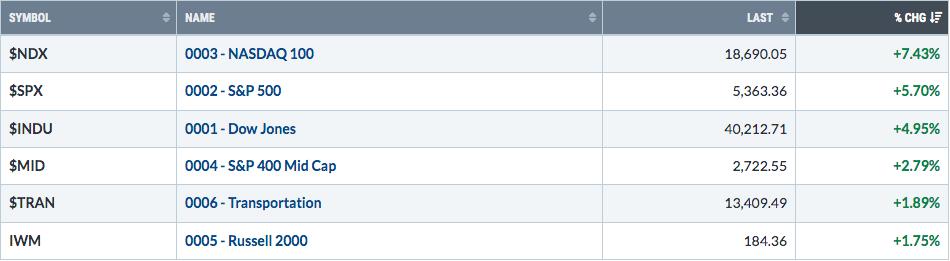
Major Indices
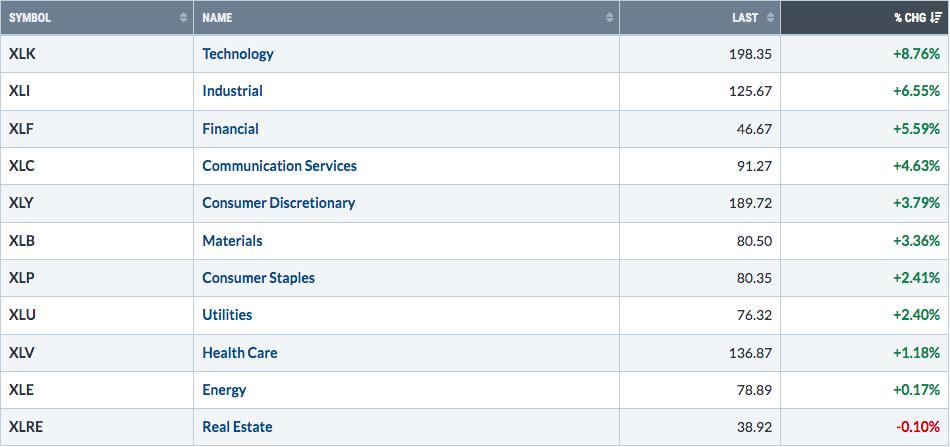
Sectors
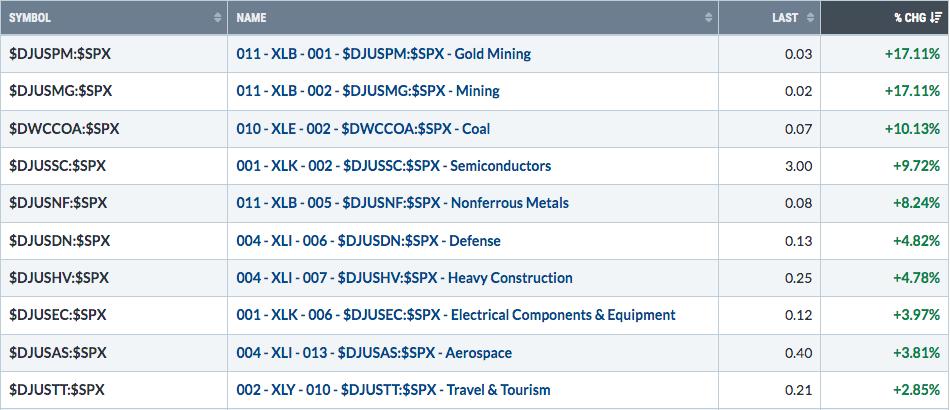
Top 10 Industries Last Week
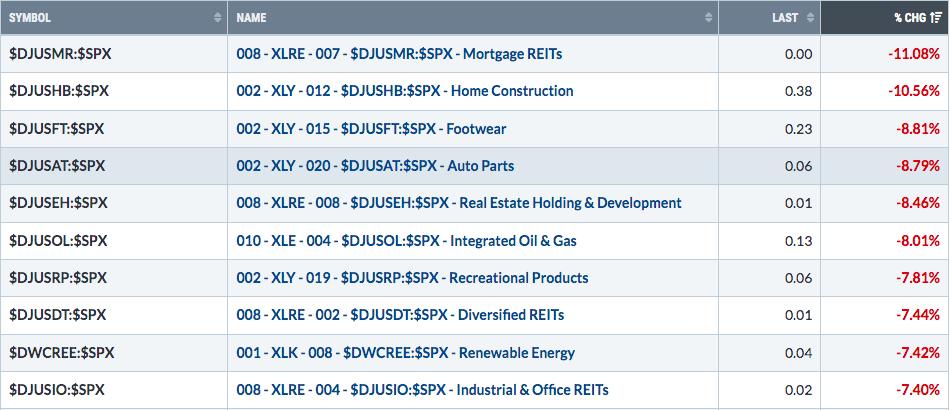
Bottom 10 Industries Last Week
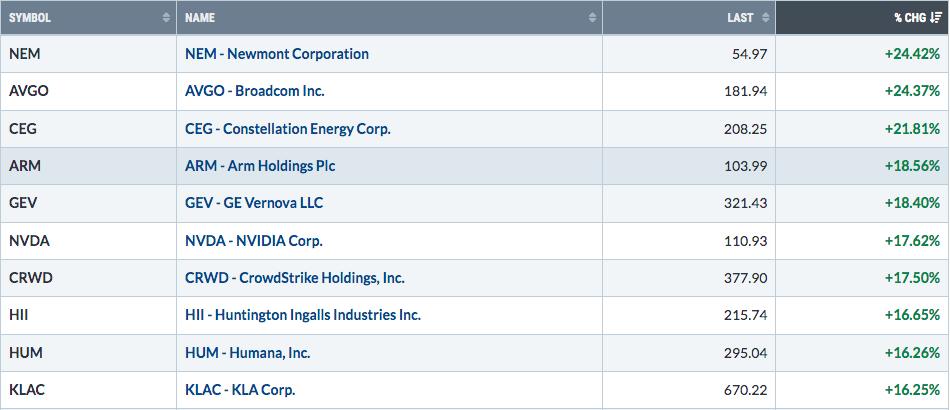
Top 10 Stocks - S&P 500/NASDAQ 100
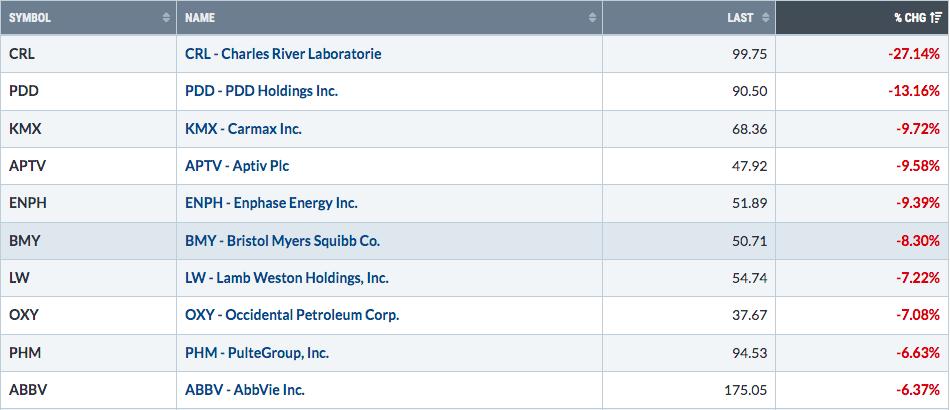
Bottom 10 Stocks - S&P 500/NASDAQ 100
Big Picture
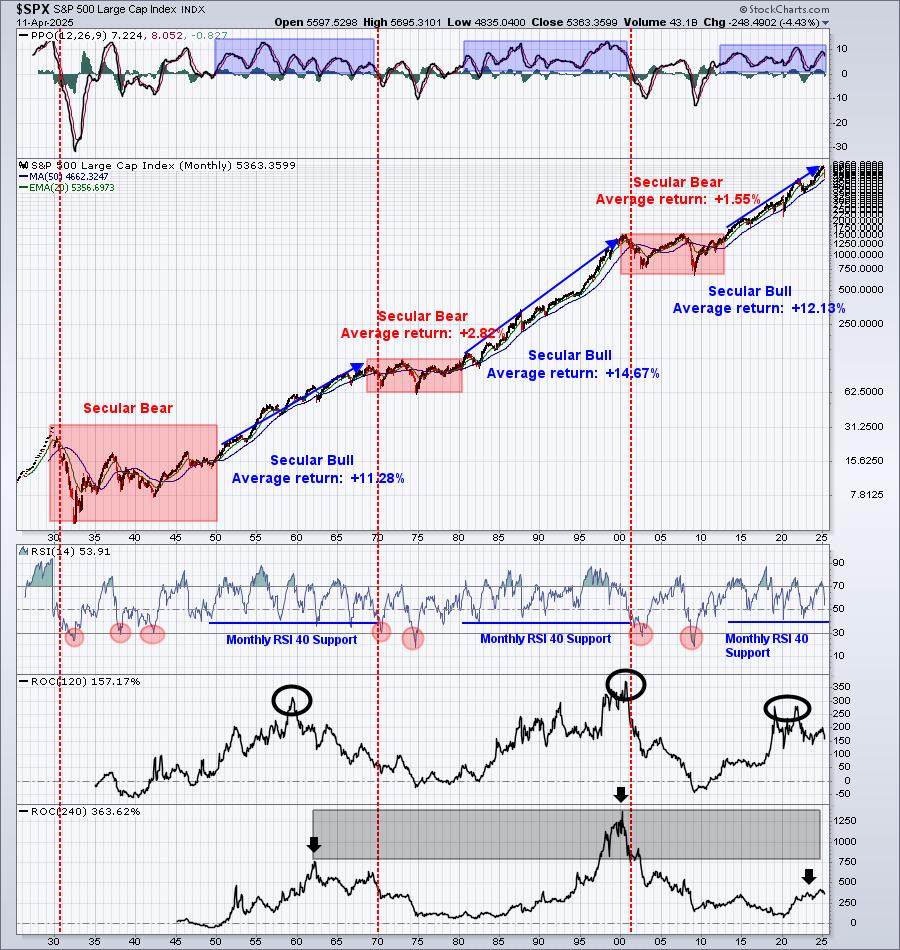
We now clearly see the monthly PPO rolling over on this Big Picture chart. That happens during any cyclical bear market and/or correction, so I don't find it alarming at all, despite the big losses on Thursday and Friday. Both the 2020 pandemic and the 2022 cyclical bear market saw the monthly PPO approach its centerline and the monthly RSI dip into the 40s. As of Friday, the monthly RSI stands at 48.44. There remains plenty of downside on the monthly RSI before printing a warning sign of a potential secular bear market. I don't see that coming, but the stock market is obviously reeling from the tariff, inflation, economic, and interest rate uncertainties.
Sustainability Ratios
Here's the latest look at our key intraday ratios as we follow where the money is traveling on an INTRADAY basis (ignoring gaps):
QQQ:SPY
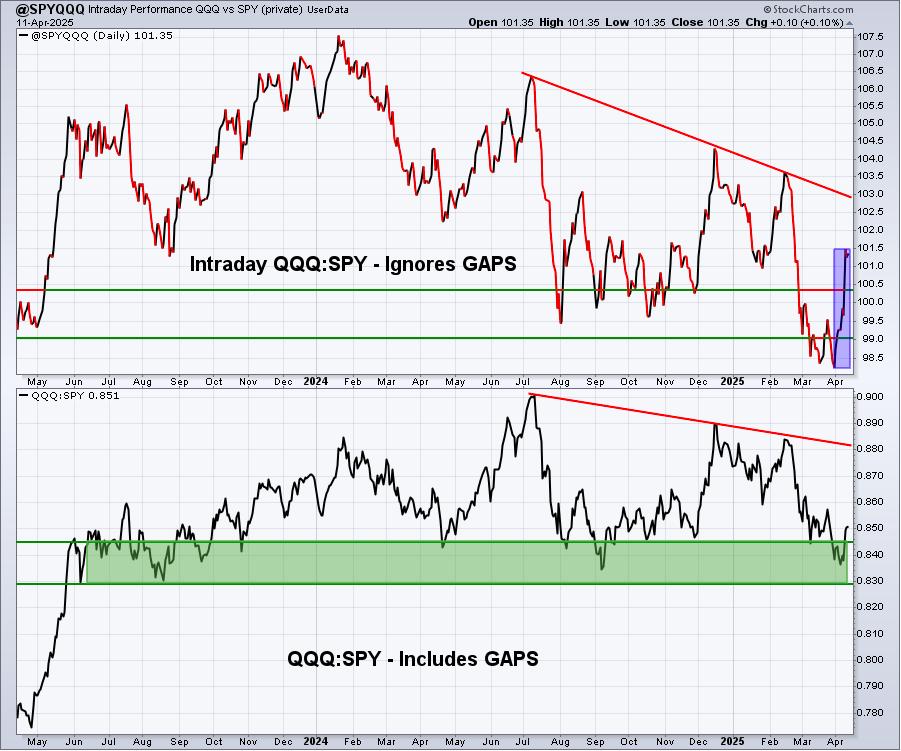
Last week, I mentioned that the intraday QQQ:SPY ratio improved and that it could be a signal of a bottom. Well, that intraday ratio soared last week, providing more evidence of bullish rotation.
IWM:QQQ
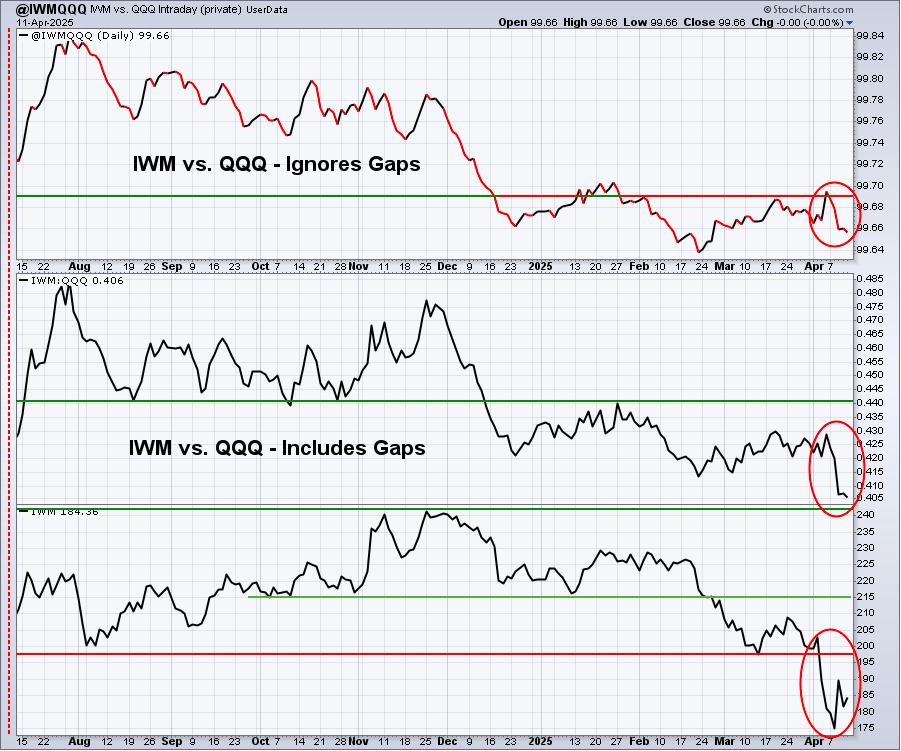
Up until last week, it looked as if there was some momentum building in small cap shares as the IWM:QQQ ratio was on the improve. That changed in a big way last week. The IWM itself bounced, but intraday rotation significantly favored the Mag 7 and related stocks. Inflation news was excellent last week as both the March Core CPI and March Core PPI came in well below expectations. The trading behavior, however, seemed to remain focused on tariffs despite the Trump administration's reversal on tariff policy with most countries (except China), pausing for a 90-day period.
XLY:XLP
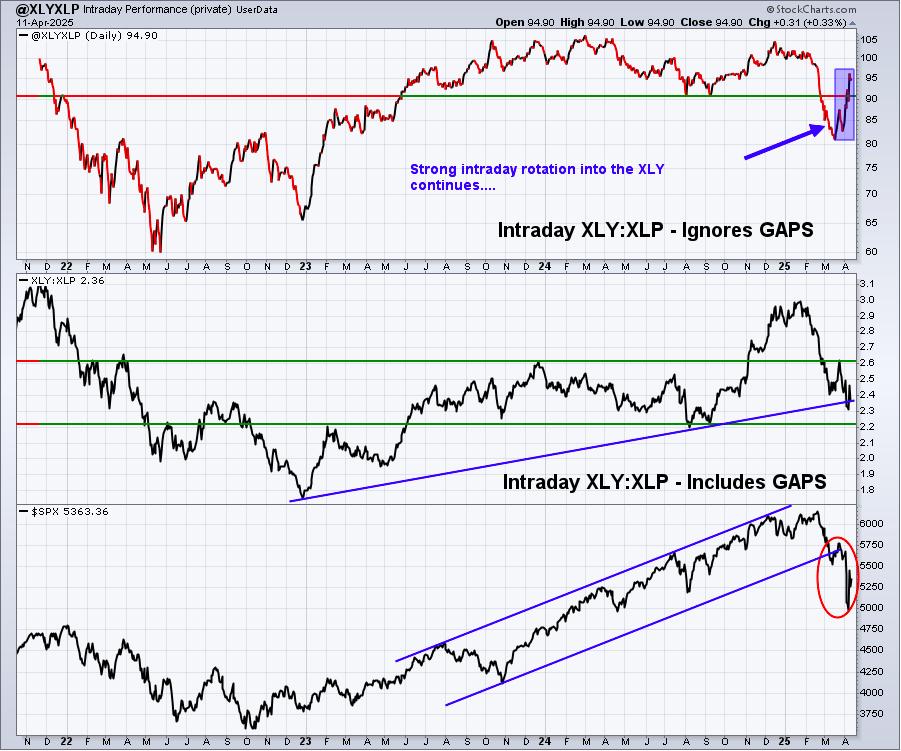
That blue-shaded area provides us a great visual of money rotating strongly back towards the more aggressive discretionary area of consumer stocks. Notice that the middle panel shows the XLY:XLP falling if we include gaps. But if we ignore gaps (top panel) and focus only on what happens intraday, the XLY:XLP surged. I interpret this as a very bullish development, though the most important signal of all is price action. An S&P 500 close back above 5521 is what we truly need to become more bullish technically. However, many times these "secondary" signals will provide us bullish clues that are later confirmed by price action.
Sentiment
5-day SMA ($CPCE)
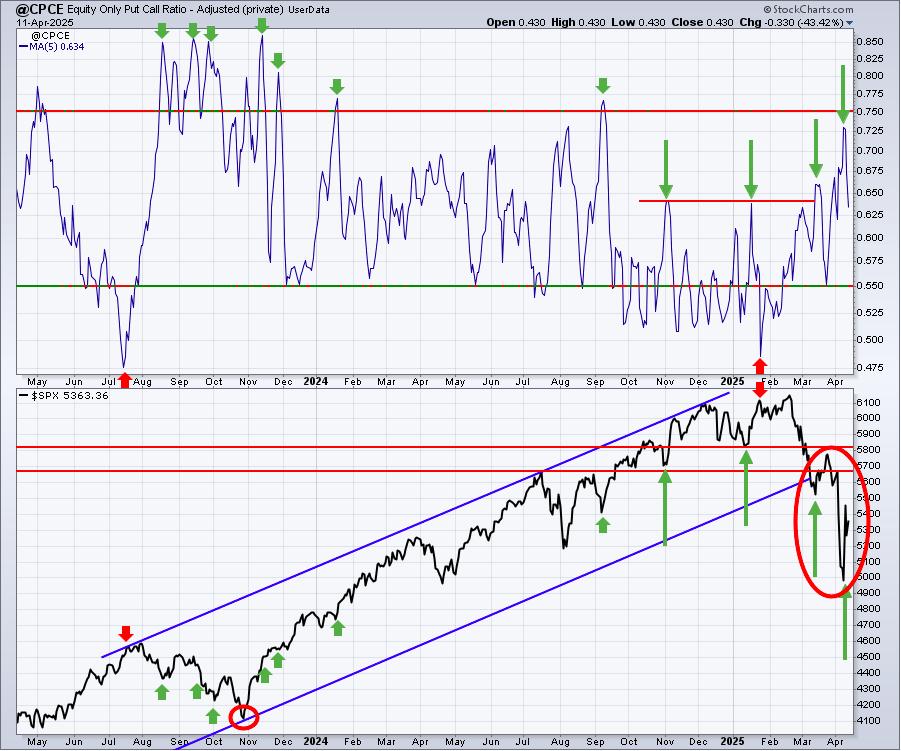
Sentiment indicators are contrarian indicators. When they show extreme bullishness, we need to be a bit cautious and when they show extreme pessimism, it could be time to become much more aggressive. Major market bottoms are carved out when pessimism is at its absolute highest level.
The 5-day CPCE reading here spiked, no doubt. However, I believe the spike was much larger than what shows here. In my discussions with Julius de Kempenaer at StockCharts.com, I learned that StockCharts gets its CPCE data from the Market Statistics page at cboe.com. So that mystery has been solved, but it's still not the answer I need. At cboe.com, the Market Statistics page that provides the daily equity only put call ratio is WAAAAY off from the cumulative reading shown on the half hourly CPCE data page. The cumulative daily totals from that page show much more pessimistic readings that support my belief that sentiment is growing ridiculously bearish - a bullish signal for stocks.
I've asked Julius to reach out to CBOE data folks to see if he can find out the reason for the ambiguity. I'll keep all of you posted as I hear.
253-day SMA ($CPCE)
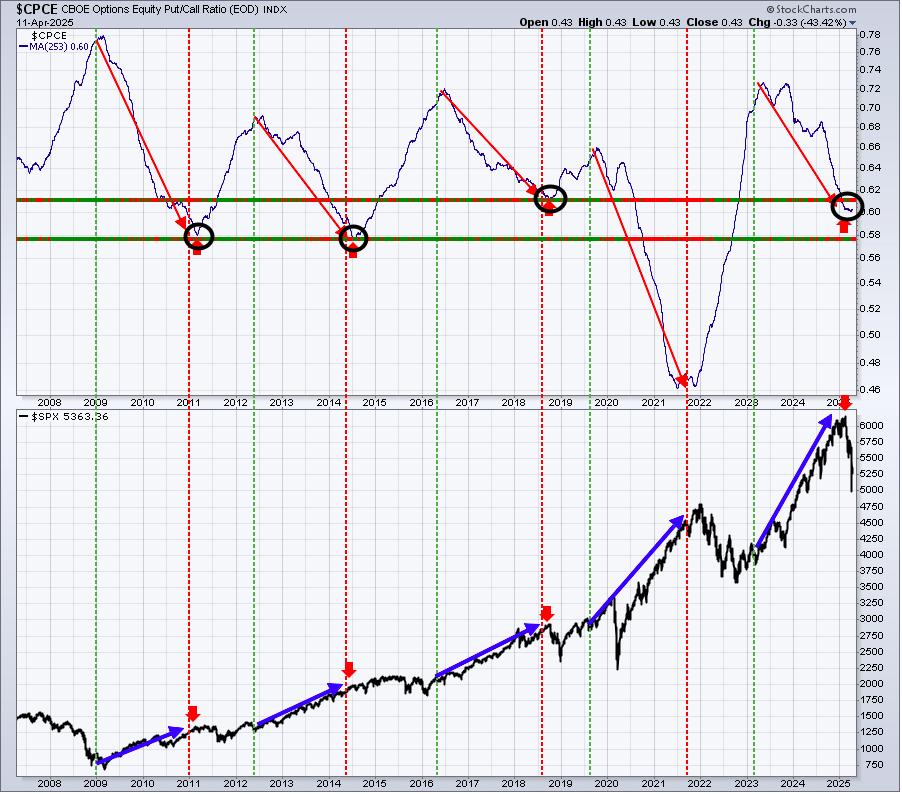
I've had several questions from members, asking about the low 253-day SMA of the CPCE and why that wouldn't suggest that the S&P 500 is poised to move lower, not higher. My response is this. We've seen this 253-day SMA bottom out at .58 twice and in the .40s once. While we could turn here at .60, I don't believe we will. Also, as I mentioned above, the ambiguity of what the CBOE is currently posting on their own site makes me wonder if the CPCE daily figures from CBOE are accurate. It's quite possible that both the 5-day SMA and the 253-day SMA are understated. Also, remember that this signal is just one signal, albeit one that I really favor a lot. We have other sentiment signals that paint a much more bearish picture right now, including both the Volatility Index ($VIX) and consumer sentiment ($$UMCSENT)
Volatility ($VIX)
Here's the current view of the VIX:
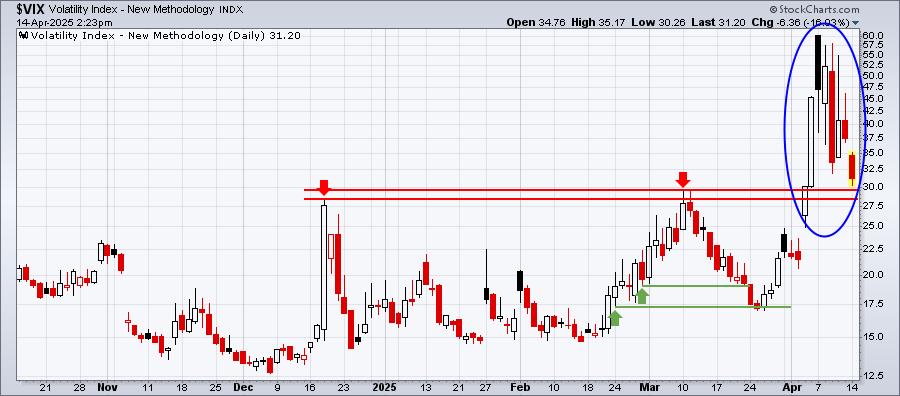
Fear is rapidly declining, but we do still need to respect any VIX reading above 20. There's still plenty of fear in the stock market to drive prices substantially lower. I see the odds of an S&P 500 decline beneath 4800 falling, but the possibility has not been eliminated. I see better odds that the S&P 500 will continue to rebound and begin to repair the technical damage inflicted by the high VIX selling that's taken place since the February 19th top.
Consumer Sentiment ($$UMCSENT)
Check out how bad consumer sentiment was reported on Friday. It was the 2nd lowest reading over the past 50 years. Also, check out what has happened to the S&P 500 AFTER these very bearish sentiment readings have printed:
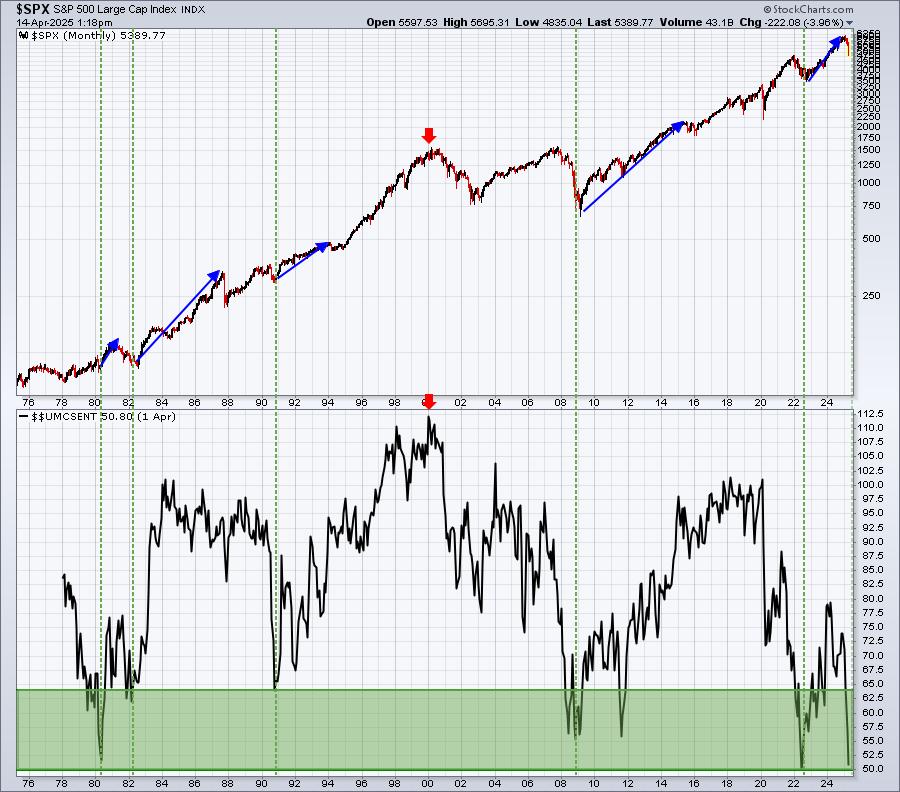
If you study the above chart, I think you'll find that when consumer sentiment gets this bad, you want to BUY as much of the S&P 500 as you can. It makes perfect sense to me, because if consumers believe things are SOOO bad, they're going to sell their stocks. Why in the world would you believe that everything is deteriorating economically, but then hold onto stocks? That's not the way it works. When folks grow this bearish, the tendency is for them to sell and "spare" their portfolios during the upcoming crash. The problem with this line of thinking is that history tells us that by the time consumer sentiment reaches insanely low levels, all the selling in the stock market is typically over.
One other very interesting value in consumer sentiment that's worth noting is.....at the time of the highest reading in consumer sentiment history (or at least over the past 50 years) in 2000, just when consumers could not have been any more bullish, the S&P 500 topped and we endured a 13-year secular bear market where we never saw any other meaningful all-time highs.
So you decide. Would you rather put capital to work when (a) everyone around you sees a beautiful, rosy stock market, or (b) when the bearishness is so strong that stocks are free-falling and traders are panicking? I know my answer.
Long-Term Trade Setup
Since beginning this Weekly Market Report in September 2023, I've discussed the long-term trade candidates below that I really like. Generally, these stocks have excellent long-term track records, and many pay nice dividends that mostly grow every year. Only in specific cases (exceptions) would I consider a long-term entry into a stock that has a poor or limited long-term track record and/or pays no dividends. Below is a quick recap of how I viewed their long-term technical conditions as of a month or so ago (I'll update my long-term thoughts on these stocks next week):
- JPM - nice bounce off the recent 50-week SMA test
- BA - up more than 20% in less than 2 weeks; 190-192 likely to prove a difficult level to pierce
- FFIV - 20-week EMA test successful thus far
- MA - another with a 20-week SMA test holding
- GS - 10% bounce off its recent 50-week SMA test
- FDX - lengthy four-month decline finally tested, and held, price support near 220
- AAPL - weakness has not cleared best price support on the chart at 200 or just below
- CHRW - testing significant 95 level, where both price and 50-day SMA support reside
- JBHT - has fallen slightly beneath MAJOR support around 150
- STX - 85 support continues to hold
- HSY - did it just print a reverse right shoulder bottom on its weekly chart?
- DIS - trendless as weekly moving averages are not providing support or resistance
- MSCI - 3-year uptrend remains in play, though it's been in a rough 6-7 week stretch
- SBUX - first critical price test at all-time high near 116 failed miserably; support resides at 85
- KRE - looking to establish short-term bottom at 55, with 2-year uptrend intact
- ED - showing strength in March for 9th time in 10 years, moving to new all-time high
- AJG - continues one of most consistent and dependable uptrends, trading just below all-time high
- NSC - testing 230 price support as transportation woes continue
- RHI - has broken recent price support in upper-50s; searching for new bottom with 4.4% dividend yield
- ADM - struggled again at 20-week EMA, 45 represents a significant test of long-term uptrend
- BG - approaching 4-year price support at 65 after failed test of declining 20-week EMA
- CVS - bottom now seems light years away as CVS trades nearly 1-year high
- IPG - how long can it hold onto multi-year price support at 26?
- HRL - still bound between price support at 27.50 and 20-week EMA resistance at 30.15
- DE - still trending above its rising 20-week EMA
Keep in mind that our Weekly Market Reports favor those who are more interested in the long-term market picture. Therefore, the list of stocks above are stocks that we believe are safer (but nothing is ever 100% safe) to own with the long-term in mind. Nearly everything else we do at EarningsBeats.com favors short-term momentum trading, so I wanted to explain what we're doing with this list and why it's different.
Also, please keep in mind that I'm not a Registered Investment Advisor (and neither is EarningsBeats.com nor any of its employees) and am only providing (mostly) what I believe to be solid dividend-paying stocks for the long term. Companies periodically go through adjustments, new competition, restructuring, management changes, etc. that can have detrimental long-term impacts. Neither the stock price nor the dividend is ever guaranteed. I simply point out interesting stock candidates for longer-term investors. Do your due diligence and please consult with your financial advisor before making any purchases or sales of securities.
Looking Ahead
Upcoming Earnings
Very few companies will report quarterly results until mid-April. The following list of companies is NOT a list of all companies scheduled to report quarterly earnings, however, just key reports, so please be sure to check for earnings dates of any companies that you own. Any company in BOLD represents a stock in one of our portfolios and the amount in parenthesis represents the market capitalization of each company listed:
- Monday: GS ($153 billion), MTB ($26 billion)
- Tuesday: JNJ ($358 billion), BAC ($273 billion), C ($116 billion), IBKR ($69 billion), PNC ($60 billion)
- Wednesday: ASML ($256 billion), ABT ($216 billion), KMI ($57 billion), TRV ($56 billion)
- Thursday: TSM ($784 billion), UNH ($544 billion), NFLX ($394 billion), AXP ($173 billion)
- Friday: None
Key Economic Reports
- Monday: None
- Tuesday: April empire state manufacturing index
- Wednesday: March retail sales, March industrial production & capacity utilization, February business inventories, April housing market index
- Thursday: Initial jobless claims, March housing starts & building permits, April Philadelphia Fed manufacturing index
- Friday: None
Historical Data
I'm a true stock market historian. I am absolutely PASSIONATE about studying stock market history to provide us more clues about likely stock market direction and potential sectors/industries/stocks to trade. While I don't use history as a primary indicator, I'm always very aware of it as a secondary indicator. I love it when history lines up with my technical signals, providing me with much more confidence to make particular trades.
Below you'll find the next two weeks of historical data and tendencies across the three key indices that I follow most closely:
S&P 500 (since 1950)
- Apr 14: -1.74%
- Apr 15: +36.44%
- Apr 16: +60.82%
- Apr 17: +85.67%
- Apr 18: +38.75%
- Apr 19: -27.13%
- Apr 20: -31.69%
- Apr 21: +37.15%
- Apr 22: +0.73%
- Apr 23: -6.32%
- Apr 24: -19.24%
- Apr 25: +20.74%
- Apr 26: +15.46%
- Apr 27: -0.94%
NASDAQ (since 1971)
- Apr 14: -63.47%
- Apr 15: +8.34%
- Apr 16: +92.83%
- Apr 17: +87.79%
- Apr 18: +114.19%
- Apr 19: -37.48%
- Apr 20: -48.16%
- Apr 21: +60.62%
- Apr 22: +63.30%
- Apr 23: -8.77%
- Apr 24: -31.97%
- Apr 25: +41.77%
- Apr 26: -1.07%
- Apr 27: +15.06%
Russell 2000 (since 1987)
- Apr 14: -79.71%
- Apr 15: -48.82%
- Apr 16: +115.58%
- Apr 17: +84.30%
- Apr 18: +96.02%
- Apr 19: +3.47%
- Apr 20: -104.74%
- Apr 21: +102.52%
- Apr 22: +20.50%
- Apr 23: +46.82%
- Apr 24: +21.14%
- Apr 25: +63.14%
- Apr 26: +3.38%
- Apr 27: +10.14%
The S&P 500 data dates back to 1950, while the NASDAQ and Russell 2000 information date back to 1971 and 1987, respectively.
Final Thoughts
I'm seeing enough bullish signs, especially as they relate to sentiment, that I no longer want to remain on the sidelines. This doesn't mean we can't go lower and it doesn't mean that these signals cannot change. However, I report what I see, bullish or bearish. Those of you that have been EarningsBeats.com members for a long period know that I'm not a one-trick pony. I don't hesitate to call market tops and market bottoms (based on my assessment of risk). That doesn't mean I don't waffle from time to time, especially in the short-term when conditions can change rapidly, but longer-term I generally remain committed to a stance. I was cautious to open the year and grew even more cautious as money began rotating in very defensive fashion. But we've now seen the S&P 500 move down 20% from its all-time high to last week's low - similar to what we saw in Q4 2018 during the last trade war. No one knows exactly how these tariffs will play out, but we have witnessed it before. There was no surge in inflation in 2019 and I don't expect there'll be one in 2025. In the latest consumer sentiment report on Friday, however, it showed that consumers now expect inflation to move up to 6.7%, significantly higher than the 5.0% inflation expectation last month. It's funny what scores of media headlines will do to a psyche.
I find it rather ironic that as the tariff/inflation headlines drive down our major indices to cyclical bear market levels, the manipulation by market makers has surged simulataneously. Brainwash the masses, then steal their money. That's how Wall Street works. And those who want to bring politics into the conversation, just keep in mind that I had the EXACT same view during the 2022 cyclical bear market with former President Biden in office. I do not allow political bias to enter into my market calls. I don't care about politics. I get my story from the charts.
In the week ahead, I honestly don't know which way the market is heading. It is options-expiration week and our weekend calculation shows a potential slight move higher in the SPY and QQQ, and a larger potential pop higher in the IWM. TSLA, META, and AAPL are 3 stocks that could benefit from max pain this week. On the flip side, WMT and COST could see some selling interest as they both remain 4-5% above their respective max pain levels. Two stocks, BK and CSGP, show potentially large max-pain-related selloffs ahead, but neither make common sense to me when I look at their charts, so I'd ignore them.
I'll be following the economic reports listed earlier to see if there are any apparent signs of economic weakness and, of course, the number of quarterly earnings reports will increase over the next few weeks. Two earnings reports of particular interest to me will be NFLX and AXP, which both report on Thursday, AXP in the morning and NFLX after the closing bell. Both of these stocks are in our portfolios.
Happy trading!
Tom