
EB Weekly Market Report - Monday, May 19, 2025
ChartLists/Spreadsheets Updated
The following ChartLists/Spreadsheets were updated over the weekend:
- Strong Earnings (SECL)
- Strong Future Earnings (SFECL)
- Raised Guidance (RGCL)**
- Short Squeeze (SSCL) - currently having trouble getting link to work, will fix later tonight or tomorrow
- Bullish Trifecta (BTCL)
- Manipulation Spreadsheet
- Upcoming Earnings & Upcoming Earnings Relative Strength
** I made a recent change on the RGCL. If you look at the list of companies on it, you'll see that stocks like MTZ show an asterisk before and after its ticker symbol. These companies all raised guidance for both revenues and EPS in the upcoming quarter, as well as raised guidance for both revenues and EPS in the coming year. Many companies are included on the RGCL for simply raising revenue guidance or EPS in an upcoming quarter OR year. To raise guidance for both revenues and EPS in both the upcoming quarter and upcoming year shows more confidence in their business strategy, in my opinion. I'm not endorsing these stocks as "better" or anything like that. I just feel it's important to begin differentiating those companies that significantly raise guidance like that.
The ChartLists should be available to download into your StockCharts Extra or Pro account, if you have a StockCharts membership. Otherwise, we can send you an Excel file with the stocks included in these ChartLists in order to download them into other platforms.
The Manipulation Spreadsheet has been updated for our 3 primary index ETFs - SPY, QQQ, and IWM and our 11 individual stocks - AAPL, MSFT, NVDA, META, GOOGL, AMZN, TSLA, NFLX, AMD, JPM, PLTR, and CLS. I review this Excel file weekly. It is not meant to be updated and studied daily.
If you have any questions, please reach out to us at "[email protected]".
Weekly Market Recap
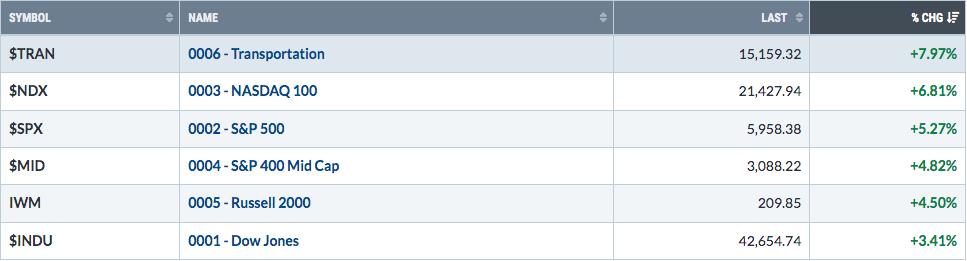
Major Indices
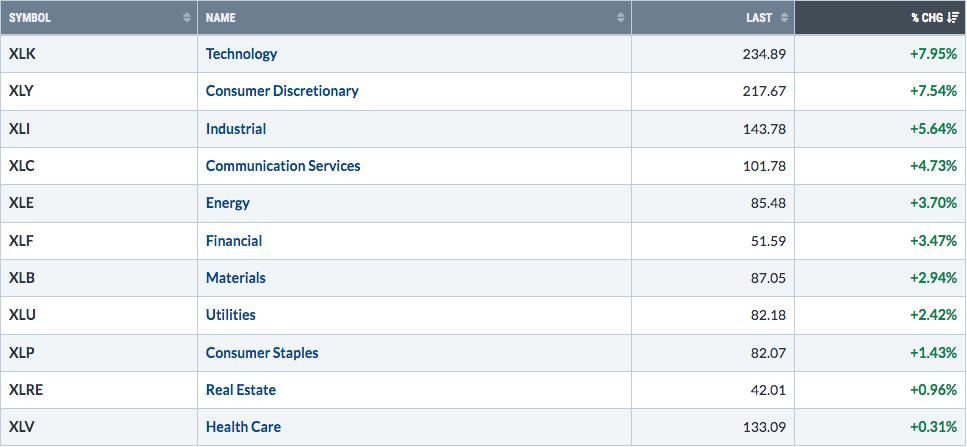
Sectors
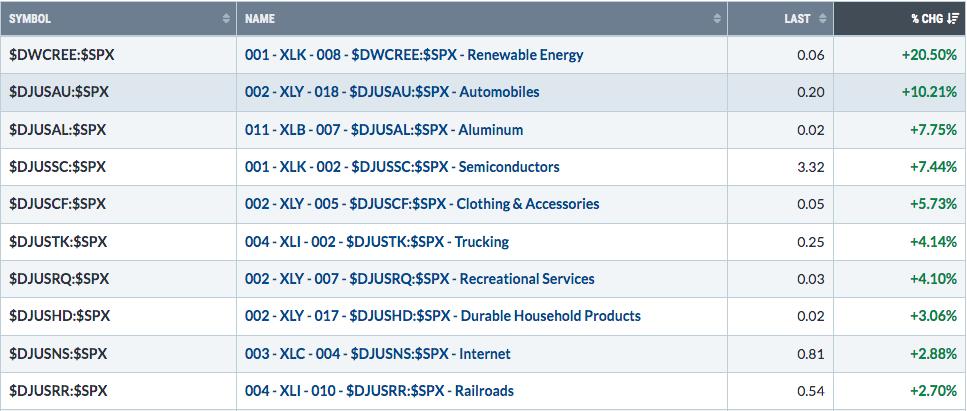
Top 10 Industries Last Week
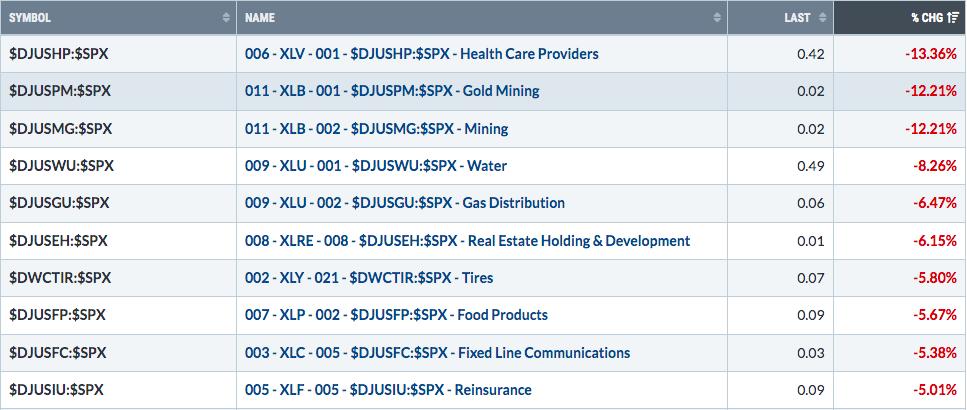
Bottom 10 Industries Last Week
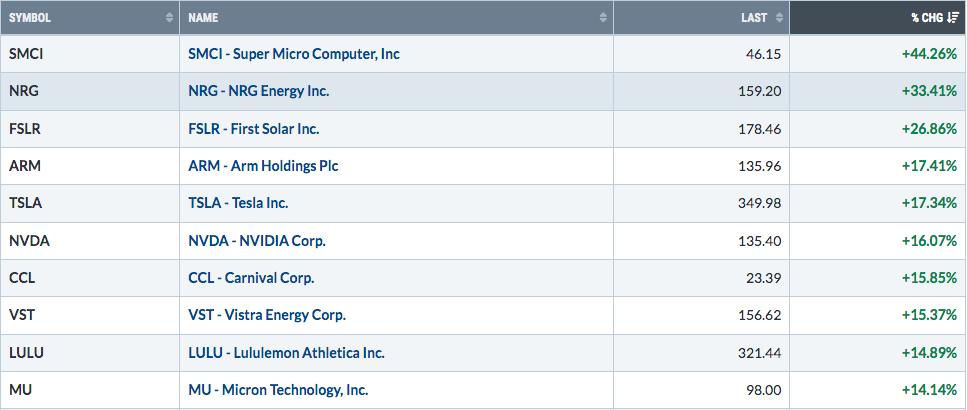
Top 10 Stocks - S&P 500/NASDAQ 100
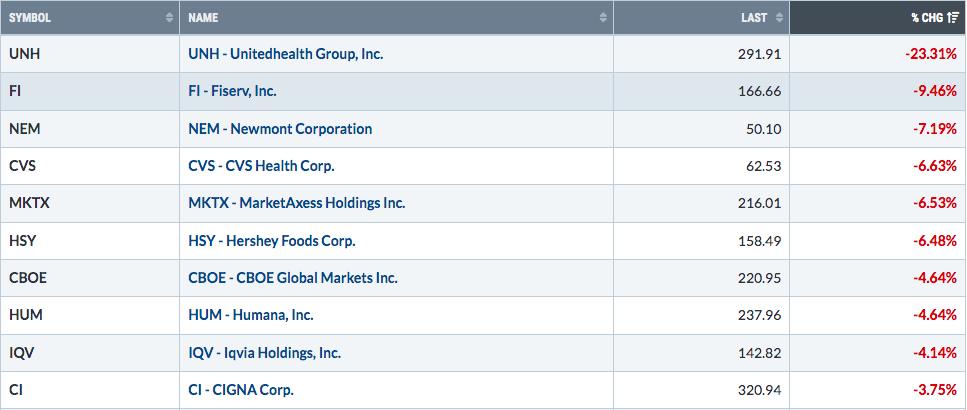
Bottom 10 Stocks - S&P 500/NASDAQ 100
Big Picture
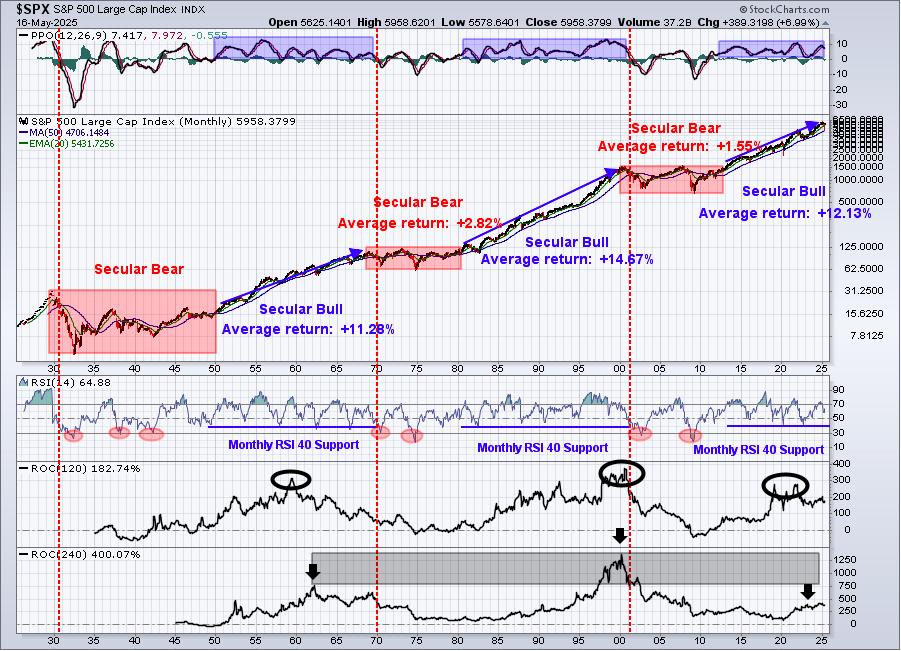
The long-term picture, which remains steadfastly bullish, continues to stress the importance of remaining on the long side long-term. There are times when we get a lot of warning signs and we have to decide how much risk we're willing to take. Those who prefer to avoid short-term trading should almost always be long. Ride the ups and downs, knowing that they are inevitable and understanding your unwillingness to try to time the market.
From a trading perspective, the short-term warning signs are much more impactful as a trader's first thought should be one of capital preservation. Trading is a business and cash is your only product. When you're out of cash, your business is bankrupt. Therefore, there's always a risk assessment to be made. Every day, or at least every week, you should be asking yourself questions like "is this trade worth the risk?" Or "do I want to remain in cash (during a selloff) and risk missing the bottom and turn to the upside in a secular bull market?"
Sustainability Ratios
Here's the latest look at our key intraday ratios as we follow where the money is traveling on an INTRADAY basis (ignoring gaps):
QQQ:SPY
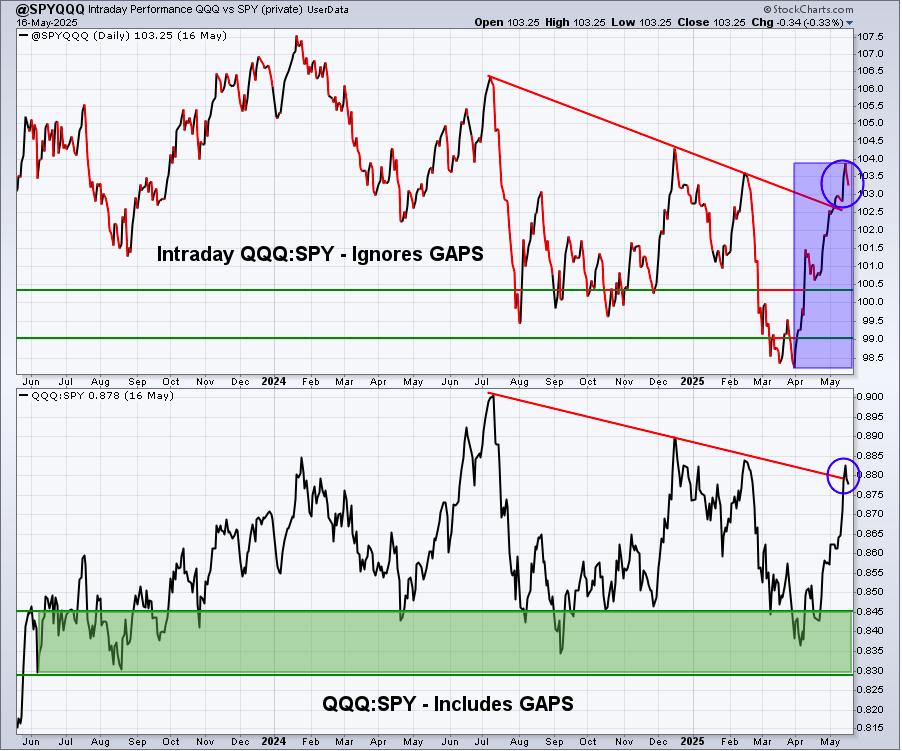
This intraday QQQ:SPY ratio has exploded to the upside, reeking of a "risk on" mentality. That's always a bullish signal for stocks. It doesn't mean we'll go every day and we could definitely see selling down to test rising 20-day EMAs. But I most certainly would not be thinking bearish thoughts about the market with this type of bullish signal.
IWM:QQQ
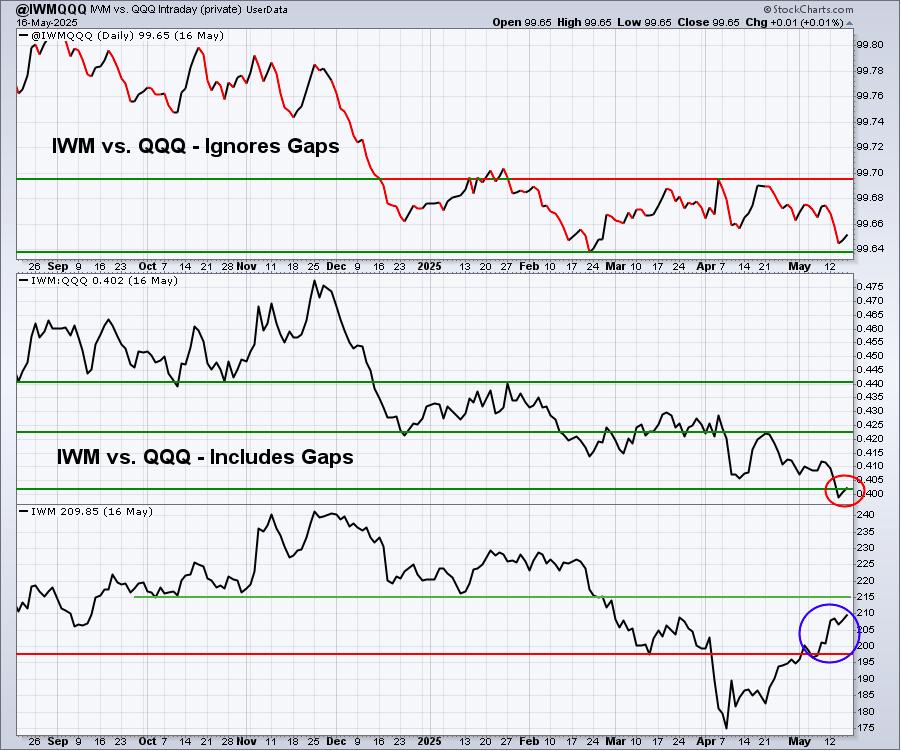
The IWM is doing a nice job of repairing its own absolute chart. However, the upper two panels on this chart are suggesting that the QQQ is the much better investment at the moment. I am still looking for that to change, but it may not happen until the Fed turns its attention to the economy and talks about and, eventually, lowers the fed funds rate. Right now, this asset class is "stuck."
XLY:XLP
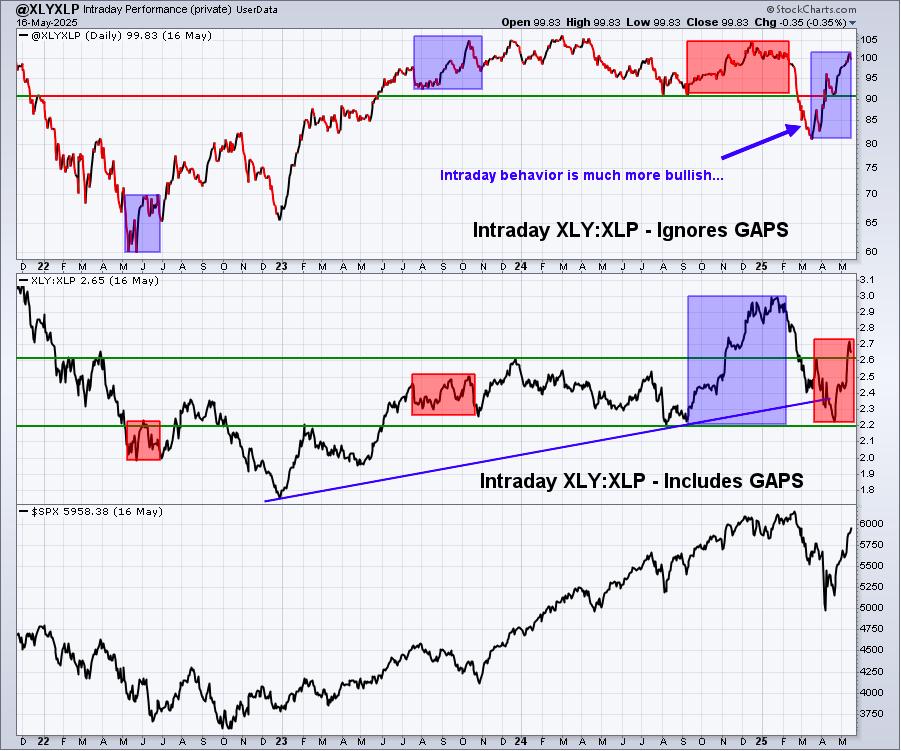
The rapidly-rising intraday ratio of the XLY:XLP has been painting an increasingly bullish picture since the March 13th low and there's really few intermarket relationships directionally that move so closely (positively) with the S&P 50. Given that very close tie, I find a rising XLY:XLP ratio to be quite comforting in supporting the notion that the S&P 500 will move higher as well - over time, of course. I don't look for both to move in the same direction every day or every week.
Sentiment
5-day SMA ($CPCE)
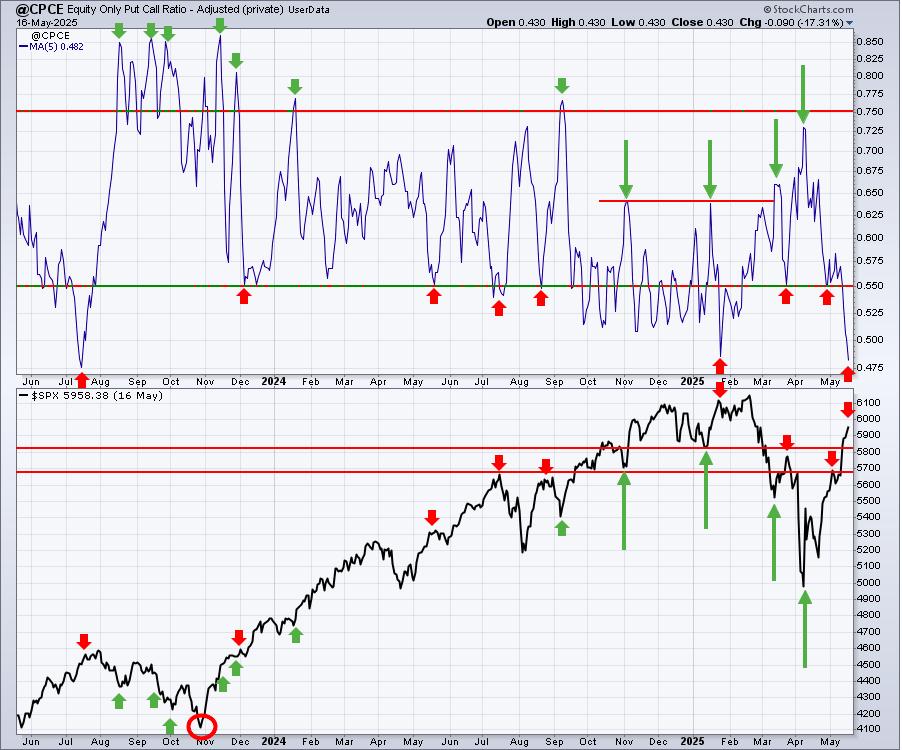
Sentiment indicators are contrarian indicators. When they show extreme bullishness, we need to be a bit cautious and when they show extreme pessimism, it could be time to become much more aggressive. Major market bottoms are carved out when pessimism is at its absolute highest level.
This is clearly a check mark in the bears' column. It's just one signal, but one that I tend to follow quite closely from a very short-term perspective. It doesn't always work and it certainly isn't working right now as the bulls have remained in complete control of the action for the past several weeks. As you know, I love the S&P 500 to go higher over time, which has now been my stance for weeks, but the short-term definitely has its risks. Should we fail to move higher after this morning's gap lower, we should be realistic and understand that a bit deeper pullback is a possibility that could take us down towards the rising 20-day EMA. Sentiment certainly supports this idea right now.
253-day SMA ($CPCE)
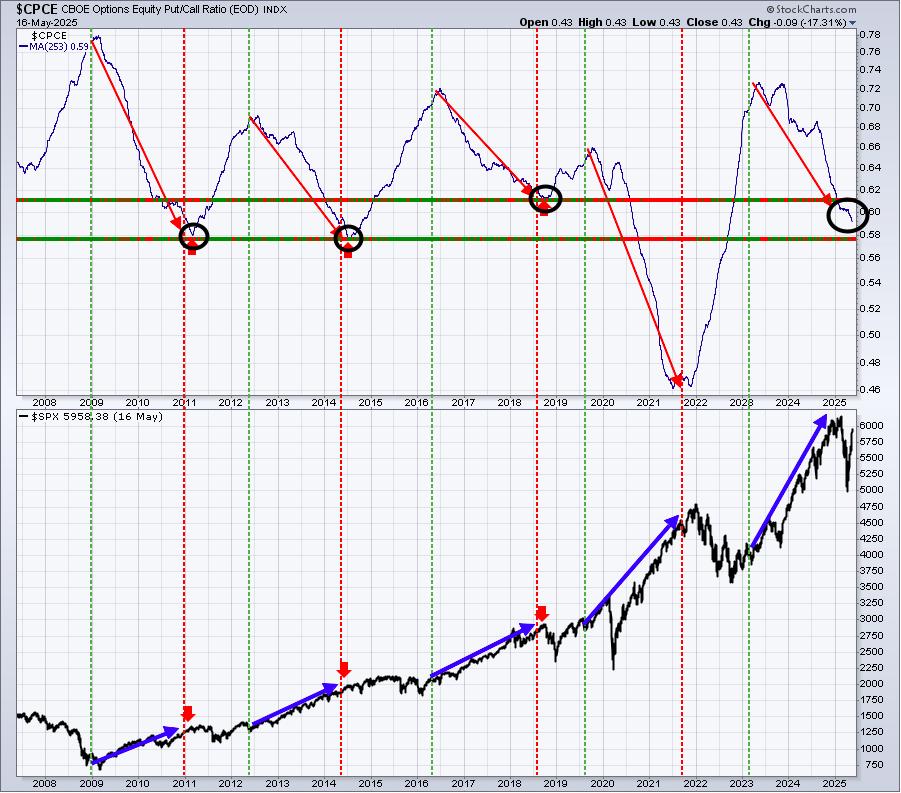
The 253-day SMA of the CPCE has yet to find a bottom. The history of this long-term reading on the CPCE is that when it goes down, the stock market soars. It's still going down, so I believe it fully supports continuing upside. When it does eventually turn back to the upside, keep in mind it doesn't mean the market will collapse or that we'll be entering a bear market. Look at the period from 2014-2016. The CPCE was rising throughout this period, but there were lots of ups and downs and, ultimately, it turned out to be a period of consolidation. The rise of the 253-day SMA of the CPCE tells us that there's widespread nervousness that's growing and that can coincide with either a bear market brewing or a lot of back and forth action.
We could see this 253-day SMA fall for several more months or even a year or more, while the S&P 500 gains ground to 7000, 8000, or higher and THEN see a period of consolidation where this 253-day SMA begins to curl higher and rise.
Growth vs Value
"Risk on" can be portrayed via growth vs. value ratios. When growth leads, it's a general indication that market participants believe the stock market will go higher and will, therefore, want to be invested in this more aggressive area of the market. Conversely, when value leads, it means the opposite. Here's a chart of the S&P 500 showing that money has returned, on a relative basis, to risk on assets in a big, big way:
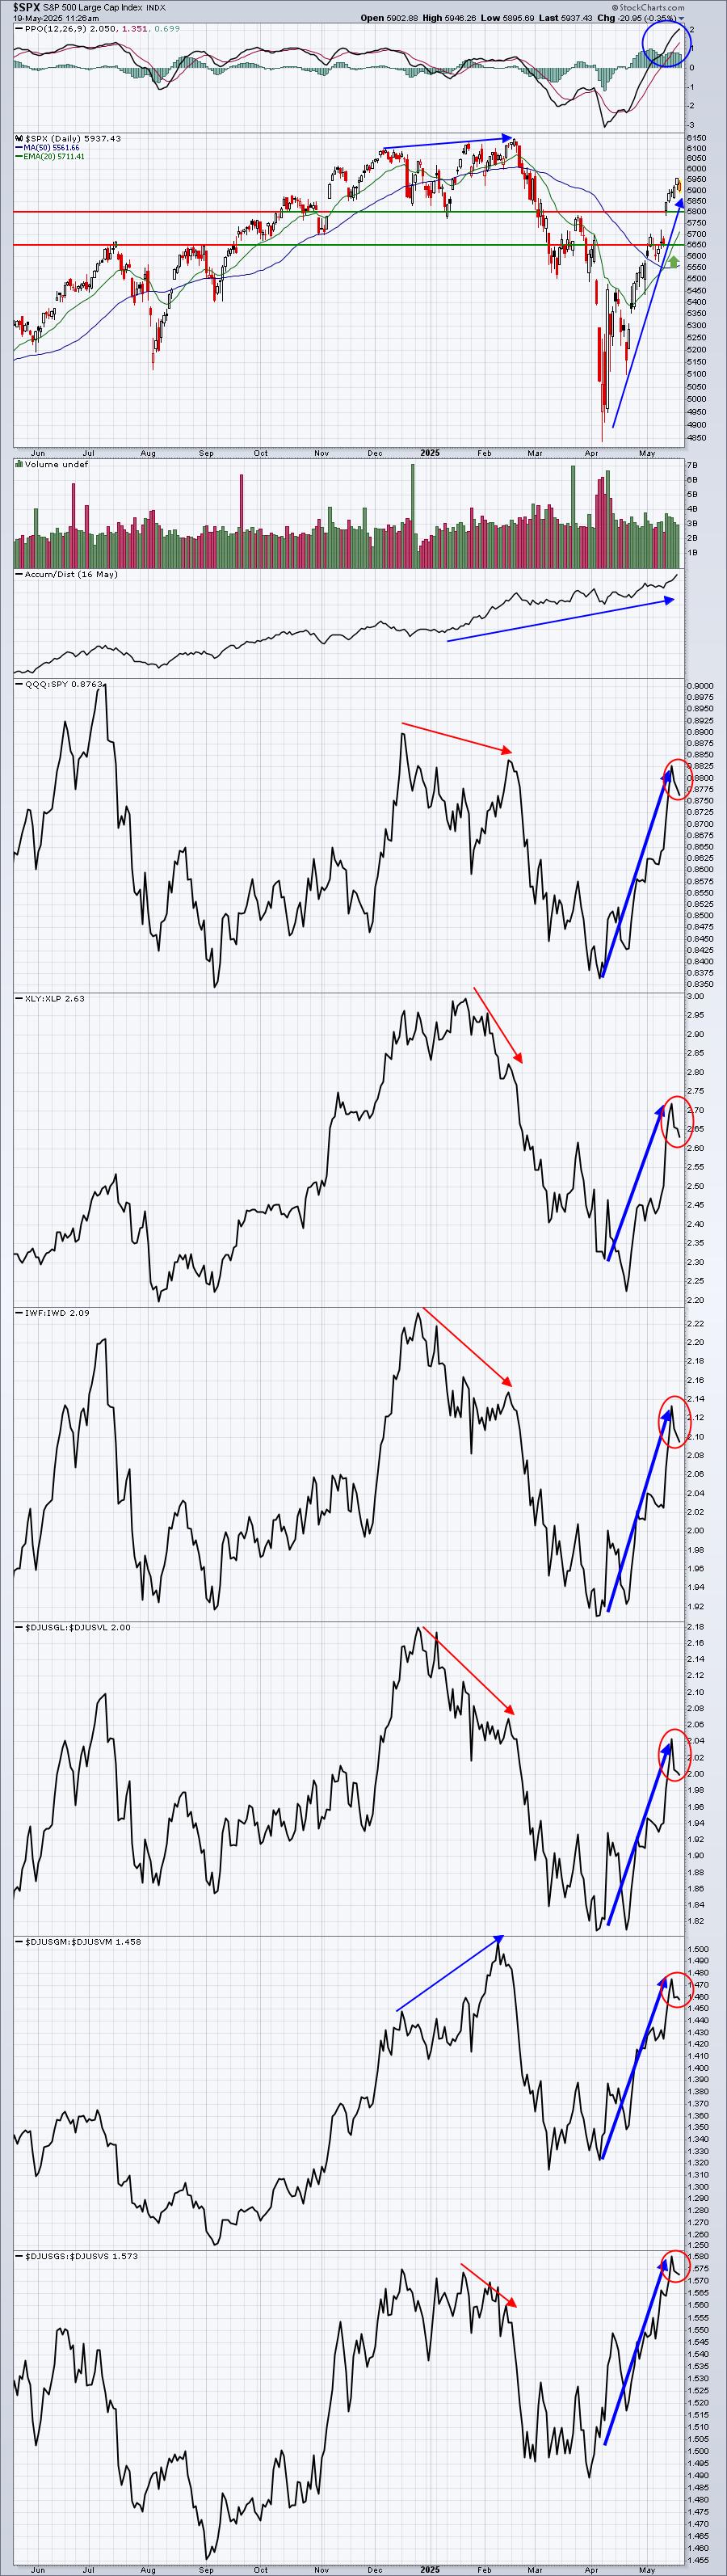
This bodes well for the long-term performance of the S&P 500, in my opinion.
But take a look at what these charts are telling us. As the S&P 500 rose up to print its final high on February 19th, money was rotating heavily into value vs. growth. Only mid-cap growth was an exception and even that area of the market collapsed into the latter part of February, following the other growth areas lower. Then divert your attention to the April 7th low and rebound on the S&P 500. Check out these growth vs. value ratios. They've soared! Over the past few days to a week, however, growth has started to weaken again. Watch these ratios closely over the next few days. If growth underperforms, then I'd be expecting a drop in the S&P 500 - perhaps down to the rising 20-day EMA. If growth outperforms and these ratios hit new highs again, then I doubt the major indices will fall much.
Long-Term Trade Setup
Since beginning this Weekly Market Report in September 2023, I've discussed the long-term trade candidates below that I really like. Generally, these stocks have excellent long-term track records, and many pay nice dividends that mostly grow every year. Only in specific cases (exceptions) would I consider a long-term entry into a stock that has a poor or limited long-term track record and/or pays no dividends. Below is a quick recap of how I viewed their charts one week ago:
- JPM - April shows a successful 20-month EMA test
- BA - printed triple bottom around 120-125, now trending higher
- FFIV - solid long-term uptrend, bouncing off 20-month EMA test
- MA - another bouncing off 20-month EMA test
- GS - 20-month EMA test as well
- FDX - double top established near 300, key uptrend line support approaching near 180
- AAPL - tested 50-month SMA in April for first time since last trade war
- CHRW - successfully testing gap support, now trying to hold onto 50-month SMA
- JBHT - has broken down on multiple time frames, would look for bottom in the 110-120 area
- STX - recent low may have established Point D in an A-B-C-D-E ascending triangle
- HSY - first step to repair technical picture would be monthly close above 180
- DIS - renewed strength after quadruple bottom at 80
- MSCI - now in a wide 485-650 trading range; still consolidating following a lengthy decade-long advance
- SBUX - might be poised for another test of key price support from 65 to 70
- KRE - attempting to hold both 20-month EMA and 50-month SMA support
- ED - seeing some weakness recently, but long-term pattern has been quite bullish
- AJG - few stocks have been steadier to the upside over the past decade
- NSC - long-term cup with handle pattern?
- RHI - rough trading in 2025, massive support at 30, should it get that far
- ADM - tested long-term price support in low 40s, could be starting significant reversal back to the upside
- BG - 65-70 level remains quite significant, I expect it to hold
- CVS - significant improvement in 2025, first test of 50-month SMA resistance failing thus far
- IPG - 4-year support at 23 level tested, nice to see bounce back to 25
- HRL - support over past 2 years still holding around 27.50
- DE - strength seems to be building here
Keep in mind that our Weekly Market Reports favor those who are more interested in the long-term market picture. Therefore, the list of stocks above are stocks that we believe are safer (but nothing is ever 100% safe) to own with the long-term in mind. Nearly everything else we do at EarningsBeats.com favors short-term momentum trading, so I wanted to explain what we're doing with this list and why it's different.
Also, please keep in mind that I'm not a Registered Investment Advisor (and neither is EarningsBeats.com nor any of its employees) and am only providing (mostly) what I believe to be solid dividend-paying stocks for the long term. Companies periodically go through adjustments, new competition, restructuring, management changes, etc. that can have detrimental long-term impacts. Neither the stock price nor the dividend is ever guaranteed. I simply point out interesting stock candidates for longer-term investors. Do your due diligence and please consult with your financial advisor before making any purchases or sales of securities.
Looking Ahead
Upcoming Earnings
Very few companies will report quarterly results until mid-April. The following list of companies is NOT a list of all companies scheduled to report quarterly earnings, however, just key reports, so please be sure to check for earnings dates of any companies that you own. Any company in BOLD represents a stock in one of our portfolios and the amount in parenthesis represents the market capitalization of each company listed:
- Monday: None
- Tuesday: HD ($376 billion), PANW ($128 billion), KEYS ($28 billion)
- Wednesday: TJX ($149 billion), LOW ($130 billion), MDT ($110 billion), SNOW ($60 billion)
- Thursday: INTU ($185 billion), ADI ($113 billion), WDAY ($73 billion), ADSK ($63 billion)
- Friday: None
Key Economic Reports
- Monday: April leading indicators
- Tuesday: None
- Wednesday: None
- Thursday: Initial jobless claims, May PMI composite flash, April existing home sales
- Friday: April new home sales
Historical Data
I'm a true stock market historian. I am absolutely PASSIONATE about studying stock market history to provide us more clues about likely stock market direction and potential sectors/industries/stocks to trade. While I don't use history as a primary indicator, I'm always very aware of it as a secondary indicator. I love it when history lines up with my technical signals, providing me with much more confidence to make particular trades.
Below you'll find the next two weeks of historical data and tendencies across the three key indices that I follow most closely:
S&P 500 (since 1950)
- May 19: -25.73%
- May 20: -11.95%
- May 21: -9.62%
- May 22: +8.23%
- May 23: -40.38%
- May 24: -5.11%
- May 25: -15.90%
- May 26: +54.11%
- May 27: +57.71%
- May 28: +5.44%
- May 29: +22.50%
- May 30: +47.64%
- May 31: +31.78%
- Jun 1: +54.02%
NASDAQ (since 1971)
- May 19: -42.21%
- May 20: -13.61%
- May 21: +17.75%
- May 22: +32.59%
- May 23: -56.44%
- May 24: +16.31%
- May 25: +15.82%
- May 26: +106.29%
- May 27: +160.41%
- May 28: +42.58%
- May 29: -41.39%
- May 30: +32.36%
- May 31: -8.12%
- Jun 1: +73.91%
Russell 2000 (since 1987)
- May 19: -41.25%
- May 20: -28.38%
- May 21: +82.95%
- May 22: -12.79%
- May 23: -48.01%
- May 24: -10.50%
- May 25: +38.88%
- May 26: +170.50%
- May 27: +209.58%
- May 28: +0.99%
- May 29: +4.64%
- May 30: +46.49%
- May 31: +24.72%
- Jun 1: +113.13%
The S&P 500 data dates back to 1950, while the NASDAQ and Russell 2000 information date back to 1971 and 1987, respectively.
Final Thoughts
Well, it's May and we're once again rocking & rolling. So much for the "Go Away in May" theorists. In fact, check out the seasonality on the S&P 500:
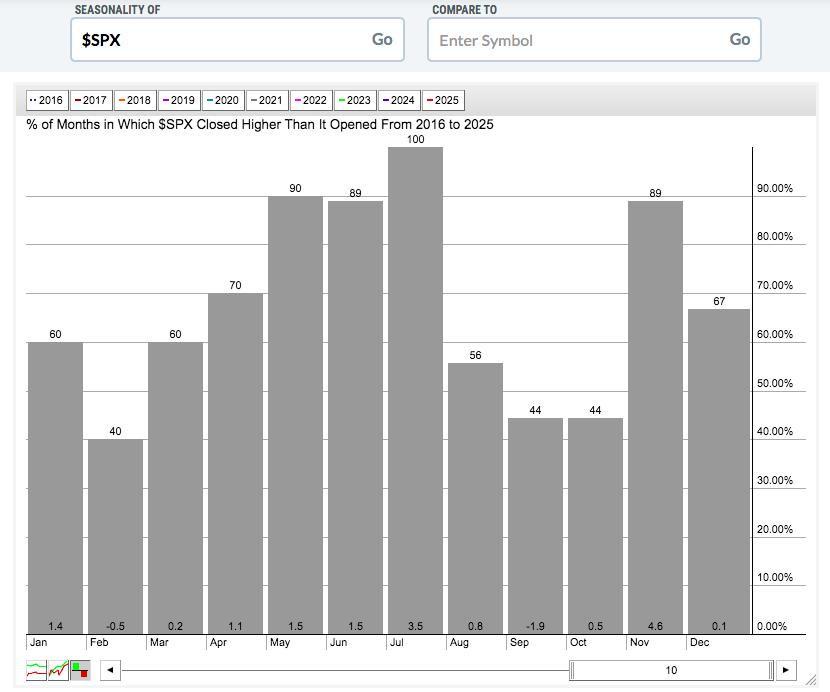
That's the last decade, which covers much of this secular bull market advance. There has been no better 3-consecutive-month period than May though July - July has been up EVERY year! Yet the media will announce the death of the stock market when April ends. It's just another perfect example of media outlets doing ZERO independent research and simply scaring many unsuspecting retail traders. I began my seasonality research in the late 1990s and have been updating it for over a quarter of a century. I believe I am the leading authority on seasonality, though I'm guessing Jeff Hirsch, editor of the Stock Trader's Almanac (STA), might disagree. I've read the STA and I believe my research is better and deeper in many areas. I might be a little biased, though. :-)
The true go away period is from the July 17th close through the September 26th close. These dates are based on S&P 500 performance since 1950.
Here are a few things I'm thinking about this week:
- Tariffs and Trade War. Any developments here are followed closely by the media and definitely have a stock market impact, warranted or not.
- Leadership. I mentioned this earlier. If "risk on" areas of the market lead "risk off" areas, the bears will have tremendous difficulty moving the S&P 500 much lower. If "risk off" leads, however, then we could finally get that much anticipated pull back.
- Technical Levels. As I look at the daily S&P 500 chart, I see a very strong AD line, suggesting that Wall Street accumulation is quite real. I'm also seeing hollow candle day after day, which is a further sign of bullish accumulation. Initial price support on the S&P 500, in my view, is from 5786 to 5807. Next would be the rising 20-day EMA, currently at 5712.02. Finally, I'd be watching the bottom of gap support from May 9th at 5660. I'll be very surprised if any pull back takes us below all 3 of these support levels.
- Earnings. They were strong. We currently have 500 companies on our Strong Earnings ChartList (SECL) and this list will likely grow over the next 2-3 weeks. In addition, our Raised Guidance ChartList (RGCL) now has 357 companies on it, which is a very high number historically. What this tells me is that all the fears of Q1 earnings shrinking and future guidance being reduced was nothing more than media hype. It helped to create fear in many retail traders who sold at exactly the wrong time.
- Seasonality. I featured this above, but I can tell you that the last week of May and the first few days of June tend to be extremely strong. That will start next week, but it's good to keep this in the back of your mind if we do see some selling this week.
Happy trading!
Tom