
EB Weekly Market Report - Monday, June 16, 2025
ChartLists/Spreadsheets Updated
The following ChartLists/Spreadsheets were updated over the weekend:
- Strong Earnings (SECL)
- Strong Future Earnings (SFECL)
- Raised Guidance (RGCL)
- Bullish Trifecta (BTCL)**
- Leading Stocks (LSCL)
- Manipulation Spreadsheet
- Upcoming Earnings & Upcoming Earnings Relative Strength
** I made a change this weekend on the BTCL. Usually, I run a scan of the SECL, SADCL, and the RGCL and whichever stocks are on all 3 of those ChartLists make up the BTCL. Typically, there are 35 to 45 stocks on the BTCL at any given time. This weekend, I ran a scan of only the SECL and RGCL. That returned many more stocks obviously. From there, I reviewed the AD lines of all of the stocks returned from this scan. If I felt the AD line was strong or showing considerable recent strength, then I included it on the BTCL. This resulted in probably twice as many stocks being included. Just an FYI.
The ChartLists should be available to download into your StockCharts Extra or Pro account, if you have a StockCharts membership. Otherwise, we can send you an Excel file with the stocks included in these ChartLists in order to download them into other platforms.
The Manipulation Spreadsheet has been updated for our 3 primary index ETFs - SPY, QQQ, and IWM and our 12 individual stocks - AAPL, MSFT, NVDA, META, GOOGL, AMZN, TSLA, NFLX, AMD, JPM, PLTR, and CLS. I review this Excel file weekly. It is not meant to be updated and studied daily.
If you have any questions, please reach out to us at "[email protected]".
Weekly Market Recap
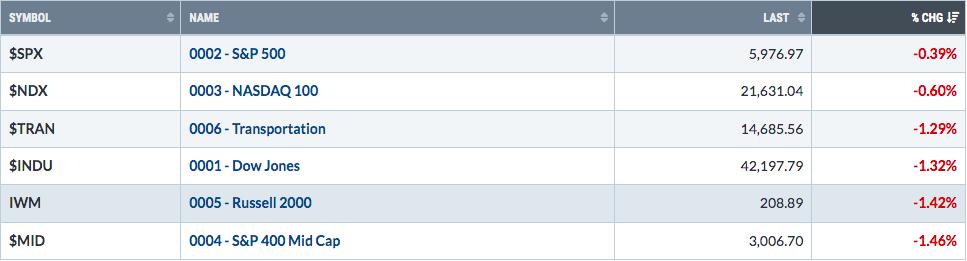
Major Indices
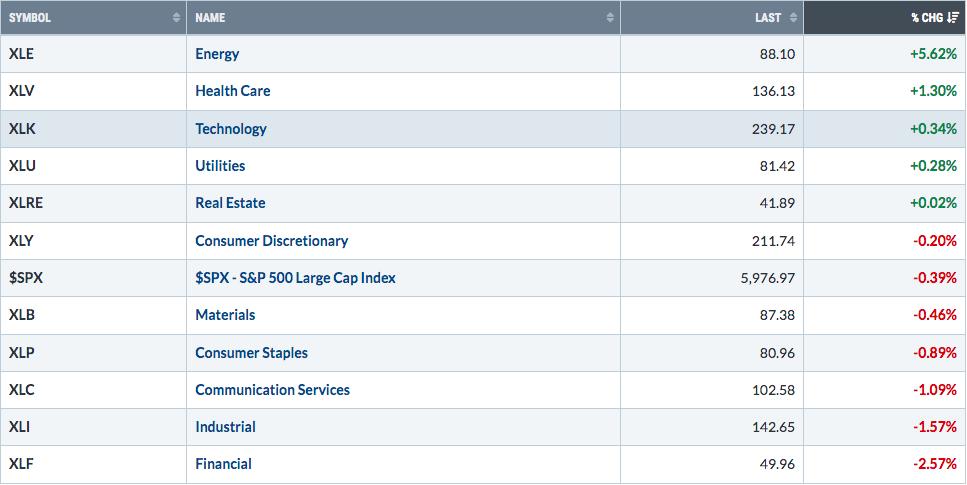
Sectors
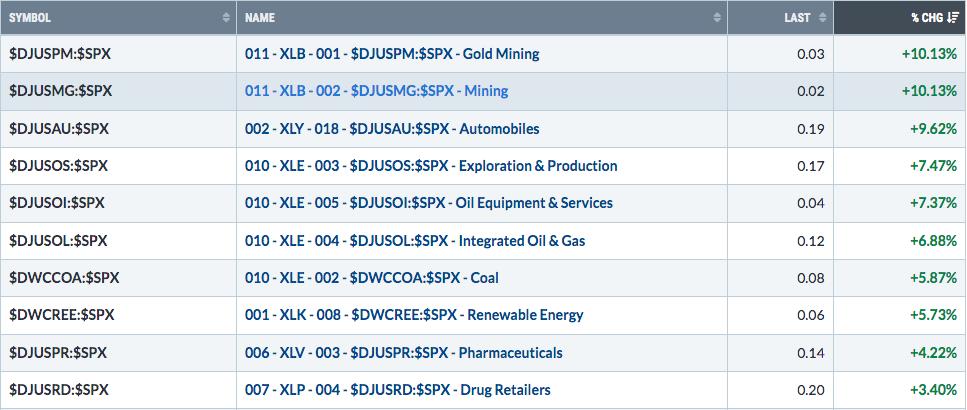
Top 10 Industries Last Week
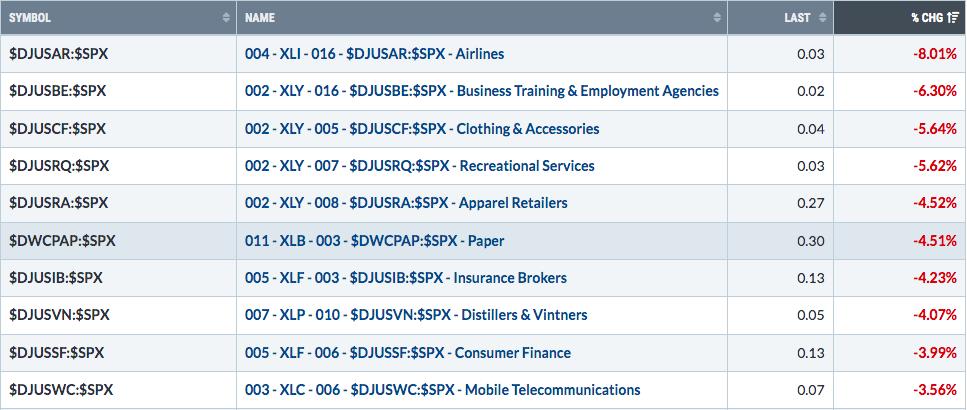
Bottom 10 Industries Last Week
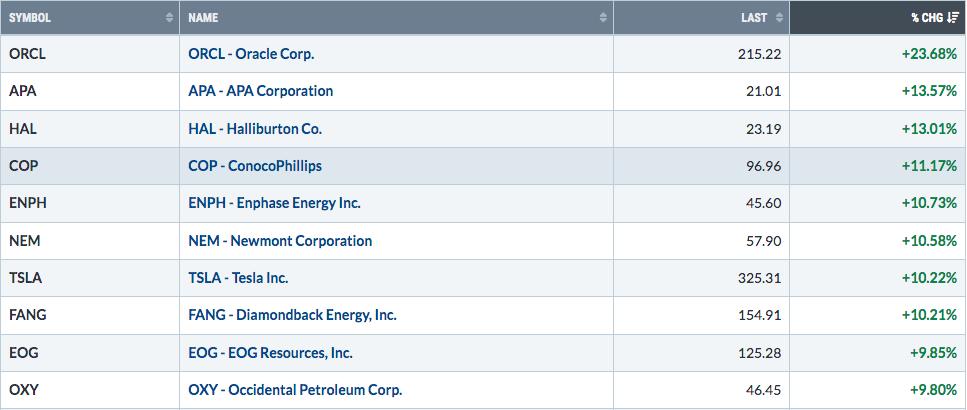
Top 10 Stocks - S&P 500/NASDAQ 100
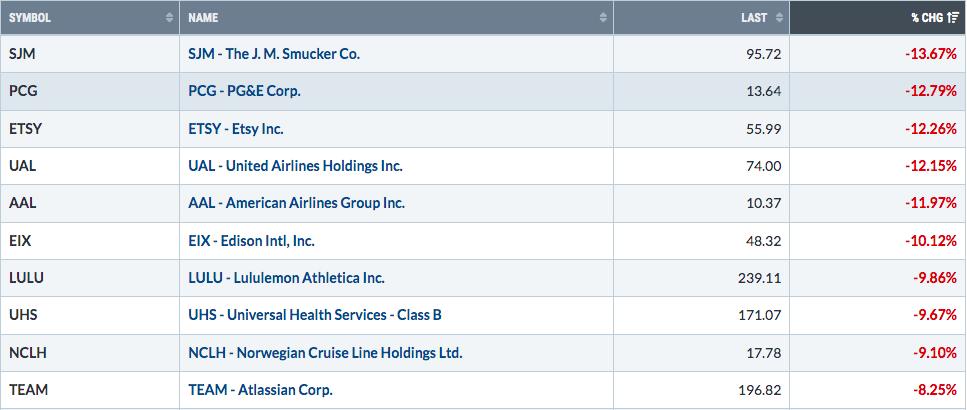
Bottom 10 Stocks - S&P 500/NASDAQ 100
Big Picture
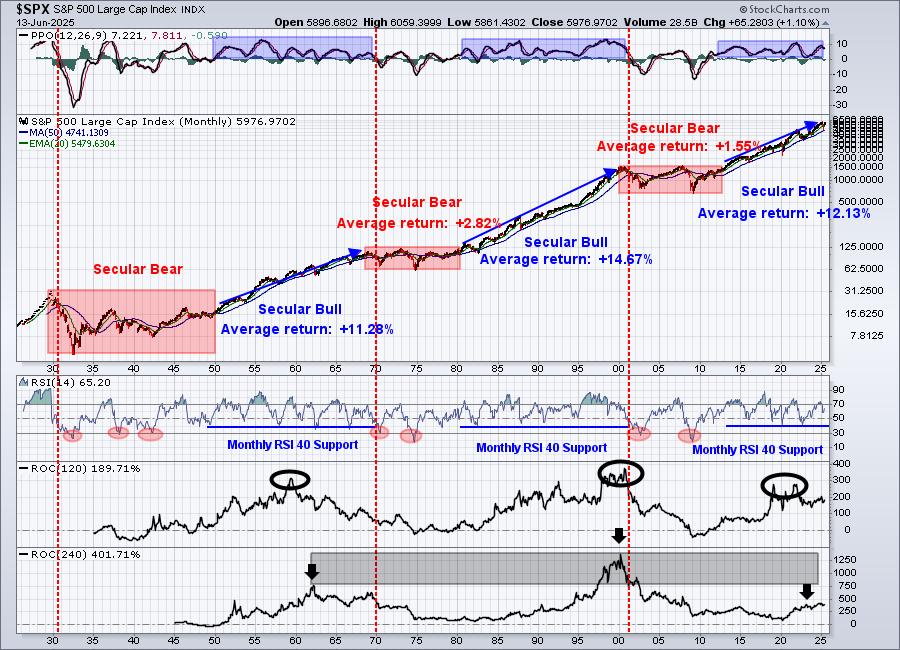
The bit of selling that we saw last week was contained. I know it's easy to be swayed by negative price action and media hype, but really pay attention to the monthly PPO and monthly RSI as confirmation of a potential secular bear market. We'll have another one, but I don't believe we'll see it until the next decade, sometime in the 2030s.
Also, if things really begin to take a turn for the worse, we've had a strong history of calling those bigger problems before they've occurred. I'm a big believer that the charts will warn us TRUTHFULLY long before all of our media friends <sarcasm>. Two of those signals are our sustainability ratios and sentiment, both of which I talk about every single week here in the Weekly Market Report.
Sustainability Ratios
Here's the latest look at our key intraday ratios as we follow where the money is traveling on an INTRADAY basis (ignoring gaps):
QQQ:SPY
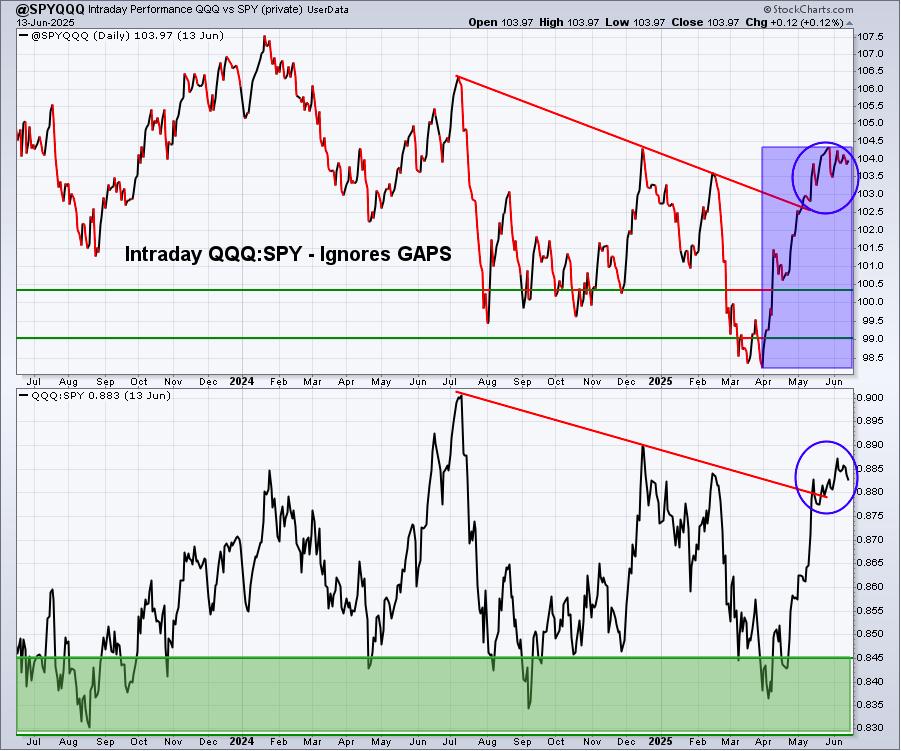
We've seen a lot of strength in this sustainability ratio off the April bottom. While our major indices pulled back last week and the benchmark S&P 500 is hesitating just below the all-time high of 6144, there's been no damage whatsoever to the longer-term picture here, which I believe remains extremely bullish.
IWM:QQQ
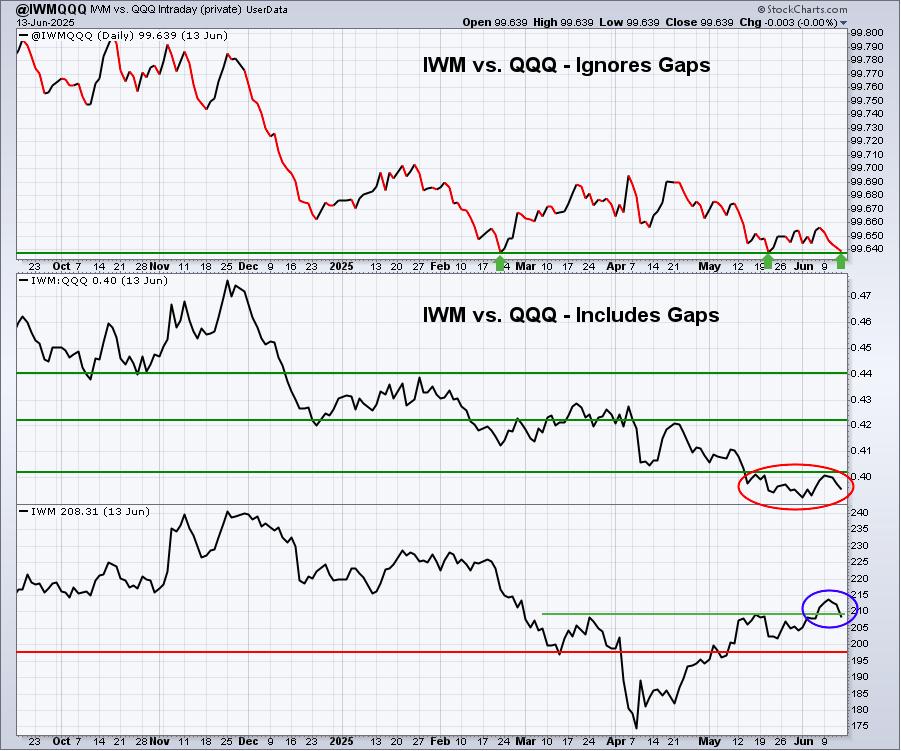
Small caps remain the biggest disappointment in the stock market, as far as I'm concerned. I certainly have not given up on them, but their relative underperformance suggests that we're not likely to get a fed funds rate cut any time soon.
XLY:XLP
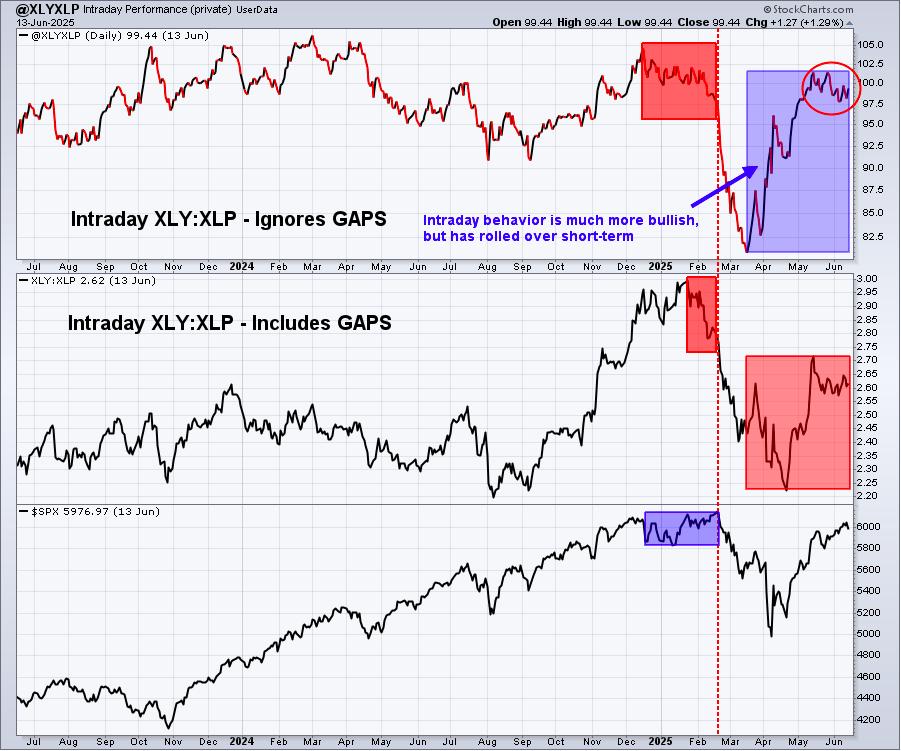
As I often say, this sustainability ratio is my favorite, simply because of such strong ties between consumer group performance and the direction of the S&P 500.
Sentiment
5-day SMA ($CPCE)
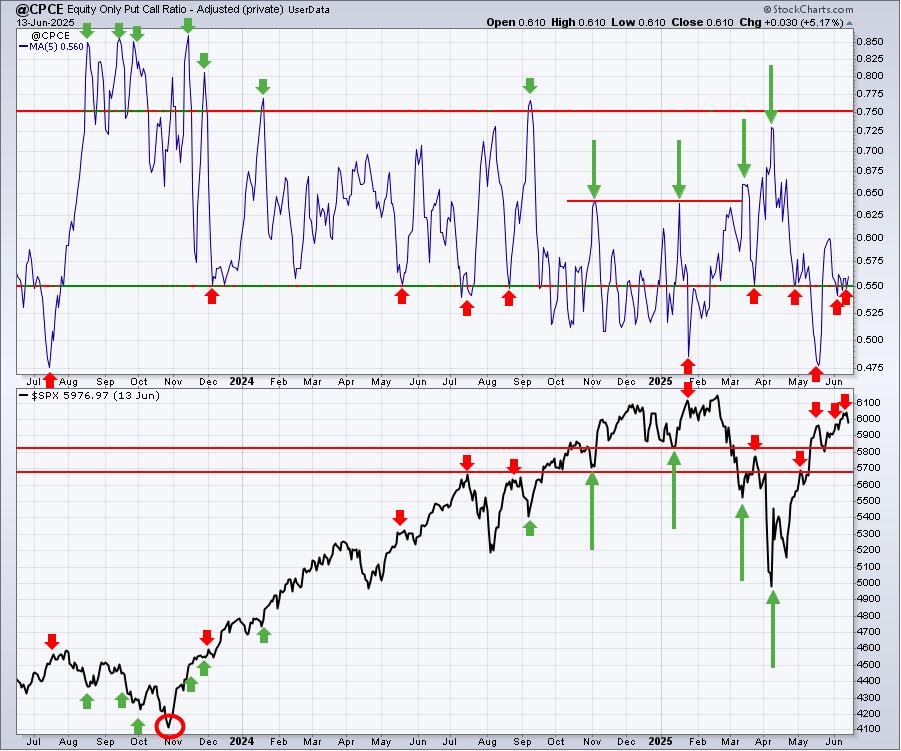
Sentiment indicators are contrarian indicators. When they show extreme bullishness, we need to be a bit cautious and when they show extreme pessimism, it could be time to become much more aggressive. Major market bottoms are carved out when pessimism is at its absolute highest level.
U.S. stocks remain in a solid uptrend off the April 7th low. The 5-day CPCE is a very short-term indicator, but it does look a bit toppy. Just keep in mind that low 5-day SMA readings of the CPCE have not been nearly as effective at calling tops as the high 5-day SMA readings have been at calling bottoms.
253-day SMA ($CPCE)
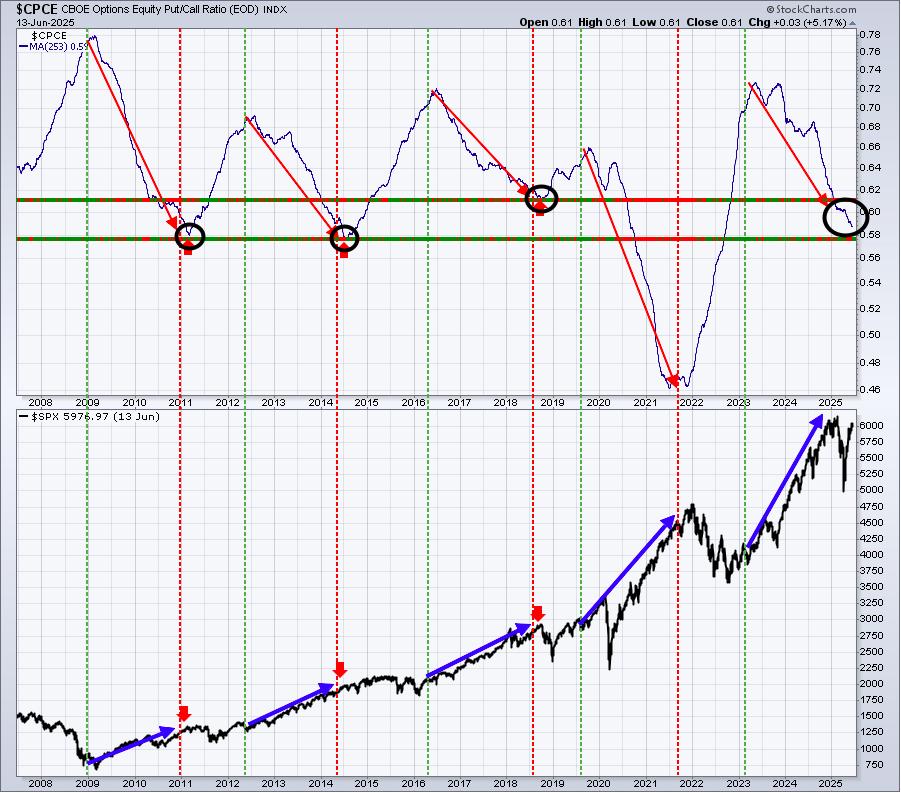
The most bullish stock market action, historically, has occurred when this 253-day SMA of the CPCE has been in steady decline, which is where we remain. We don't know where this will bottom and turn higher. I won't try to predict where it will turn, but when it does, we should begin to grow a bit more skeptical of this current secular bull market advance.
Long-Term Trade Setup
Since beginning this Weekly Market Report in September 2023, I've discussed the long-term trade candidates below that I really like. Generally, these stocks have excellent long-term track records, and many pay nice dividends that mostly grow every year. Only in specific cases (exceptions) would I consider a long-term entry into a stock that has a poor or limited long-term track record and/or pays no dividends. Below is a quick recap of how these stocks looked two weeks ago:
- JPM - working its way back to all-time high
- BA - there's a decent chance BA has bottomed long-term; AD line is moving up with price now
- FFIV - very bullish action above its 20-month SMA
- MA - very steady and bullish long-term performer
- GS - trending higher above 20-month EMA
- FDX - double top established near 300-310, key uptrend line support approaching near 180
- AAPL - monthly RSI at 50, which has been an excellent time to buy AAPL over the past two decades
- CHRW - remains in multi-decade uptrend
- JBHT - 110-120 area was excellent support/resistance range in 2018-2020; we recently approached it again
- STX - broke out of A-B-C-D-E ascending triangle, with long-term measurement to roughly 175-180
- HSY - still trending down with excellent price support near 140
- DIS - held 80 support once again in April, now looking for key breakout above 125
- MSCI - long-term consolidation since 2021 high is bullish, but need breakout above 650 level
- SBUX - in lower end of 4-5 year trading range, excellent entry here from a long-term perspective
- KRE - has bounced nicely from April washout low
- ED - has been a solid income-producer and investment since the financial crisis low in 2009
- AJG - few stocks have been steadier to the upside over the past decade
- NSC - long-term cup with handle pattern? Breakout above 280 would confirm and measure to 380
- RHI - rough trading in 2025, massive support at 30, should it get that far
- ADM - continues to trade above long-term price support in low 40s
- BG - multiple price support tests near 70 in 2025
- CVS - excellent support at 45 or just below, just failed on bounce at 50-month SMA at 72
- IPG - monthly RSI now at 37 and also testing 4-year price support near 22.50
- HRL - long-term price support at 25 and stock now showing positive divergence on monthly chart - bullish
- DE - one of the better 2025 momentum stocks on this list
Keep in mind that our Weekly Market Reports favor those who are more interested in the long-term market picture. Therefore, the list of stocks above are stocks that we believe are safer (but nothing is ever 100% safe) to own with the long-term in mind. Nearly everything else we do at EarningsBeats.com favors short-term momentum trading, so I wanted to explain what we're doing with this list and why it's different.
Also, please keep in mind that I'm not a Registered Investment Advisor (and neither is EarningsBeats.com nor any of its employees) and am only providing (mostly) what I believe to be solid dividend-paying stocks for the long term. Companies periodically go through adjustments, new competition, restructuring, management changes, etc. that can have detrimental long-term impacts. Neither the stock price nor the dividend is ever guaranteed. I simply point out interesting stock candidates for longer-term investors. Do your due diligence and please consult with your financial advisor before making any purchases or sales of securities.
Looking Ahead
Upcoming Earnings
Very few companies will report quarterly results until mid-April. The following list of companies is NOT a list of all companies scheduled to report quarterly earnings, however, just key reports, so please be sure to check for earnings dates of any companies that you own. Any company in BOLD represents a stock in one of our portfolios and the amount in parenthesis represents the market capitalization of each company listed:
- Monday: LEN ($30 billion)
- Tuesday: None
- Wednesday: None
- Thursday: None
- Friday: ACN ($199 billion), KR ($43 billion), DRI ($25 billion)
Key Economic Reports
- Monday: June empire state manufacturing index
- Tuesday: FOMC meeting begins, May retail sales, May industrial production & capacity utilization, April business inventories, June housing market index
- Wednesday: May housing starts & building permits, initial jobless claims, FOMC announcement
- Thursday: None - Stock Market Closed
- Friday: June Philadelphia Fed manufacturing index, May leading indicators
Historical Data
I'm a true stock market historian. I am absolutely PASSIONATE about studying stock market history to provide us more clues about likely stock market direction and potential sectors/industries/stocks to trade. While I don't use history as a primary indicator, I'm always very aware of it as a secondary indicator. I love it when history lines up with my technical signals, providing me with much more confidence to make particular trades.
Below you'll find the next two weeks of historical data and tendencies across the three key indices that I follow most closely:
S&P 500 (since 1950)
- Jun 16: +23.94%
- Jun 17: +18.36%
- Jun 18: -22.47%
- Jun 19: -13.07%
- Jun 20: -23.59%
- Jun 21: +13.57%
- Jun 22: -25.23%
- Jun 23: -8.82%
- Jun 24: -41.47%
- Jun 25: -14.74%
- Jun 26: -74.42%
- Jun 27: +0.14%
- Jun 28: +41.58%
- Jun 29: +6.42%
NASDAQ (since 1971)
- Jun 16: +55.20%
- Jun 17: +29.51%
- Jun 18: -55.29%
- Jun 19: +31.68%
- Jun 20: -46.79%
- Jun 21: +16.55%
- Jun 22: -33.43%
- Jun 23: +13.79%
- Jun 24: -36.28%
- Jun 25: -11.50%
- Jun 26: -39.49%
- Jun 27: -2.01%
- Jun 28: +81.88%
- Jun 29: +51.99%
Russell 2000 (since 1987)
- Jun 16: +10.36%
- Jun 17: +19.80%
- Jun 18: -34.90%
- Jun 19: -8.37%
- Jun 20: -69.95%
- Jun 21: +30.23%
- Jun 22: -75.31%
- Jun 23: -8.12%
- Jun 24: -121.65%
- Jun 25: +16.31%
- Jun 26: -10.86%
- Jun 27: +45.97%
- Jun 28: +122.28%
- Jun 29: +66.61%
The S&P 500 data dates back to 1950, while the NASDAQ and Russell 2000 information date back to 1971 and 1987, respectively.
Final Thoughts
The S&P 500 has been dancing just below all-time highs for over a week now. That all-time closing high of 6144 was set on February 19th and we have since seen a 21% cyclical bear market, followed by a breath-taking rally that's carried the S&P 500 to within less than 100 points of that all-time high close. This paints a very bullish long-term picture, in my view. Sustainability ratios, for the most part, support a further advance in U.S. stocks. Might we pull back and consolidate for a bit? It's possible, but I believe it's just as likely that we're talking about all-time highs within the next month.
By the way, the May CPI and PPI painted yet another very tame picture of inflation, just ahead of the Fed meeting this week.
Here are a few things I'm watching this week:
- Inflation. As I've been saying for years now.....what inflation? The annual rate of Core CPI has been falling nearly non-stop for 3 years. It's time for the Fed to lower rates.
- The Fed. Will the Fed lower rates this week? Highly doubtful. However, there are rumblings among Fed officials that don't necessarily agree with Fed Chief Powell that rates should continue to be held steady for much longer. There's a bit of talk that we're getting closer and closer to additional rate cuts. I'll be watching closely to see what these other Fed "voices" might have to say.
- Technical Outlook. In the very near-term, it's important that rising 20-day EMAs hold as support. In instances where daily negative divergences are present on the PPO, I'd instead look for support at 50-day SMAs.
- Crude Oil Prices ($WTIC). Crude oil prices have been skyrocketing as Middle East tensions escalate, resulting in leadership from the energy sector (XLE). This isn't a long-term issue, in my opinion, but it certainly could have a big impact in the near-term.
Happy trading!
Tom