
EB Weekly Market Report - Monday, June 23, 2025
Notes
I just wanted to let everyone know that everything went great last week and we're back at it this morning full tilt! We obviously saw the U.S. strike Iran's nuclear sites on Saturday, adding a bit to the uncertainty and trepidation felt in the stock market by many. This latest variable really does nothing to my line of thinking, which remains that we're in a secular bull market and we're going to see all-time highs again in the not-too-distant future.
Crude oil prices ($WTIC, -0.22%) are relatively flat this morning, a bit of a surprise, but perhaps underscoring the idea that Saturday's bombing was not a shock to Wall Street. Most commodities are lower at the time of this writing. Cryptocurrencies took an initial hit over the weekend, but have rebounded this morning as well.
Stock futures were relatively flat heading into today's opening bell.
ChartLists/Spreadsheets Updated
The following ChartLists/Spreadsheets were updated over the weekend:
- Strong Earnings (SECL)
- Strong Future Earnings (SFECL)
- Raised Guidance (RGCL)
- Leading Stocks (LSCL)**
- Manipulation Spreadsheet*
*We are in the process of adding a more stocks to our Manipulation Spreadsheet and you'll see that a few were added over the weekend. It's all a part of our research process, trying to glean a bit more information out of what's transpired thus far in 2025.
**I'm working on this ChartList right now and it should be available later this afternoon.
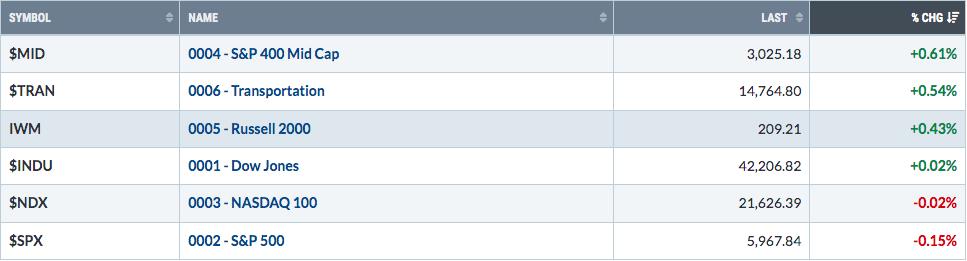
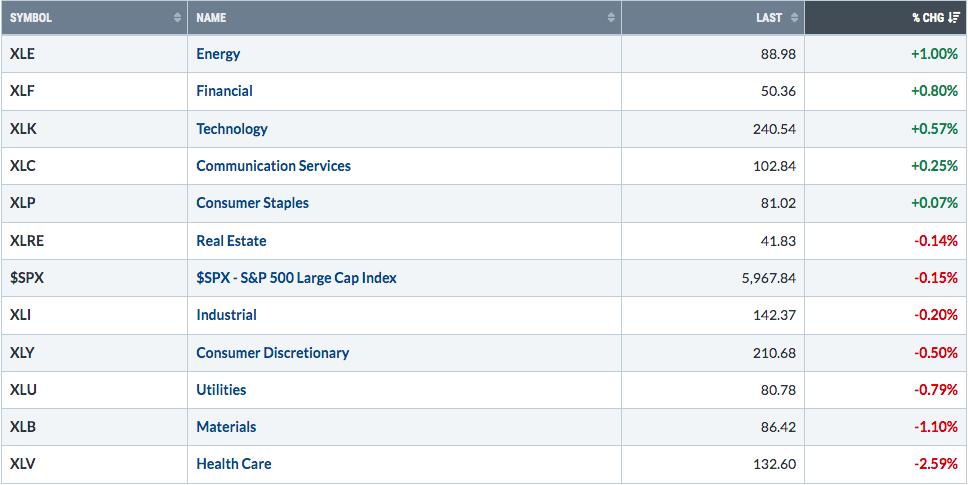
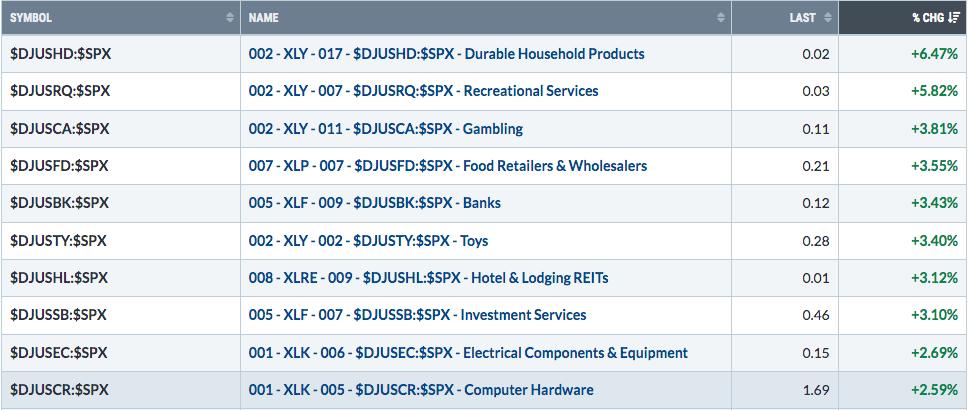
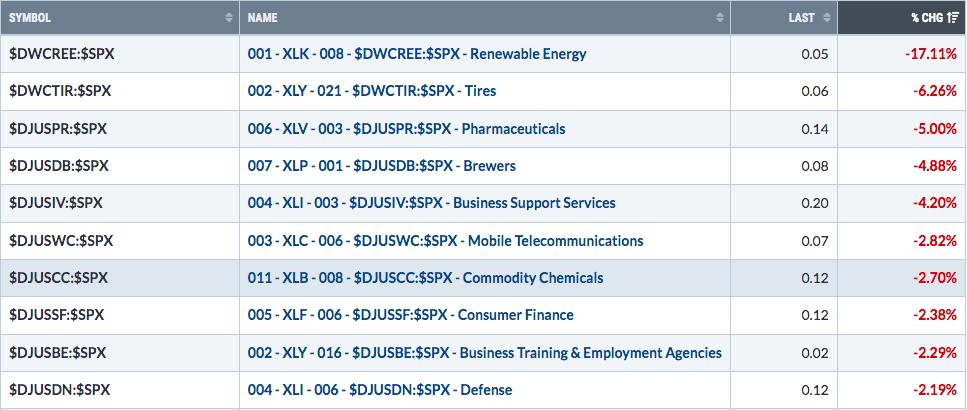
Weekly Market Recap
Major Indices
Sectors
Top 10 Industries Last Week
Bottom 10 Industries Last Week
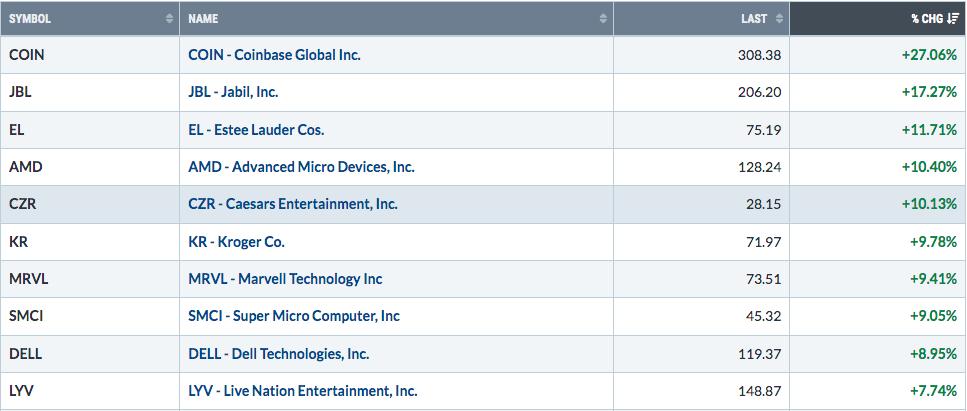
Top 10 Stocks - S&P 500/NASDAQ 100
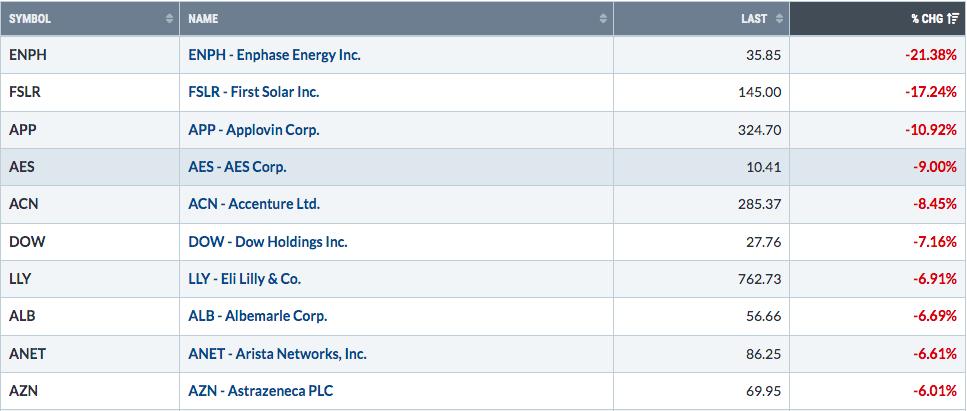
Bottom 10 Stocks - S&P 500/NASDAQ 100
Big Picture
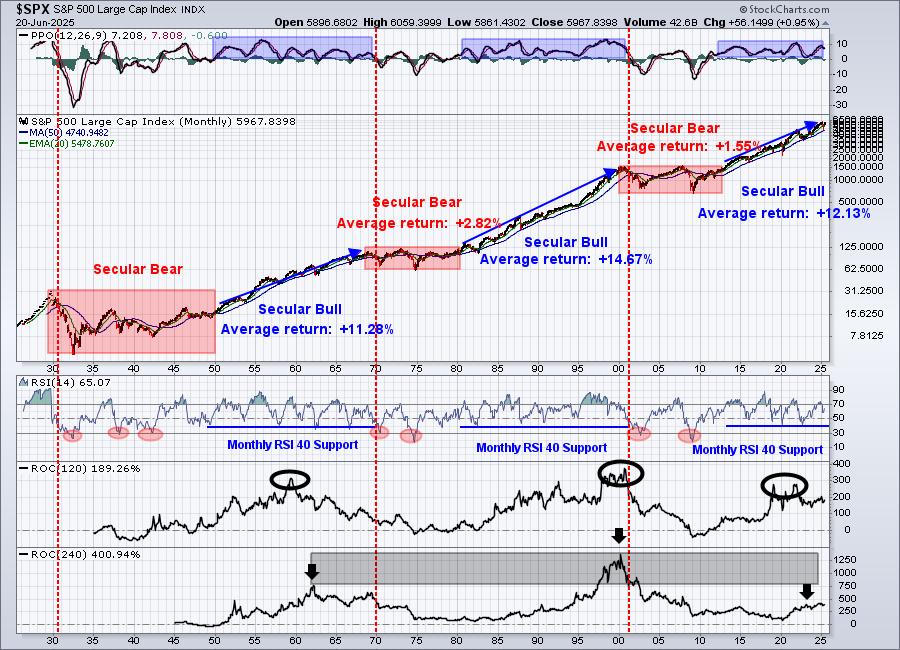
It was another week of back and forth action, which we should be expecting, by the way. Anytime a major price resistance level is neared or tested, we need to give the initial benefit of the doubt (at least short-term) to the bears and expect that they'll be selling into strength at such key levels. Eventually, the bulls will break through and we'll be off to the races, but for now, let's have some patience.
Sustainability Ratios
Here's the latest look at our key intraday ratios as we follow where the money is traveling on an INTRADAY basis (ignoring gaps):
QQQ:SPY
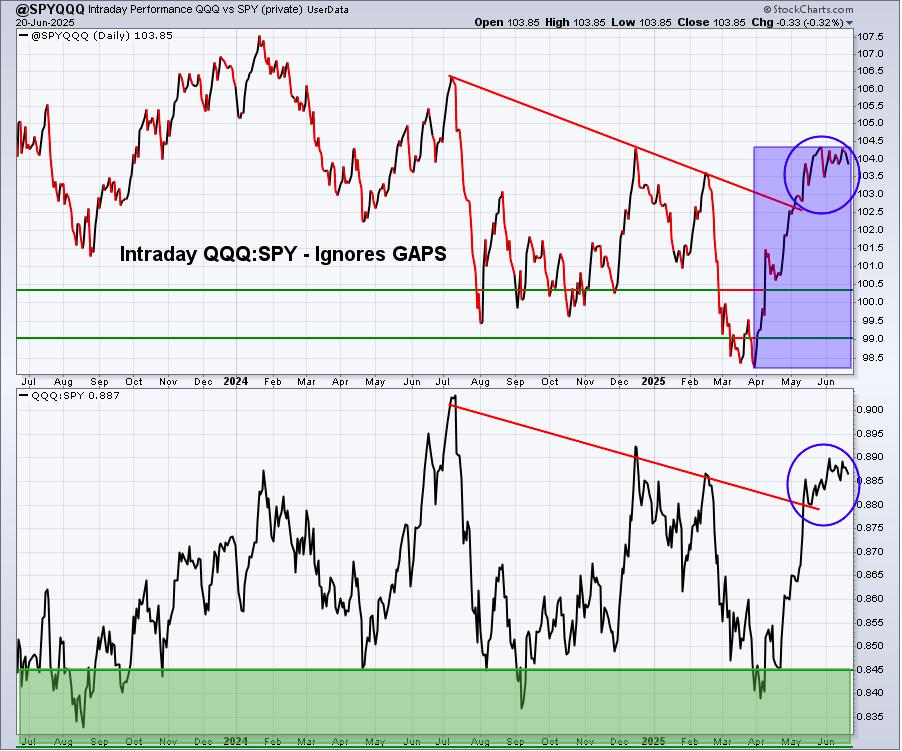
We've seen a lot of strength in this sustainability ratio off the April bottom. I'm now seeing a bit of hesitation. However, given the key overhead resistance, marked by all-time highs, it makes sense to see this hesitation. I remain very bullish, given the current look of all of our sustainability ratios.
IWM:QQQ
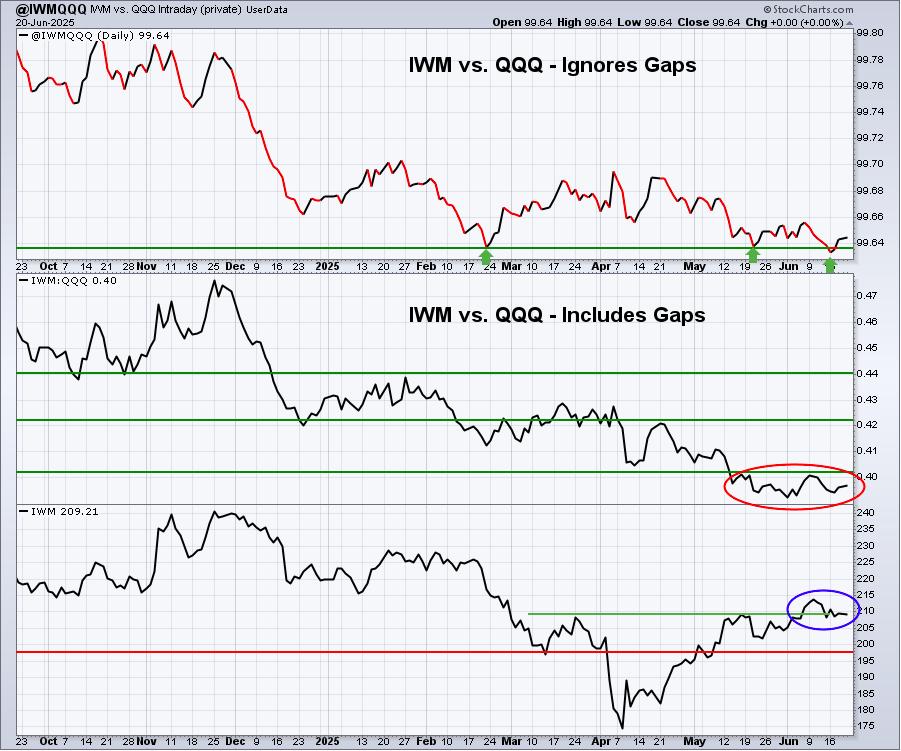
While I've seen a couple signs that the Fed will begin cutting rates again soon, most notably the recent drop in the 1-month treasury yield ($UST1M), the rotation to small caps is still lacking and would argue against a rate cut at this time. That'll likely change, but for now, the rate cut appears to be on hold.
XLY:XLP
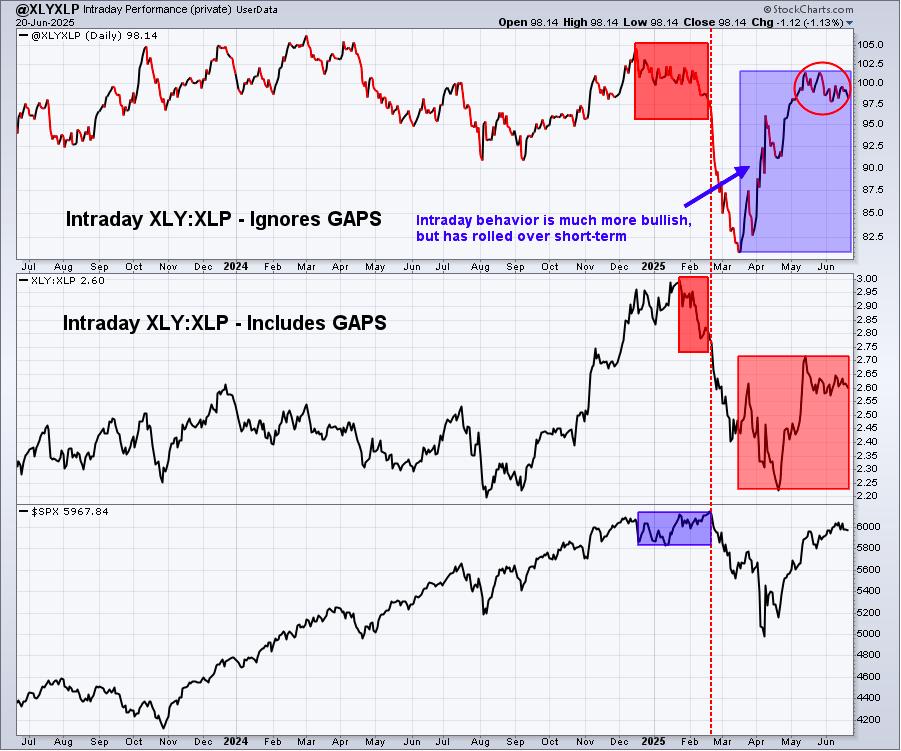
I pay very close attention to the XLY:XLP ratio and, more specifically, this INTRADAY XLY:XLP ratio. This chart continues to look extremely bullish to me. Money rotated HARD towards discretionary stocks on an intraday basis back in mid-March, signaling that much of the cyclical bear market damage had already been done and that a bottom was approaching. Now this ratio is WAY off its earlier low, after a stealth move higher, and is poised to move to new highs to support an S&P 500 breakout to an all-time high.
Sentiment
5-day SMA ($CPCE)
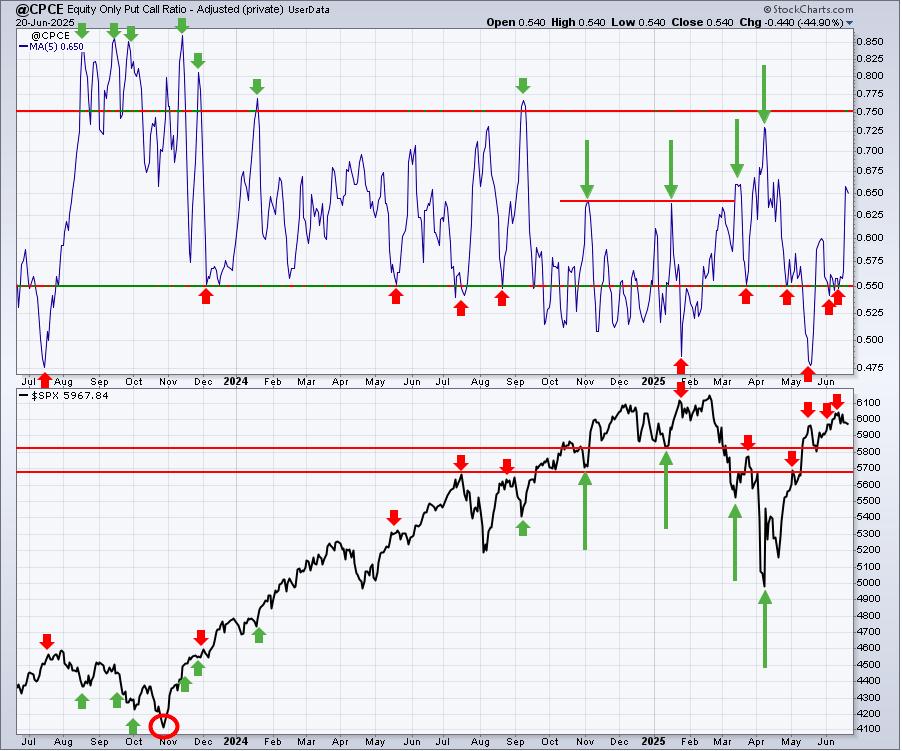
Sentiment indicators are contrarian indicators. When they show extreme bullishness, we need to be a bit cautious and when they show extreme pessimism, it could be time to become much more aggressive. Major market bottoms are carved out when pessimism is at its absolute highest level.
The S&P 500 has struggled a bit since we've seen 5-day SMA readings of the CPCE fall to the .55 area, a sign of market complacency and a possible short-term top. We're now right in the middle of the normal range and the CPCE is providing us no short-term directional clue at the moment.
253-day SMA ($CPCE)
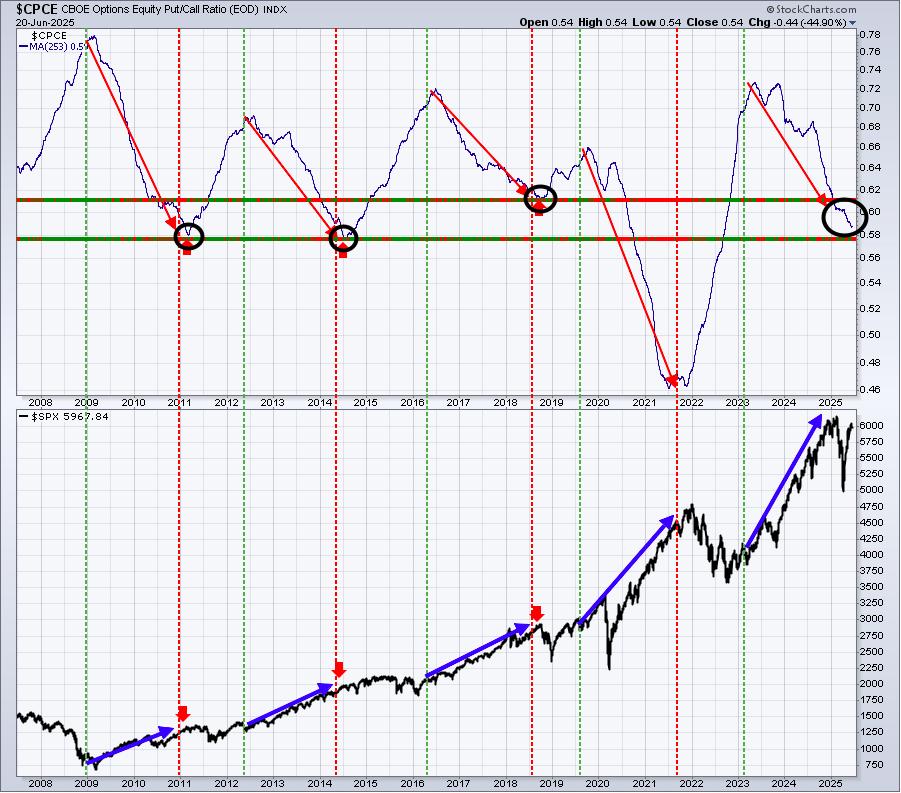
The most bullish stock market action, historically, has occurred when this 253-day SMA of the CPCE has been in steady decline, which is where we remain. We don't know where this will bottom and turn higher. I won't try to predict where it will turn, but when it does, we should begin to grow a bit more skeptical of this current secular bull market advance.
U.S. Dollar Update
As most of you are probably aware, I take my cues on the U.S. Dollar Index ($USD) from the relationship between the U.S. 10-year treasury yield and the German 10-year treasury yield ($UST10y-$DET10y). There's been a tremendous track record in this relationship calling the directional moves in the dollar ($USD). Currently, this relationship is suggesting the dollar will rise:
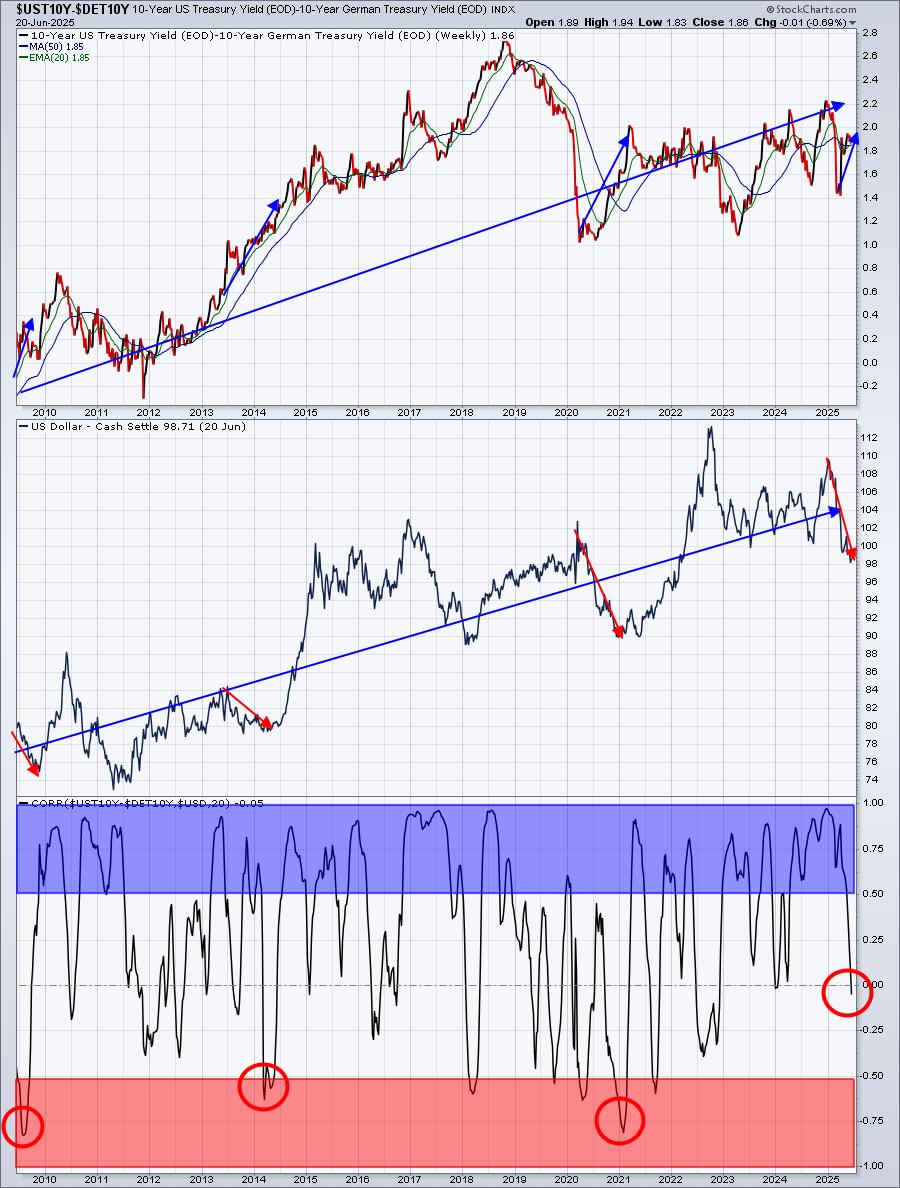
Overall, it seems rather obvious that as the UST10y-GER10y chart moves higher, so too does the dollar chart, right? Don't they both look like they're trending higher together? But they do go through brief periods where we see an inverse correlation. In other words, they will move in opposite directions and print a short-term inverse correlation (red circles above). Notice how the dollar is the one to play "catch up" in each instance, however? That's what I'm looking for in the days and weeks ahead. Perhaps we'll see a bit more inverse correlation first. But later, don't be surprised to see the dollar surge to make up lost ground.
What Will That Mean For Gold?
When I review gold ($GOLD), I always look at it from the standpoint of whether I believe it will outperform or underperform the benchmark S&P 500. Historically, gold outperforms the S&P 500 when 1 of 2 factors (or both) are present:
- Rapidly-declining dollar
- Rising volatility ($VIX)
The following charts should help to illustrate this:
Dollar and Gold
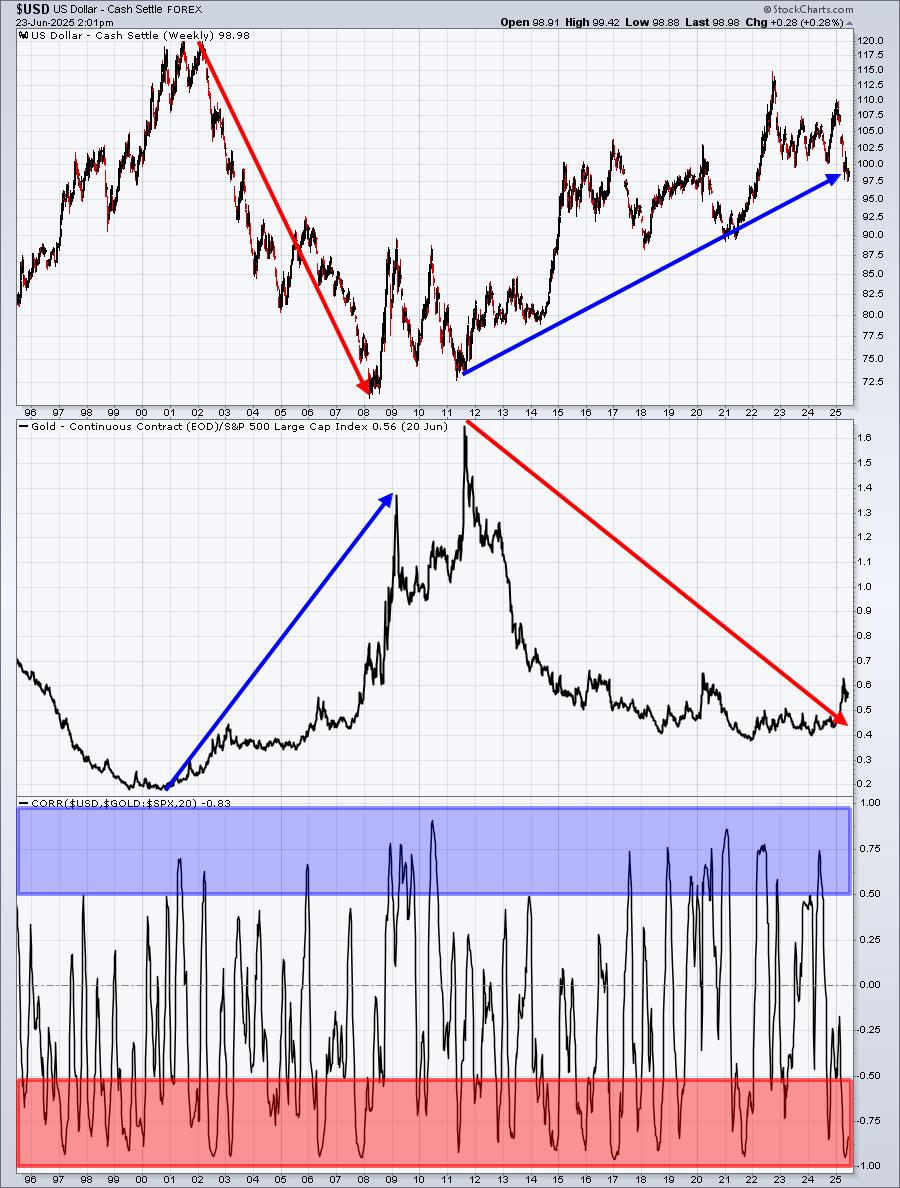
The red-shaded area highlights that the dollar and gold tend to move opposite one another. Now check out the same thing when we look at the VIX and gold.
VIX and Gold
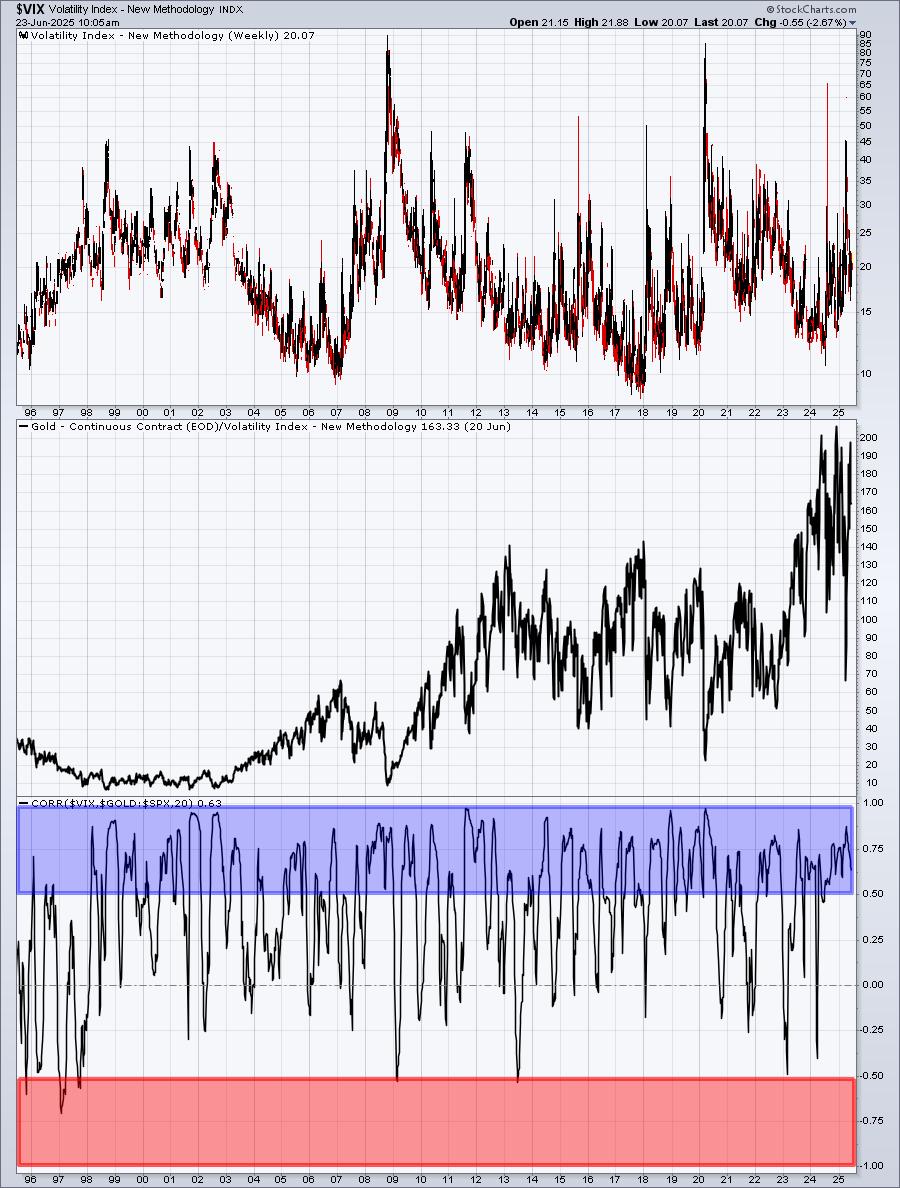
The VIX and gold move TOGETHER and in the SAME DIRECTION. That tells us that as fear builds and the VIX rises, so too does the relative performance of gold. Gold THRIVES on fear and a weak dollar.
Unfortunately for gold, I believe the S&P 500 is heading back to fresh all-time highs and the VIX will plummet. My UST10y-DET10y chart also suggests that the dollar will rise, potentially significantly. If the VIX falls and the dollar rises, both of those will work against gold.
I am NOT saying that gold will move lower, because I actually think it could move higher. However, I much prefer the S&P 500 over gold as a relative investment for the foreseeable future.
Long-Term Trade Setup
Since beginning this Weekly Market Report in September 2023, I've discussed the long-term trade candidates below that I really like. Generally, these stocks have excellent long-term track records, and many pay nice dividends that mostly grow every year. Only in specific cases (exceptions) would I consider a long-term entry into a stock that has a poor or limited long-term track record and/or pays no dividends. Below is a quick recap of how these stocks look currently:
- JPM - challenging all-time high
- BA - substantial improvement, would like to see 185-190 support hold
- FFIV - very bullish action above its 20-month SMA
- MA - very steady and bullish long-term performer
- GS - trending higher above 20-month EMA
- FDX - trying to clear falling 20-week EMA
- AAPL - monthly RSI at 50, which has been an excellent time to buy AAPL over the past two decades
- CHRW - 85-90 is solid longer-term support
- JBHT - would like to see 120-125 support hold
- STX - long-term breakout in play, excellent trade
- HSY - breaking above 175 would be intermediate-term bullish
- DIS - now testing key price resistance in 120-125 range
- MSCI - monthly RSI hanging near 50, solid entry
- SBUX - moved back above 50-week EMA, short-term bullish
- KRE - long-term uptrend remains in play
- ED - has been a solid income-producer and investment since the financial crisis low in 2009
- AJG - few stocks have been steadier to the upside over the past decade
- NSC - continues to sideways consolidate in very bullish fashion
- RHI - trending down with potential sight set on 30
- ADM - looks to be reversing higher off long-term price support near 43
- BG - 65-70 price support held, now looking to clear 50-week SMA to the upside
- CVS - excellent support at 45 or just below, just failed on bounce at 50-month SMA at 72
- IPG - monthly RSI now at 37 and also testing 4-year price support near 22.50
- HRL - long-term price support at 25 and stock now showing positive divergence on monthly chart - bullish
- DE - one of the better 2025 momentum stocks on this list
Keep in mind that our Weekly Market Reports favor those who are more interested in the long-term market picture. Therefore, the list of stocks above are stocks that we believe are safer (but nothing is ever 100% safe) to own with the long-term in mind. Nearly everything else we do at EarningsBeats.com favors short-term momentum trading, so I wanted to explain what we're doing with this list and why it's different.
Also, please keep in mind that I'm not a Registered Investment Advisor (and neither is EarningsBeats.com nor any of its employees) and am only providing (mostly) what I believe to be solid dividend-paying stocks for the long term. Companies periodically go through adjustments, new competition, restructuring, management changes, etc. that can have detrimental long-term impacts. Neither the stock price nor the dividend is ever guaranteed. I simply point out interesting stock candidates for longer-term investors. Do your due diligence and please consult with your financial advisor before making any purchases or sales of securities.
Looking Ahead
Upcoming Earnings
Very few companies will report quarterly results until mid-April. The following list of companies is NOT a list of all companies scheduled to report quarterly earnings, however, just key reports, so please be sure to check for earnings dates of any companies that you own. Any company in BOLD represents a stock in one of our portfolios and the amount in parenthesis represents the market capitalization of each company listed:
- Monday: None
- Tuesday: FDX ($54 billion)
- Wednesday: MU ($136 billion), PAYX ($54 billion), GIS ($29 billion)
- Thursday: NKE ($88 billion)
- Friday: None
Key Economic Reports
- Monday: May existing home sales
- Tuesday: April S&P Case-Shiller home price index, June consumer confidence
- Wednesday: May new home sales
- Thursday: Initial jobless claims, Q1 GDP (final), May durable goods, May pending home sales
- Friday: June consumer sentiment, May personal income & spending, May Core PCE index
Historical Data
I'm a true stock market historian. I am absolutely PASSIONATE about studying stock market history to provide us more clues about likely stock market direction and potential sectors/industries/stocks to trade. While I don't use history as a primary indicator, I'm always very aware of it as a secondary indicator. I love it when history lines up with my technical signals, providing me with much more confidence to make particular trades.
Below you'll find the next two weeks of historical data and tendencies across the three key indices that I follow most closely:
S&P 500 (since 1950)
- Jun 23: -8.82%
- Jun 24: -41.47%
- Jun 25: -14.74%
- Jun 26: -74.42%
- Jun 27: +0.14%
- Jun 28: +41.58%
- Jun 29: +6.42%
- Jun 30: +34.34%
- Jul 1: +72.77%
- Jul 2: +16.76%
- Jul 3: +77.19%
- Jul 4: +0.00% (market closed - holiday)
- Jul 5: +39.40%
- Jul 6: +22.32%
NASDAQ (since 1971)
- Jun 23: +13.79%
- Jun 24: -36.28%
- Jun 25: -11.50%
- Jun 26: -39.49%
- Jun 27: -2.01%
- Jun 28: +81.88%
- Jun 29: +51.99%
- Jun 30: +73.30%
- Jul 1: +63.18%
- Jul 2: -47.43%
- Jul 3: +46.02%
- Jul 4: +0.00% (market closed - holiday)
- Jul 5: +7.04%
- Jul 6: -10.79%
Russell 2000 (since 1987)
- Jun 23: -8.12%
- Jun 24: -121.65%
- Jun 25: +16.31%
- Jun 26: -10.86%
- Jun 27: +45.97%
- Jun 28: +122.28%
- Jun 29: +66.61%
- Jun 30: +99.14%
- Jul 1: +30.53%
- Jul 2: -113.05%
- Jul 3: +44.57%
- Jul 4: +0.00% (market closed - holiday)
- Jul 5: -4.89%
- Jul 6: -76.61%
The S&P 500 data dates back to 1950, while the NASDAQ and Russell 2000 information date back to 1971 and 1987, respectively.
Final Thoughts
We're in the summer months and we're close to all-time highs. Consolidation is the word of the day. It will take patience to allow some of the short-term overbought conditions to work their way through, while our major indices grow poised to make yet another breakout. I believe it's coming. Last week, the Fed does what it does best. It got in the way of a secular bull market one more time. I'm growing more convinced every day that the 4 cyclical bear markets that we've had under Fed Chief Powell's watch in just 7 YEARS (!!!) is not a coincidence. His legacy is that he arrives late to every party, disrupting the U.S. stock market in the process. He'll eventually get it right again and rates will be lowered. The stock market will be at all-time highs and many of you will defend Powell and ask, "what did he do wrong"? Well, if you ignore the 4 bear markets and the irreparable financial and psychological damage that it did to many unsuspecting retail investors/traders, then he did nothing wrong.
Unfortunately, many folks bailed on the stock market, because of the unnecessary volatility caused by this Fed. At EarningsBeats.com, we're out for the "little guy". We're trying to help our members build financial wealth and it certainly makes our job a lot more difficult when we have to face cyclical bear markets every two years.
And for those who want to turn this into a political battle, just please keep in mind that I had serious problems with the Fed during Biden's term as well. I am NOT politically motivated and most of you know that by now. I don't talk politics, I talk stocks and charts.
Here are a few things I'm watching this week:
- Technical Price Action. I continue to watch the all-time highs, believing new all-time highs could very well be right around the corner.
- Home Construction. The DJUSHB technically hit support near 2000 and is attempting to bounce. There are key economic reports in this group this week, including existing home sales, new home sales, pending home sales, and the Case-Shiller home price index.
- 10-Year Treasury Yield ($TNX). In conjunction with home construction, the TNX could play a key short-term role. We're threatening a move to a new 6-week low on the TNX right now.
- Crude Oil Prices ($WTIC). Well, after the bombing of Iranian nuclear sites on Saturday, I'd have expected the escalating Middle East tensions to send crude oil higher.....but it hasn't. What new developments might we have to face coming out of Iran later this week? And, will crude surge again?
Happy trading!
Tom