
EB Weekly Market Report - Monday, July 14, 2025
ChartLists/Spreadsheets Updated
The following ChartLists/Spreadsheets were updated over the weekend:
- Strong Earnings (SECL)
- Strong Future Earnings (SFECL)
- Raised Guidance (RGCL)
- Bullish Trifecta (BTCL)
- Leading Stocks (LSCL)
- Upcoming Earnings and Upcoming Earnings Relative Strength
- Manipulation Spreadsheet
Weekly Market Recap
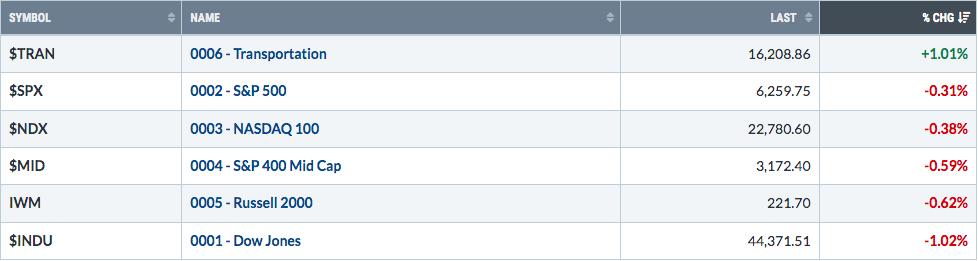
Major Indices
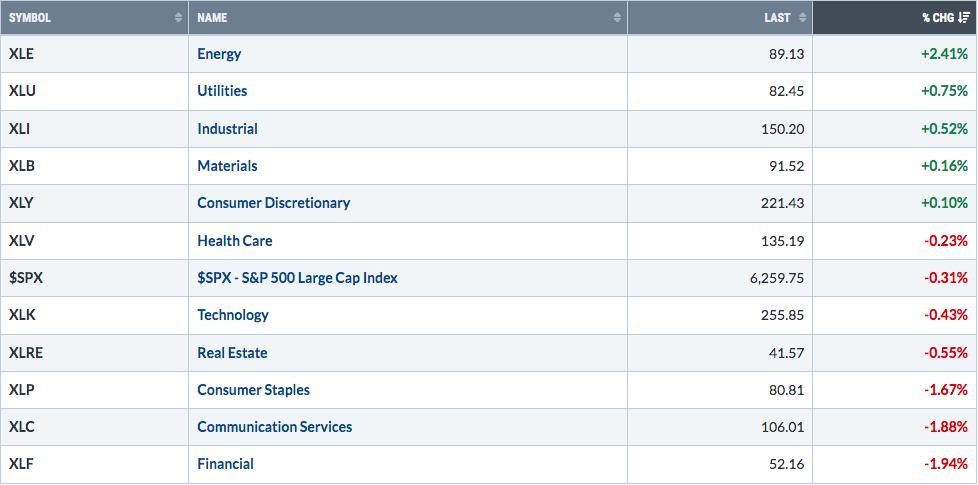
Sectors
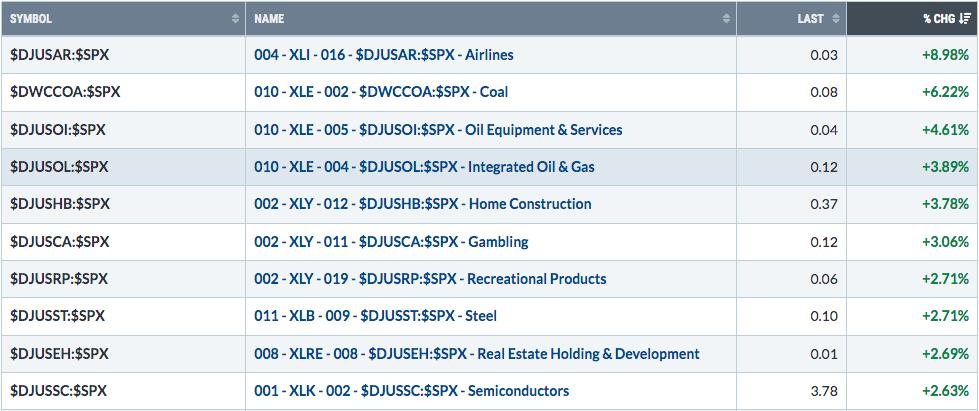
Top 10 Industries Last Week
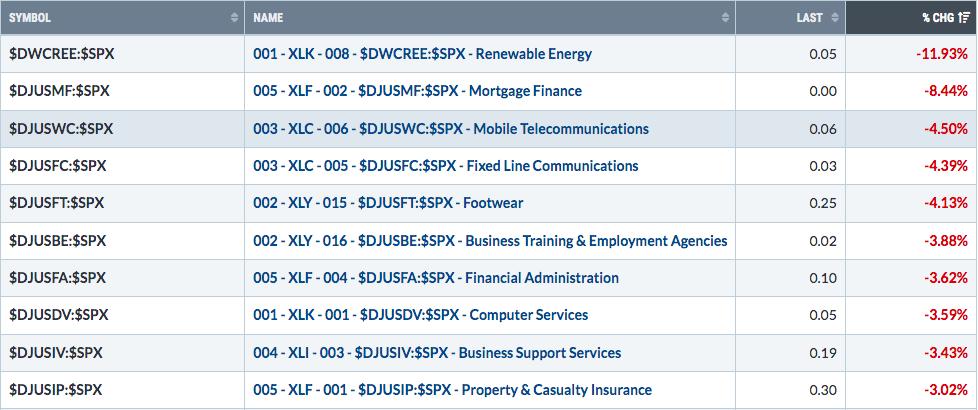
Bottom 10 Industries Last Week
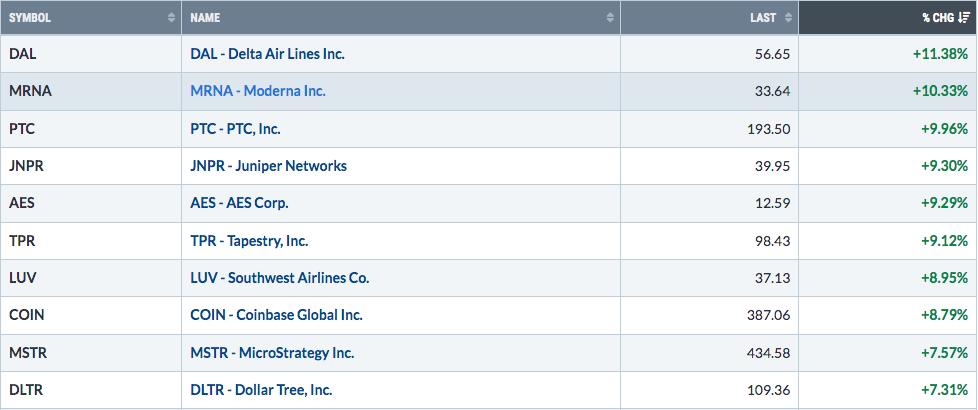
Top 10 Stocks - S&P 500/NASDAQ 100
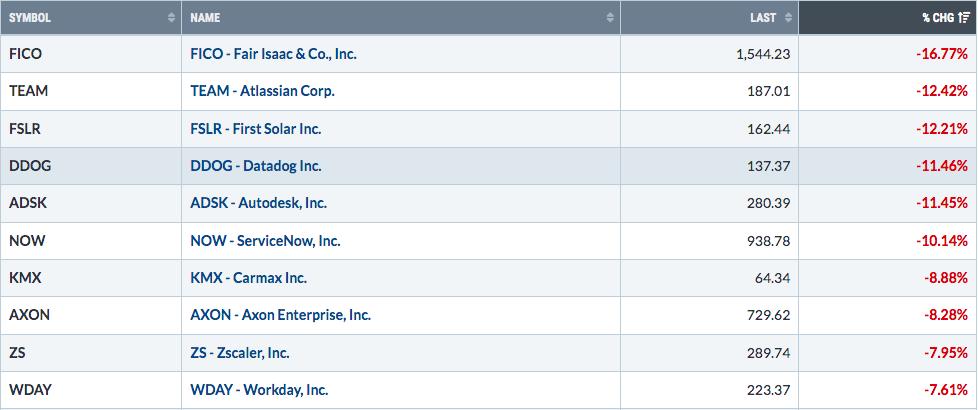
Bottom 10 Stocks - S&P 500/NASDAQ 100
Big Picture
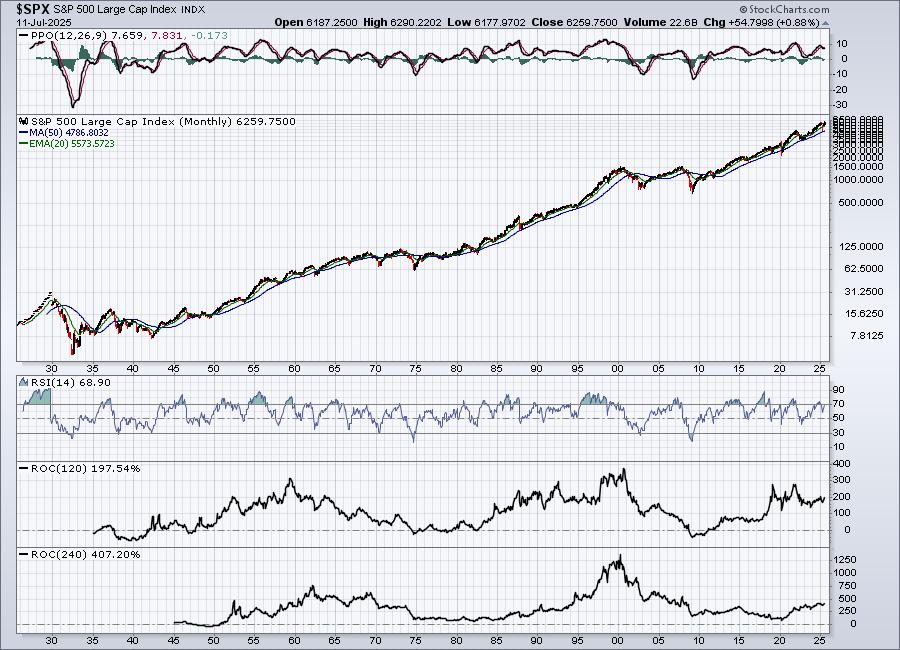
The long-term trend in U.S. stocks is clearly higher. This is a big reason why I always say that your default should always be to stay long stocks. From a long-term investing or trading perspective, make sure there are a large number of bearish signals that point to a cyclical bear market before even considering an exit out of stocks. I believe the majority of investors prefer to exit as their default and only consider being in stock market during select periods. That's a very big mistake and history tells us that. Change your mindset, if you feel you're in this "exit" default group.
Sustainability Ratios
Here's the latest look at our key intraday ratios as we follow where the money is traveling on an INTRADAY basis (ignoring gaps):
QQQ:SPY
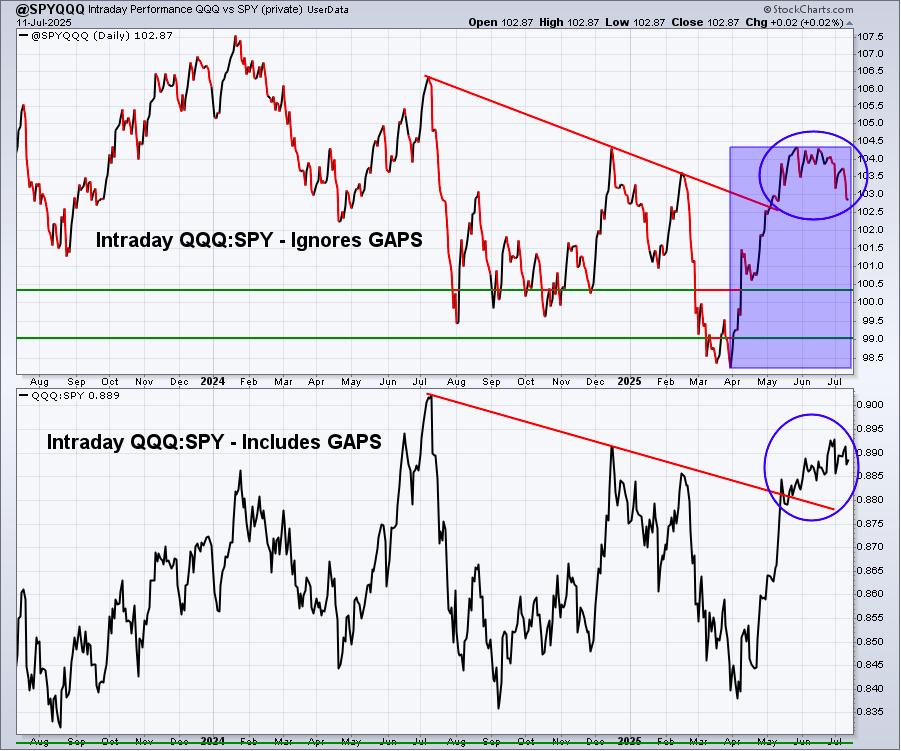
The upper panel that shows recent intraday deterioration in the QQQ:SPY ratio is a small red flag, but a red flag nonetheless. I'm generally not going to grow too bearish as long as the S&P 500 remains in a solid uptrend AND the XLY:XLP ratio (below) is trending higher and supporting the S&P 500 advance. It's ok to see a bit of rotation from the riskier NASDAQ 100 to the less risky S&P 500, so long as we're not seeing a lot of other warning signs simultaneously. I think we're perfectly fine for now.
IWM:QQQ
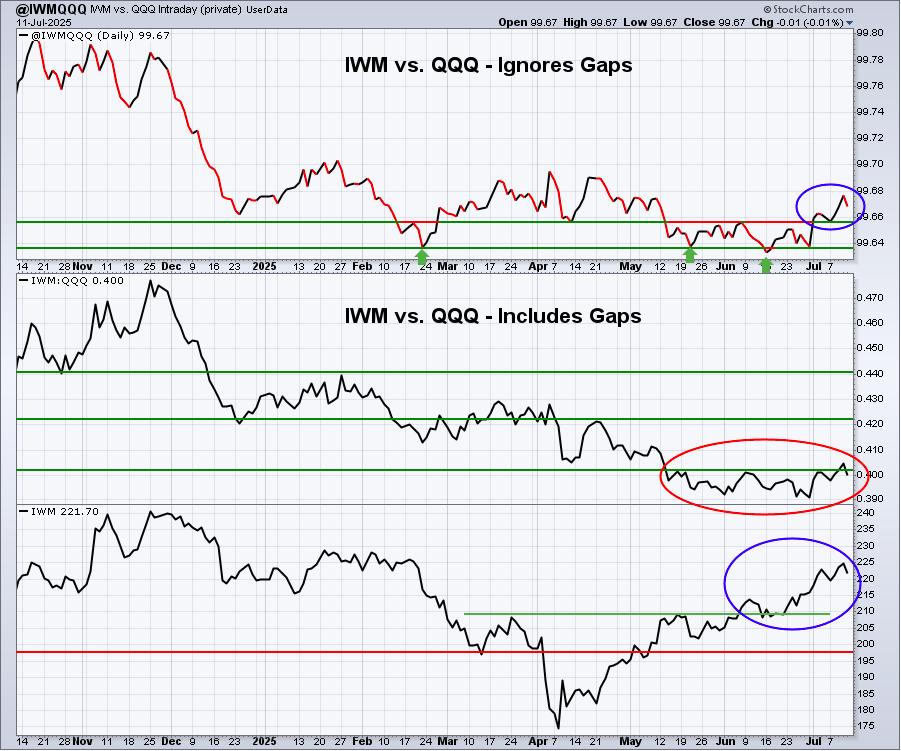
We finally saw some relative strength in the IWM:QQQ intraday ratio chart, which is a bullish development for small cap stocks and for the likelihood of a rate cut. It did turn lower on Friday, however, so its relative performance this upcoming week, especially with key inflation reports due out, will be somewhat critical.
XLY:XLP
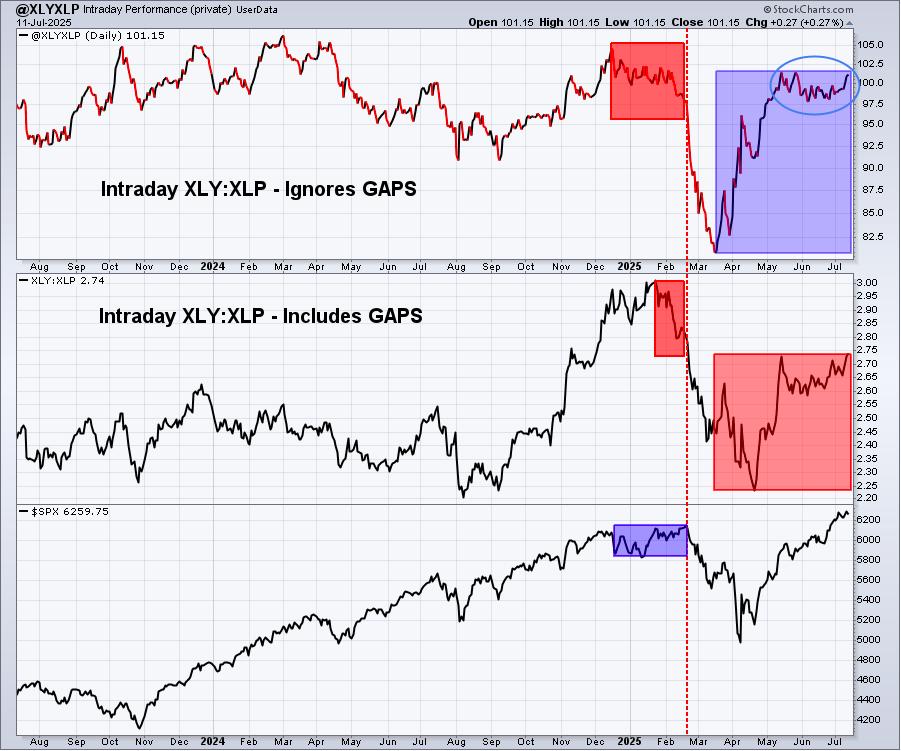
I mentioned last week that it'd be a very big positive for this intraday XLY:XLP ratio to break out, that last week we were consolidating. Well, we're now on the verge of a breakout. The XLY:XLP ratio, in my opinion, is one of the most important signals, if not THE most important secondary signal. Obviously, what's actually happening on the price chart of our key indices is the most important. I also want to see which sectors are helping to lead the benchmark indices higher. But we always have to remember that we're a consumer-driven economy, so the relationship between the "risk on" discretionary sector vs. the "risk off" staples sector will be a key factor in determining the sustainability of an S&P 500 advance or decline.
Sentiment
5-day SMA ($CPCE)
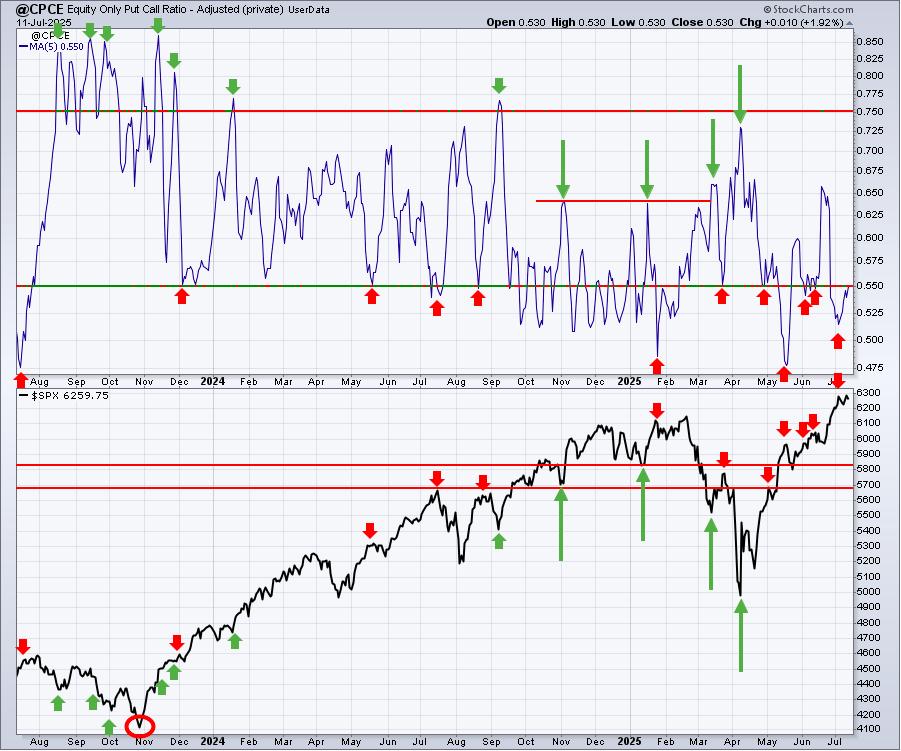
Sentiment indicators are contrarian indicators. When they show extreme bullishness, we need to be a bit cautious and when they show extreme pessimism, it could be time to become much more aggressive. Major market bottoms are carved out when pessimism is at its absolute highest level.
Keep in mind that the above 5-day SMA reading of the CPCE is our "speed boat" sentiment indicator that changes quite frequently. Like the QQQ:SPY minor red flag above, the current 5-day CPCE reading at .55 is also a slight warning sign, but not a signal that we'll see deep selling. Many times, these overly complacent readings accompany a brief period of consolidation/selling. I would not be expecting any type of major selloff at this time, based upon this signal and the others above.
253-day SMA ($CPCE)
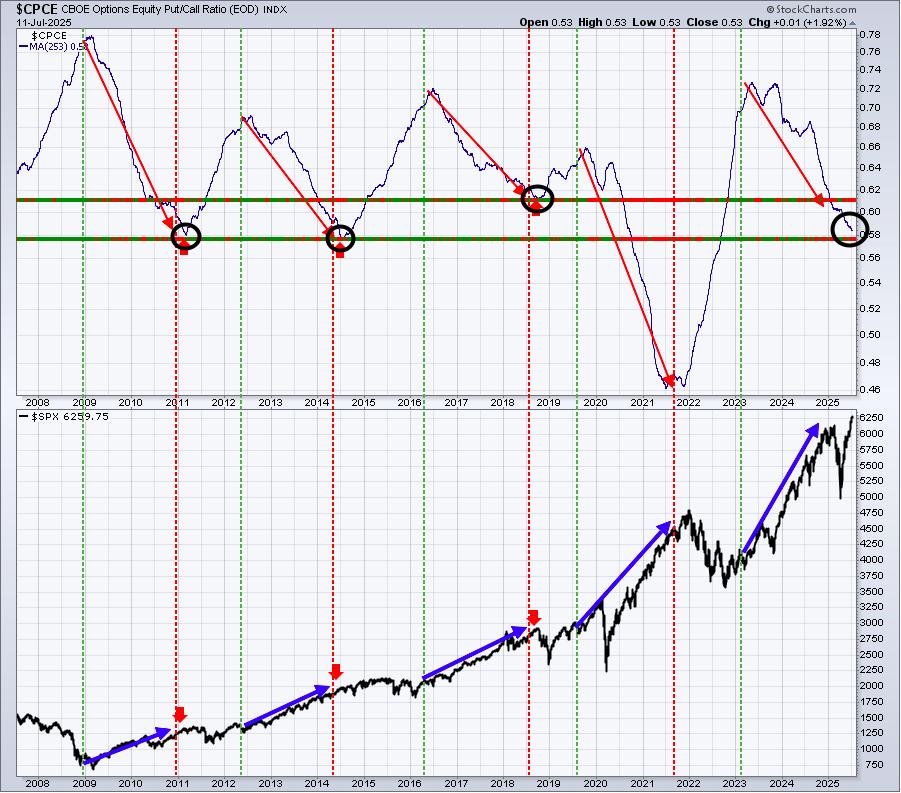
This longer-term 253-day SMA of the CPCE is our "ocean-liner" signal, unlike our speedboat indicator. This one usually provides us a very solid long-term signal as the overall market environment moves from one of pessimism to complacency and vice versa. Look at the above chart. When the 253-day SMA is moving lower like it is now, it accompanies our most bullish S&P 500 moves. When the short-term 5-day SMA signal turns bearish, like it has now, it's a good idea to remind ourselves that the longer-term picture still remains quite bullish based on this longer-term sentiment indicator.
Long-Term Trade Setup
Since beginning this Weekly Market Report in September 2023, I've discussed the long-term trade candidates below that I really like. Generally, these stocks have excellent long-term track records, and many pay nice dividends that mostly grow every year. Only in specific cases (exceptions) would I consider a long-term entry into a stock that has a poor or limited long-term track record and/or pays no dividends. Below is a quick recap of how these stocks looked a few weeks ago:
- JPM - challenging all-time high
- BA - substantial improvement, would like to see 185-190 support hold
- FFIV - very bullish action above its 20-month SMA
- MA - very steady and bullish long-term performer
- GS - trending higher above 20-month EMA
- FDX - trying to clear falling 20-week EMA
- AAPL - monthly RSI at 50, which has been an excellent time to buy AAPL over the past two decades
- CHRW - 85-90 is solid longer-term support
- JBHT - would like to see 120-125 support hold
- STX - long-term breakout in play, excellent trade
- HSY - breaking above 175 would be intermediate-term bullish
- DIS - now testing key price resistance in 120-125 range
- MSCI - monthly RSI hanging near 50, solid entry
- SBUX - moved back above 50-week EMA, short-term bullish
- KRE - long-term uptrend remains in play
- ED - has been a solid income-producer and investment since the financial crisis low in 2009
- AJG - few stocks have been steadier to the upside over the past decade
- NSC - continues to sideways consolidate in very bullish fashion
- RHI - trending down with potential sight set on 30
- ADM - looks to be reversing higher off long-term price support near 43
- BG - 65-70 price support held, now looking to clear 50-week SMA to the upside
- CVS - excellent support at 45 or just below, just failed on bounce at 50-month SMA at 72
- IPG - monthly RSI now at 37 and also testing 4-year price support near 22.50
- HRL - long-term price support at 25 and stock now showing positive divergence on monthly chart - bullish
- DE - one of the better 2025 momentum stocks on this list
Keep in mind that our Weekly Market Reports favor those who are more interested in the long-term market picture. Therefore, the list of stocks above are stocks that we believe are safer (but nothing is ever 100% safe) to own with the long-term in mind. Nearly everything else we do at EarningsBeats.com favors short-term momentum trading, so I wanted to explain what we're doing with this list and why it's different.
Also, please keep in mind that I'm not a Registered Investment Advisor (and neither is EarningsBeats.com nor any of its employees) and am only providing (mostly) what I believe to be solid dividend-paying stocks for the long term. Companies periodically go through adjustments, new competition, restructuring, management changes, etc. that can have detrimental long-term impacts. Neither the stock price nor the dividend is ever guaranteed. I simply point out interesting stock candidates for longer-term investors. Do your due diligence and please consult with your financial advisor before making any purchases or sales of securities.
Looking Ahead
Upcoming Earnings
Very few companies will report quarterly results until mid-April. The following list of companies is NOT a list of all companies scheduled to report quarterly earnings, however, just key reports, so please be sure to check for earnings dates of any companies that you own. Any company in BOLD represents a stock in one of our portfolios and the amount in parenthesis represents the market capitalization of each company listed:
- Monday: FAST ($50 billion)
- Tuesday: JPM ($801 billion), WFC ($268 billion), BLK ($171 billion), C ($163 billion)
- Wednesday: JNJ ($379 billion), BAC ($354 billion), ASML ($316 billion), GS ($218 billion)
- Thursday: NFLX ($532 billion), GE ($269 billion), ABT ($232 billion), PEP ($187 billion)
- Friday: AXP ($228 billion), SCHW ($169 billion), MMM ($85 billion)
Key Economic Reports
- Monday: None
- Tuesday: June CPI, July empire state manufacturing index
- Wednesday: June PPI, June industrial production & capacity utilization, beige book
- Thursday: Initial jobless claims, June retail sales, July Philadelphia Fed Manufacturing Index, May business inventories, July housing market index
- Friday: June housing starts & building permits, July consumer sentiment
Historical Data
I'm a true stock market historian. I am absolutely PASSIONATE about studying stock market history to provide us more clues about likely stock market direction and potential sectors/industries/stocks to trade. While I don't use history as a primary indicator, I'm always very aware of it as a secondary indicator. I love it when history lines up with my technical signals, providing me with much more confidence to make particular trades.
Below you'll find the next two weeks of historical data and tendencies across the three key indices that I follow most closely. The percentage for each calendar day represents the annualized return for that day. An example of how this is calculated is reflected next to the first day under the S&P 500 and in parenthesis:
S&P 500 (since 1950)
- Jul 14: +60.75% (cumulative gains = 12.49% over 52 trading days. 12.49% x 253/52 = 60.75%)
- Jul 15: +17.84%
- Jul 16: +8.78%
- Jul 17: +14.85%
- Jul 18: -30.66%
- Jul 19: +2.72%
- Jul 20: -3.71%
- Jul 21: -29.02%
- Jul 22: -9.64%
- Jul 23: -29.58%
- Jul 24: -4.68%
- Jul 25: +17.53%
- Jul 26: +30.43%
- Jul 27: +9.03%
NASDAQ (since 1971)
- Jul 14: +72.46%
- Jul 15: +47.86%
- Jul 16: -17.18%
- Jul 17: +49.41%
- Jul 18: -56.47%
- Jul 19: -13.47%
- Jul 20: +22.38%
- Jul 21: -57.94%
- Jul 22: -0.01%
- Jul 23: -92.73%
- Jul 24: -49.85%
- Jul 25: +31.82%
- Jul 26: +18.91%
- Jul 27: -16.15%
Russell 2000 (since 1987)
- Jul 14: -1.06%
- Jul 15: +91.81%
- Jul 16: -55.67%
- Jul 17: +6.82%
- Jul 18: -51.12%
- Jul 19: +20.86%
- Jul 20: +25.11%
- Jul 21: -98.75%
- Jul 22: +43.75%
- Jul 23: -74.02%
- Jul 24: -95.36%
- Jul 25: +48.07%
- Jul 26: +56.13%
- Jul 27: -61.56%
The S&P 500 data dates back to 1950, while the NASDAQ and Russell 2000 information date back to 1971 and 1987, respectively.
Final Thoughts
Technical conditions remain strong and I'm seeing little risk of a material selloff (more than 5%) at this time. The Volatility Index ($VIX) fell below 16 for the first time since the cyclical bear market began in mid-February, highlighting the fact that fear has really dried up. Cryptocurrencies have been on fire as bitcoin ($BTCUSD) has surged above 120,000 today for the first time in history. $XRPUSD has jumped more than 30% over the past week, once again touching the $3 level. The strength in cryptos is definitely a sign of a "risk on" market environment and that favors the stock market bulls in the near-term.
Here are a few things I'll be watching this week:
- Earnings. JP Morgan Chase & Co (JPM) will kickstart earnings season tomorrow morning as a slew of large banks get set to report their latest quarterly results. Later this week, we'll hear the latest from Netflix (NFLX). After such a lengthy advance the past 2-3 months, I would expect a very strong report from NFLX.
- Inflation. The June CPI and PPI will be released on Tuesday and Wednesday morning, respectively. The Fed has admitted that they have not cut the fed funds rate due to the potential inflationary impact of tariffs. Another month of tame inflation data will add more pressure on the Fed to cut the fed funds rate for the first time in 2025 when it meets later this month.
- 10-Year Treasury Yield ($TNX). Movement near is likely to be highly dependent on the inflation data. I suspect that if inflation is once again benign tomorrow morning, then we'll probably see another drop in the TNX. Interest-sensitive stocks would most likely do quite well in that scenario.
Happy trading!
Tom