
EB Weekly Market Report - Monday, August 11, 2025
ChartLists/Spreadsheets Updated
The following ChartLists/Spreadsheets were updated over the weekend:
- Strong Earnings (SECL)
- Strong Future Earnings (SFECL)
- Upcoming Earnings and Upcoming Earnings Relative Strength
The Raised Guidance ChartList (RGCL), Bullish Trifecta ChartList (BTCL), Leading Stocks ChartList (LSCL), and our Manipulation spreadsheet have not been completed yet due simply to the sheer volume of earnings reports last week. The above ChartLists have been updated on our website or will be later today. The others should be caught up by week's end, possibly much sooner. My goal is to complete them tomorrow. I'll keep you posted.
New Max Pain Event TIME
I just want all of our members to know that this month's Max Pain event, typically held on the Tuesday before the 3rd Friday of the month will again be held on such date (tomorrow). However, we're making it a LiveStream event on Tuesday that will begin at 4:05pm ET.
We will send everyone room instructions on Tuesday (tomorrow) as usual.
FLASH Sale Continues
We held a big event on Saturday morning, "Invest Confidently: 2 Steps to Better Stock Picks". Feel free to click on the link and watch the recording, if you weren't able to attend live on Saturday. Also, we're running a FLASH Sale and I want to make sure all EB members take advantage of it. Those who are current trial members, monthly members, or annual members with membership expiring over the next few months, should consider taking us up on the offer. For more details, CLICK HERE.
Weekly Market Recap
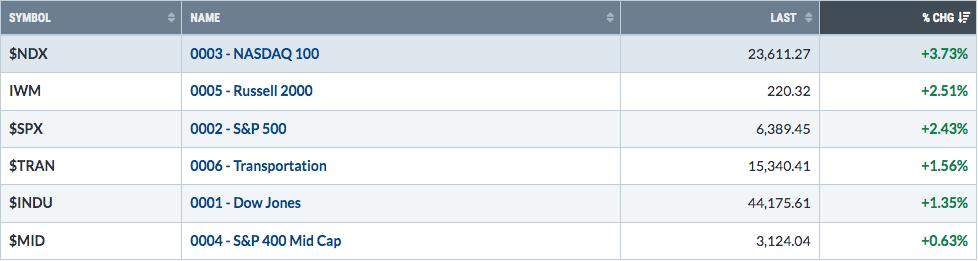
Major Indices
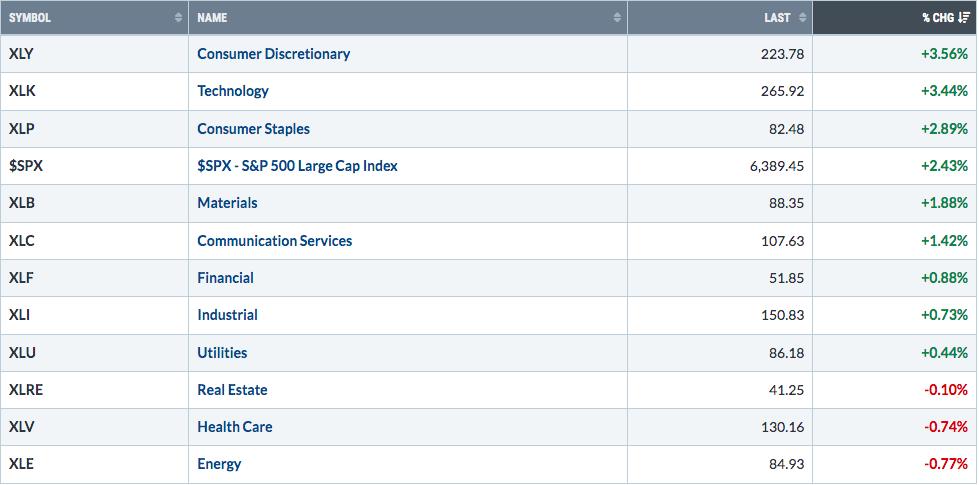
Sectors
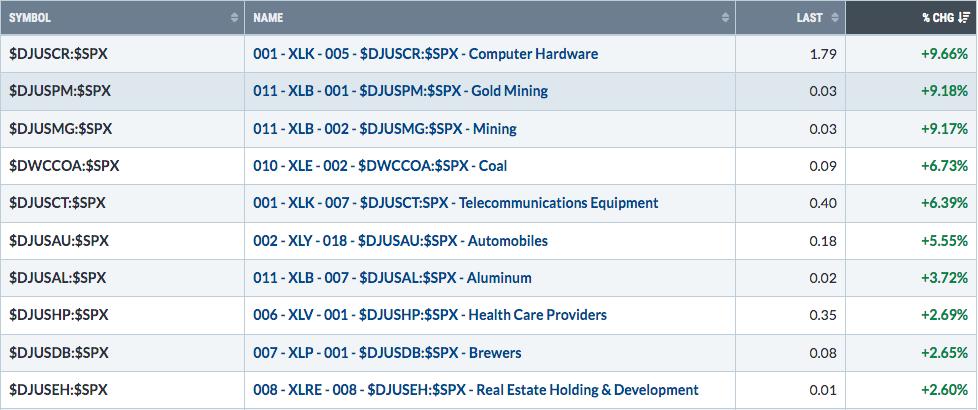
Top 10 Industries Last Week
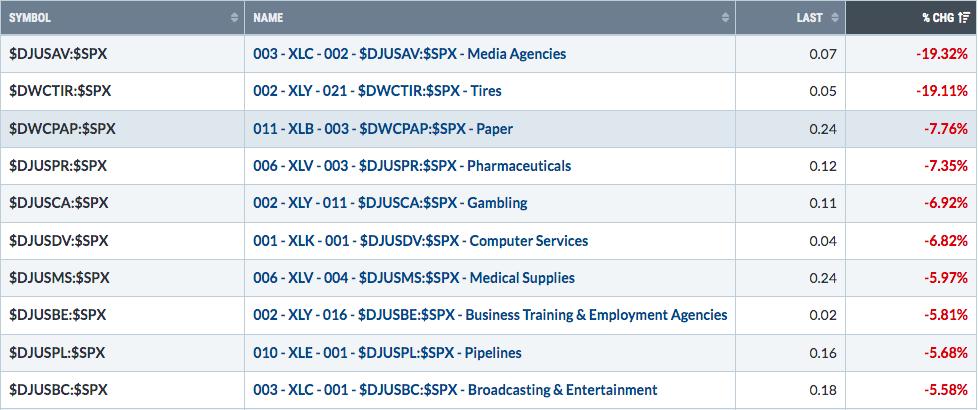
Bottom 10 Industries Last Week
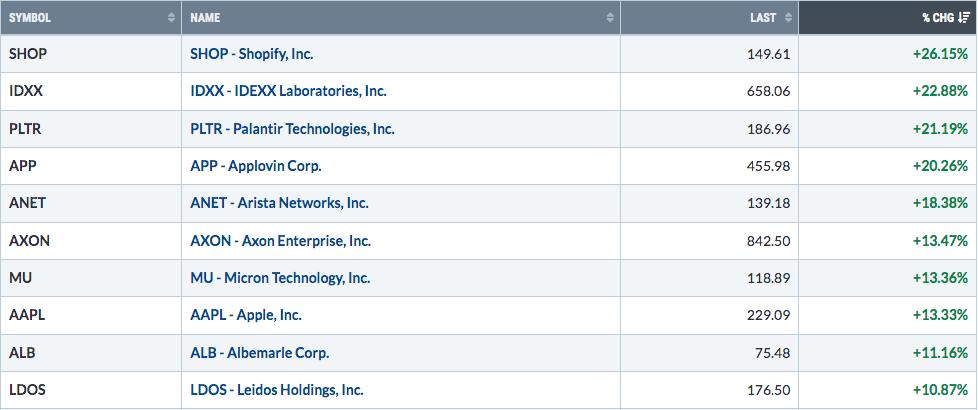
Top 10 Stocks - S&P 500/NASDAQ 100
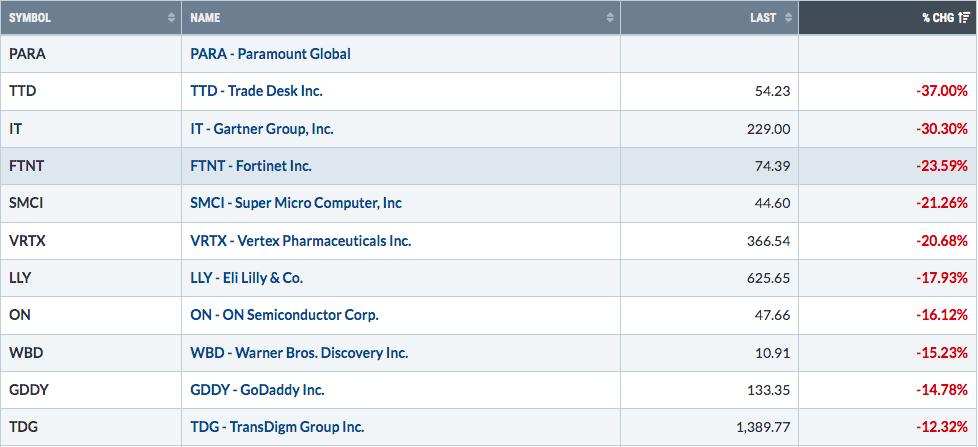
Bottom 10 Stocks - S&P 500/NASDAQ 100
Big Picture
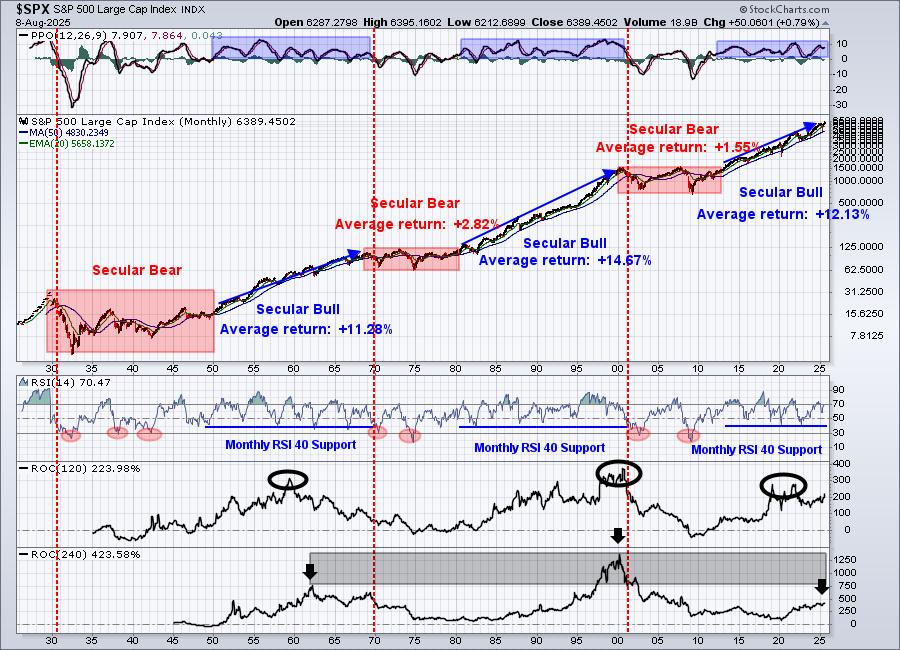
Ignoring the Big Picture would be a big mistake as the above chart has proven over the years. I believe one of the biggest problems for long-term investors is their inability to ignore the news of the day and to stay focused on the long-term prize. And if you watch TV, I can understand why that is. Negativity permeates our daily lives, making it much more difficult to focus on this chart. It's the reason we post it here in the Weekly Market Report every single week.
Stay the bullish course.
Sustainability Ratios
Here's the latest look at our key intraday ratios as we follow where the money is traveling on an INTRADAY basis (ignoring gaps):
QQQ:SPY
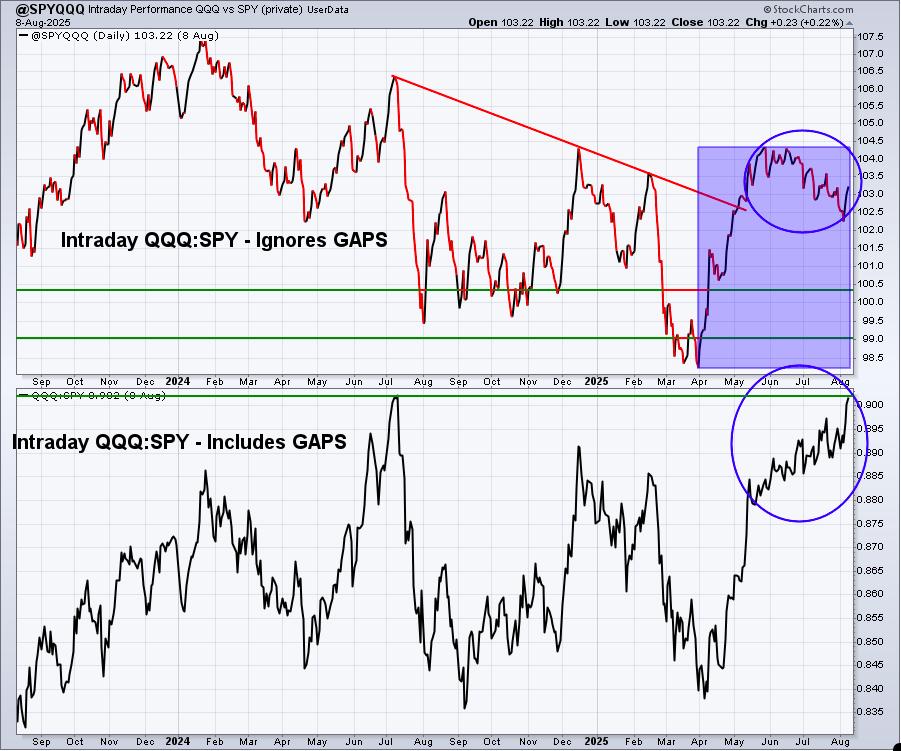
The bottom panel shows the QQQ:SPY moving back to its high from over one year ago. The top panel, while improving last week, still shows a different picture as money throughout the trading day has favored the more value-oriented SPY since mid June.
IWM:QQQ
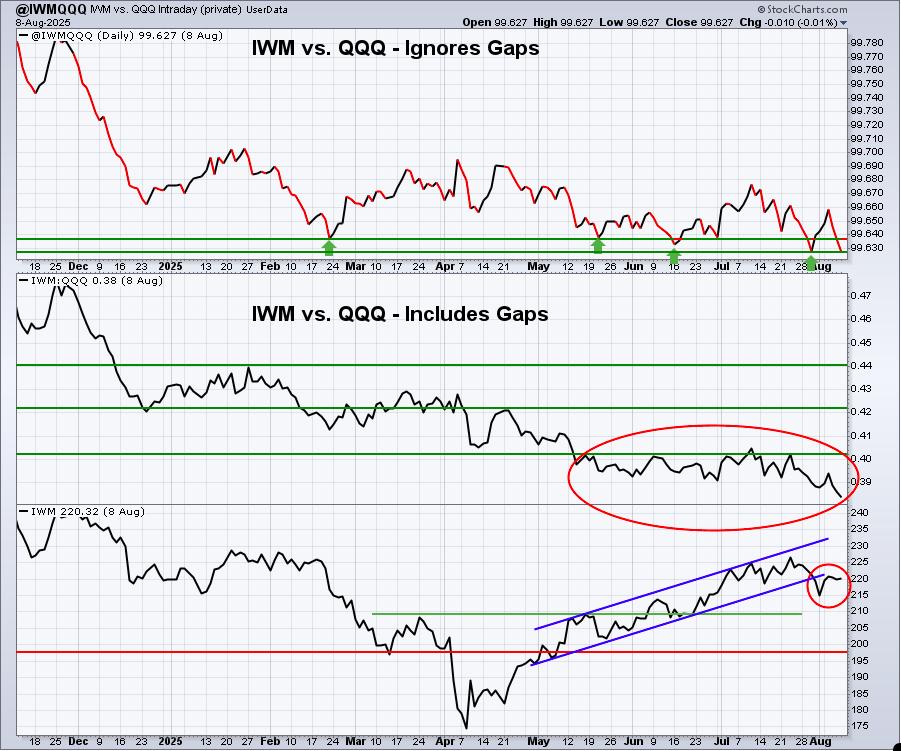
The intraday rotation away from small caps remains a concern for me. While it appears that support for a rate cut in September is growing, the lack of rotation back into small caps tells me that Wall Street isn't exactly comfortable that the Fed will actually cut rates. Maybe that changes in time, but for now, small cap caution remains warranted, especially if price support on the IWM at 215 is lost.
XLY:XLP
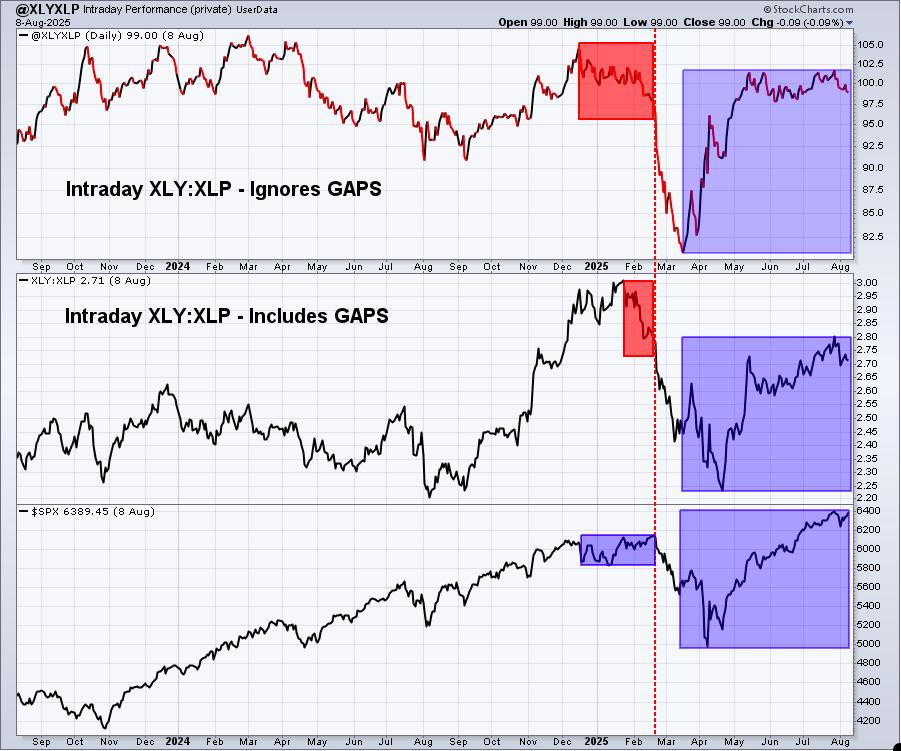
Nothing has changed, I still love this chart. The overall trend in all 3 panels clearly remains higher. There's a chance that we see more stock market weakness and/or consolidation ahead, but it's doubtful that any meaningful selling lasts.
Sentiment
5-day SMA ($CPCE)
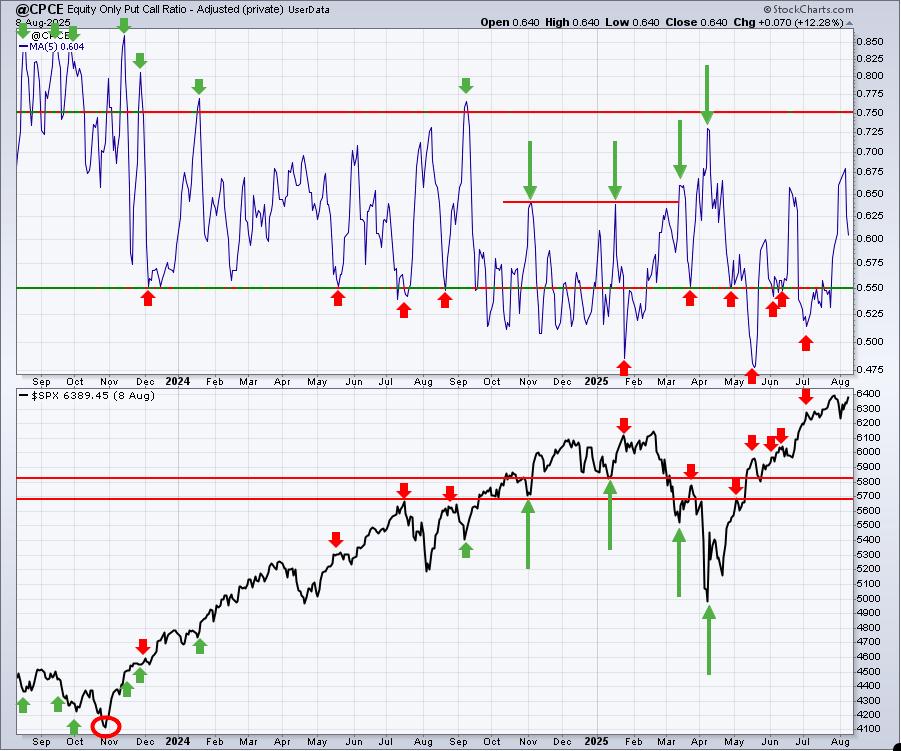
Sentiment indicators are contrarian indicators. When they show extreme bullishness, we need to be a bit cautious and when they show extreme pessimism, it could be time to become much more aggressive. Major market bottoms are carved out when pessimism is at its absolute highest level.
Keep in mind that the above 5-day SMA reading of the CPCE is our "speed boat" sentiment indicator that changes quite frequently. As the S&P 500 moves back up to test all-time highs, short-term sentiment is in neutral territory and that's a positive sign for U.S. equities.
253-day SMA ($CPCE)
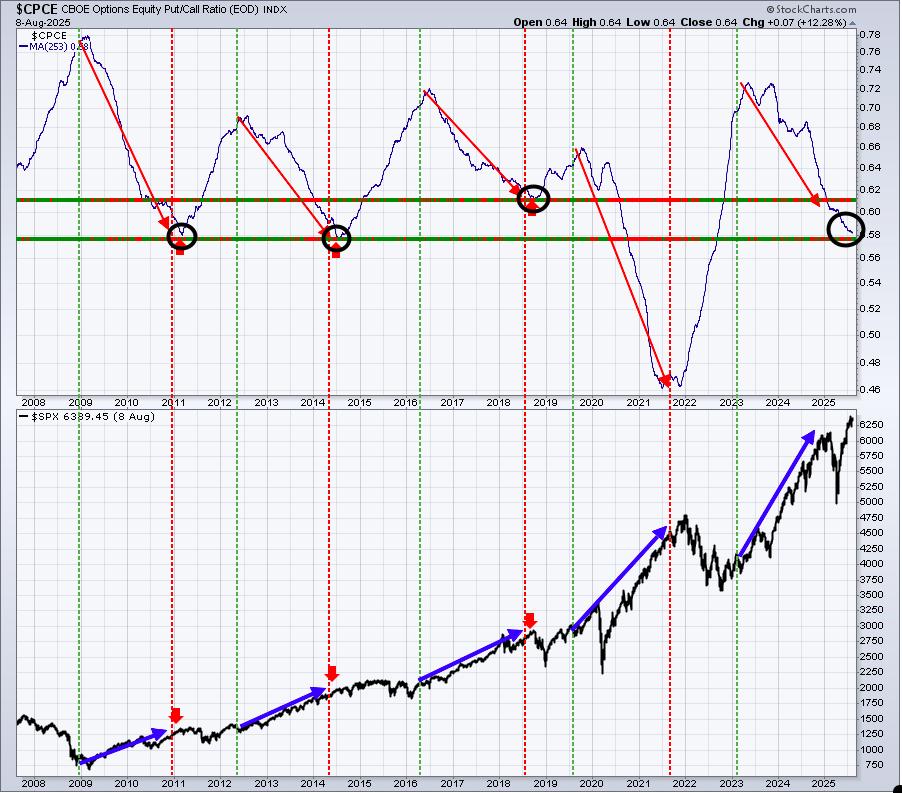
This longer-term 253-day SMA of the CPCE is our "ocean-liner" signal, unlike our short-term speedboat indicator. This one usually provides us a very solid long-term signal as the overall market environment moves from one of pessimism to complacency and vice versa. Look at the above chart. Nothing is changing here. When the 253-day SMA is moving lower like it is now, it accompanies our most bullish S&P 500 moves. I cannot think about being long-term bearish while this 253-day SMA keeps falling. Could we have a late-summer drift lower? Sure, but I doubt we're going to see any type of major selloff.
Long-Term Trade Setup
Since beginning this Weekly Market Report in September 2023, I've discussed the long-term trade candidates below that I really like. Generally, these stocks have excellent long-term track records, and many pay nice dividends that mostly grow every year. Only in specific cases (exceptions) would I consider a long-term entry into a stock that has a poor or limited long-term track record and/or pays no dividends. Below is a quick recap of how these stocks look as of a few weeks ago. I'll provide my next update on them next week:
- JPM - long-term overbought, but continuing to push higher into all-time high territory
- BA - substantial improvement continues, I could see this rally continue to 265-280 area
- FFIV - again challenging all-time high
- MA - very steady and bullish long-term performer
- GS - June turned out to be a HUGE month as GS broke back out to all-time highs
- FDX - recently failed again beneath falling 20-week EMA
- AAPL - monthly RSI bouncing off 50 as I discussed last time; seems to be back in uptrend mode
- CHRW - 85-90 is solid longer-term support and it's held that level in 2025
- JBHT - would like to see 120-125 support hold and it has, now must negotiate overhead 20-week EMA
- STX - long-term breakout in May has sent stock soaring
- HSY - strength today has it against key resistance from 175-180
- DIS - threatening major multi-year resistance level near 125; a close above would be very bullish
- MSCI - 3 1/2 year consolidation still in play; 654 is the ultimate resistance and breakout level
- SBUX - remains squarely in the middle of a wide consolidation range between roughly 70 and 115
- KRE - looking for a long-term breakout above 70, trending higher for now
- ED - successfully tested its rising 20-month EMA in both June and July
- AJG - approaching a rare 20-month EMA test, which has provided great support since 2010
- NSC - is this the breakout of a multi-year cup with handle pattern? if so, measurement is 360
- RHI - still no sign of bottom, but management recently raised its dividend, showing great confidence
- ADM - nice reversal off 43 price support, but now trying to clear its declining 20-week EMA
- BG - remains in a wide 65-75 support zone, another trying to clear its declining 20-week EMA
- CVS - looks like failed attempt to clear 50-month SMA, rolling over; major support at 43
- IPG - 22.50 support continues to hold - at least for now
- HRL - the last 18 months have been spent in a fairly narrow 27-35 range
- DE - still looks very bullish from a long-term perspective (and short-term for that matter)
Keep in mind that our Weekly Market Reports favor those who are more interested in the long-term market picture. Therefore, the list of stocks above are stocks that we believe are safer (but nothing is ever 100% safe) to own with the long-term in mind. Nearly everything else we do at EarningsBeats.com favors short-term momentum trading, so I wanted to explain what we're doing with this list and why it's different.
Also, please keep in mind that I'm not a Registered Investment Advisor (and neither is EarningsBeats.com nor any of its employees) and am only providing (mostly) what I believe to be solid dividend-paying stocks for the long term. Companies periodically go through adjustments, new competition, restructuring, management changes, etc. that can have detrimental long-term impacts. Neither the stock price nor the dividend is ever guaranteed. I simply point out interesting stock candidates for longer-term investors. Do your due diligence and please consult with your financial advisor before making any purchases or sales of securities.
Looking Ahead
Upcoming Earnings
The following list of companies is NOT a list of all companies scheduled to report quarterly earnings, however, just key reports, so please be sure to check for earnings dates of any companies that you own. Any company in BOLD represents a stock in one of our portfolios and the amount in parenthesis represents the market capitalization of each company listed:
- Monday: None
- Tuesday: CRWV ($53 billion), CAH ($37 billion), CRCL ($36 billion)
- Wednesday: CSCO ($274 billion)
- Thursday: AMAT ($143 billion), DE ($138 billion), NTES ($83 billion), TPR ($23 billion)
- Friday: None
Key Economic Reports
- Monday: None
- Tuesday: July CPI
- Wednesday: None
- Thursday: Initial jobless claims, July PPI
- Friday: July retail sales, August empire state manufacturing index, July industrial production & capacity utilization, June business inventories, August consumer sentiment
Historical Data
I'm a true stock market historian. I am absolutely PASSIONATE about studying stock market history to provide us more clues about likely stock market direction and potential sectors/industries/stocks to trade. While I don't use history as a primary indicator, I'm always very aware of it as a secondary indicator. I love it when history lines up with my technical signals, providing me with much more confidence to make particular trades.
Below you'll find the next two weeks of historical data and tendencies across the three key indices that I follow most closely. The percentage for each calendar day represents the annualized return for that day. An example of how this is calculated is reflected next to the first day under the S&P 500 and in parenthesis:
S&P 500 (since 1950)
- Aug 11: +43.86% (Ex: cumulative gains = +9.01% over 52 trading days. +9.01% x 253/52 = +43.86%)
- Aug 12: -0.41%
- Aug 13: +8.61%
- Aug 14: +1.21%
- Aug 15: +9.10%
- Aug 16: +20.23%
- Aug 17: +48.47%
- Aug 18: -41.17%
- Aug 19: -45.08%
- Aug 20: +55.11%
- Aug 21: -8.46%
- Aug 22: -6.00%
- Aug 23: +14.15%
- Aug 24: +3.37%
NASDAQ (since 1971)
- Aug 11: +29.15%
- Aug 12: +40.76%
- Aug 13: +29.10%
- Aug 14: +35.43%
- Aug 15: -0.04%
- Aug 16: +33.28%
- Aug 17: +22.01%
- Aug 18: -7.71%
- Aug 19: -73.15%
- Aug 20: +29.27%
- Aug 21: -11.96%
- Aug 22: +19.25%
- Aug 23: +11.22%
- Aug 24: +11.28%
Russell 2000 (since 1987)
- Aug 11: +27.28%
- Aug 12: +16.16%
- Aug 13: -33.46%
- Aug 14: +24.05%
- Aug 15: +15.38%
- Aug 16: +54.99%
- Aug 17: -18.35%
- Aug 18: +6.13%
- Aug 19: -83.11%
- Aug 20: +16.44%
- Aug 21: +2.70%
- Aug 22: +12.00%
- Aug 23: -21.80%
- Aug 24: +32.69%
The S&P 500 data dates back to 1950, while the NASDAQ and Russell 2000 information date back to 1971 and 1987, respectively.
Final Thoughts
Despite a few shorter-term signals that suggested a period of consolidation or selling was likely, U.S. stocks remain quite resilient. After early strength this morning, we have reversed again with fractional losses in most areas. Many of our major indices are at or near all-time highs and leadership has been strong, with sectors like technology (XLK) paving the way.
Here are a few things I'll be watching this week:
- Earnings. Earnings have been quite strong this quarter and our Raised Guidance ChartList (RGCL) is at a record high, in terms of the number of companies that have raised either revenue guidance, earnings guidance, or both. If estimates are revised higher and rates do eventually move lower, I don't see how U.S. stocks go anywhere but up later this year.
- Inflation. Well, it's time for another round of "Where's The Inflation?". The July CPI data will be released on Tuesday morning, prior to the opening bell, and the July PPI data will be out Thursday morning. If the data does surprise to the upside, and given all the net in-the-money call premium, that could certainly be a catalyst for a potential market drop this week and/or next.
- Options Expiration. August options expire this Friday and that has historically led to some challenges in the past. Will it again? I don't know, but I'm always aware of issues that can surface this week.
- Technicals. Recent price lows and the 20-day EMA should provide nice support for our major indices. If it doesn't, then we could see further technical deterioration in stocks.
Happy trading!
Tom