
EB Weekly Market Report - Tuesday, September 2, 2025
ChartLists/Spreadsheets Updated
The following ChartLists/Spreadsheets were updated over the weekend:
- Strong Earnings (SECL)
- Strong Future Earnings (SFECL)
- Strong AD (SADCL)
- Raised Guidance (RGCL)
- Bullish Trifecta (BTCL)
- Leading Stock (LSCL)
- Seasonality - September 2025 (SEASCL)
- Key Manipulation Spreadsheet
Weekly Market Recap
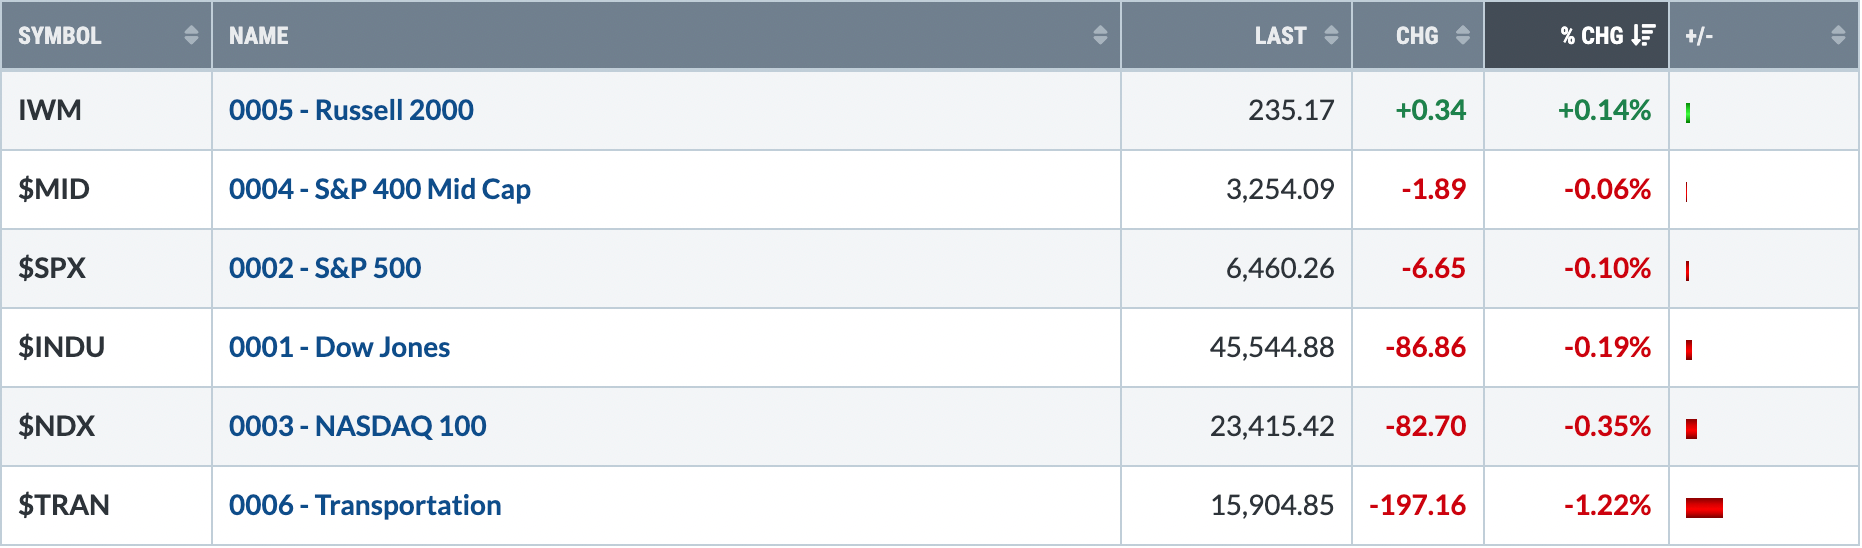
Major Indices
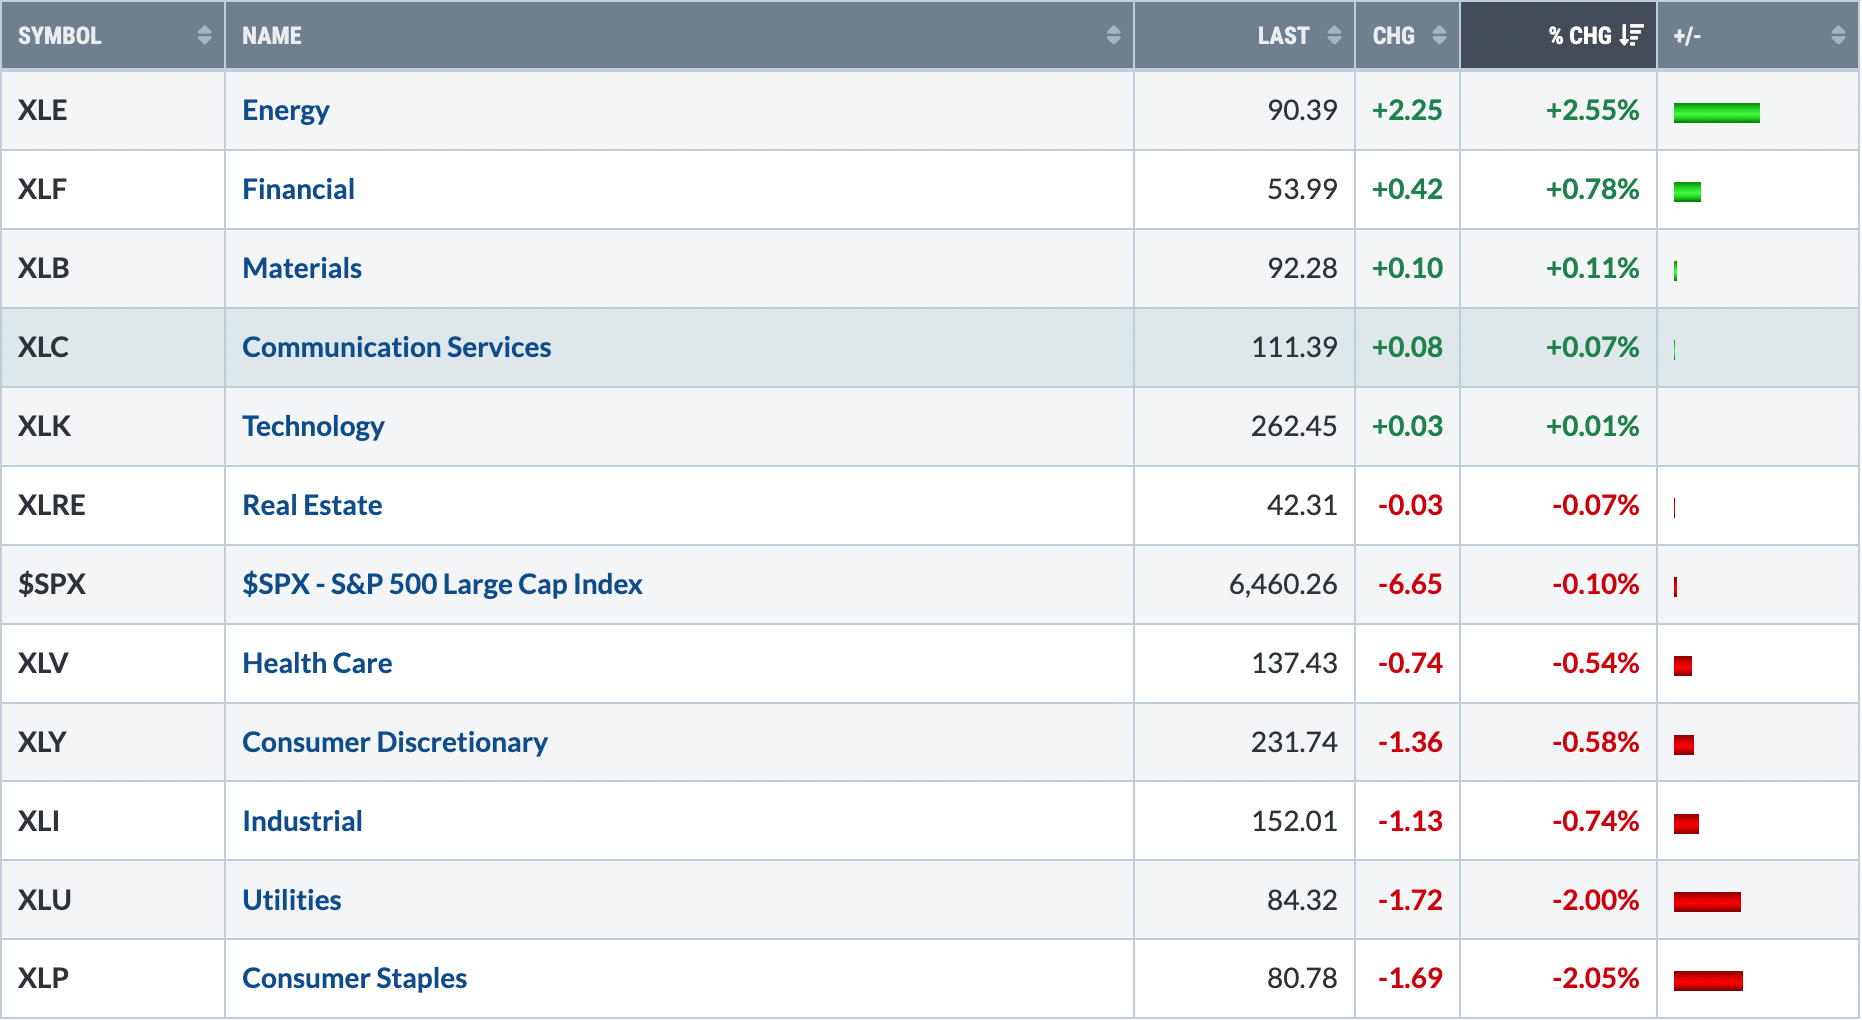
Sectors
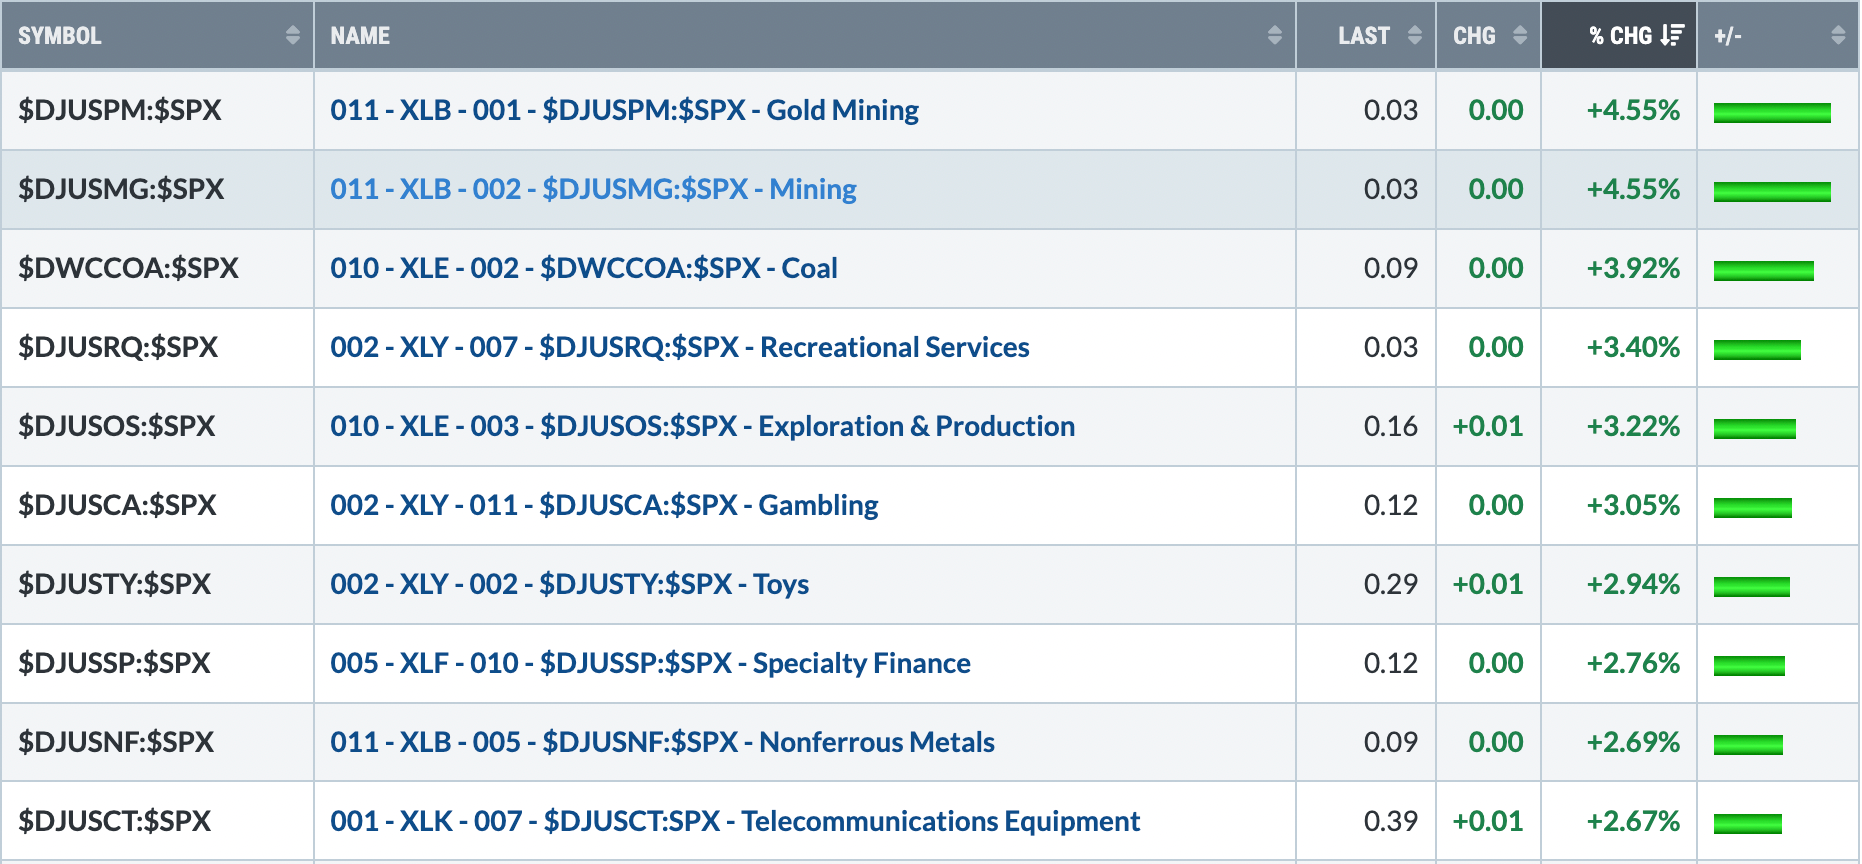
Top 10 Industries Last Week
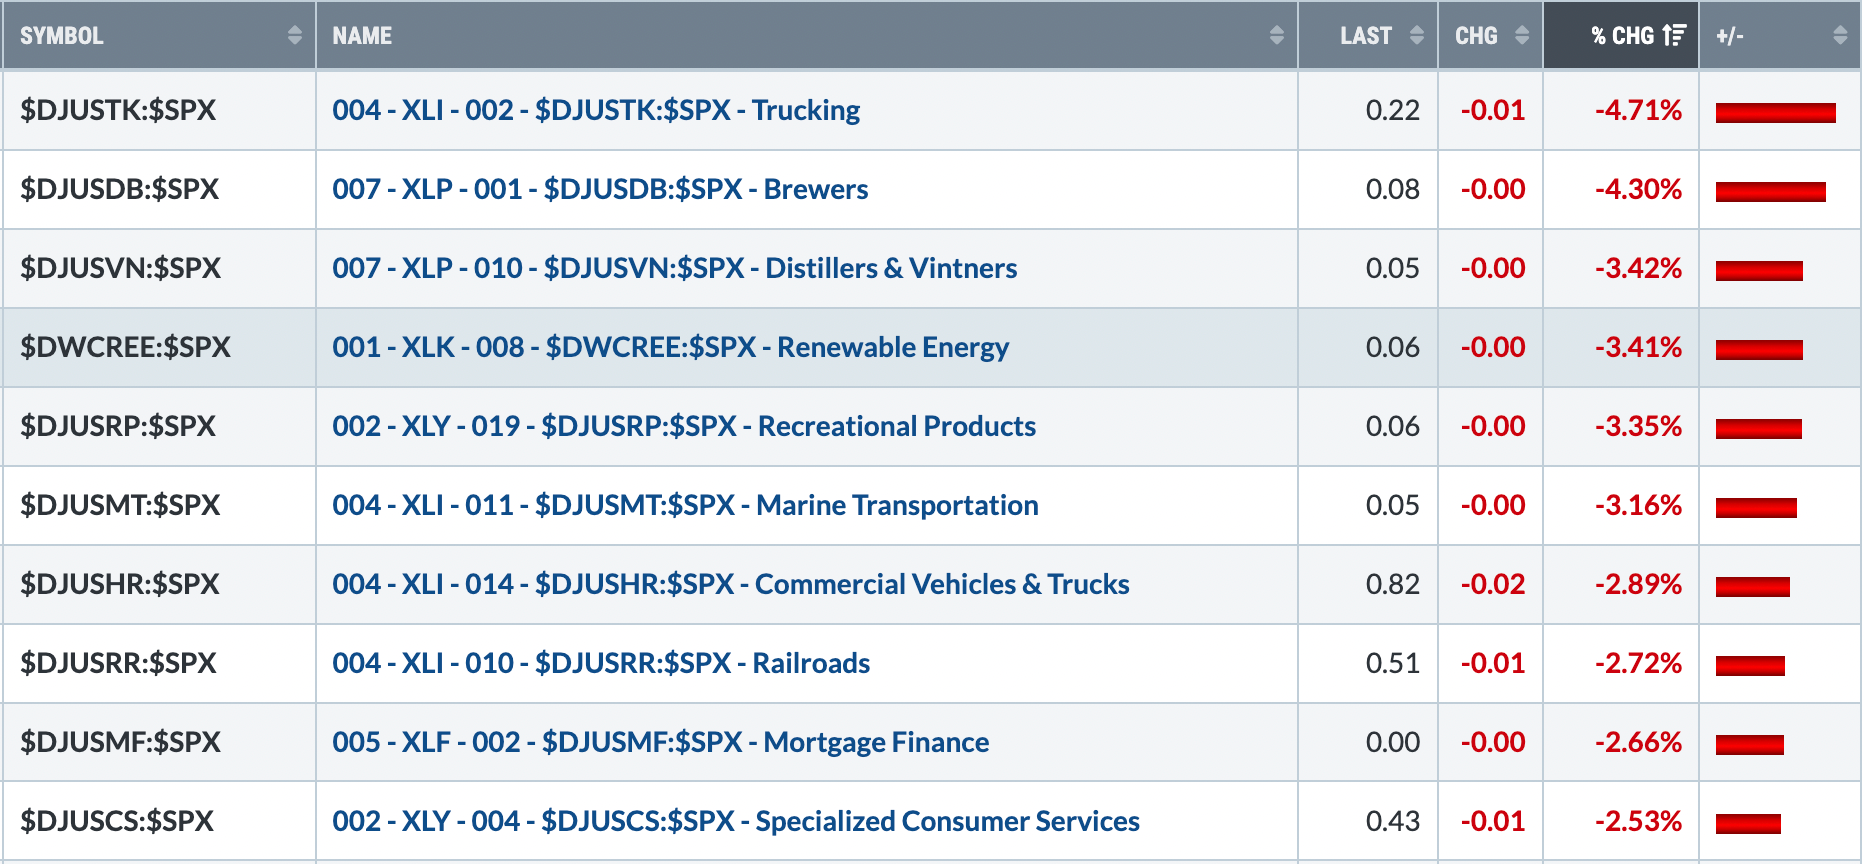
Bottom 10 Industries Last Week
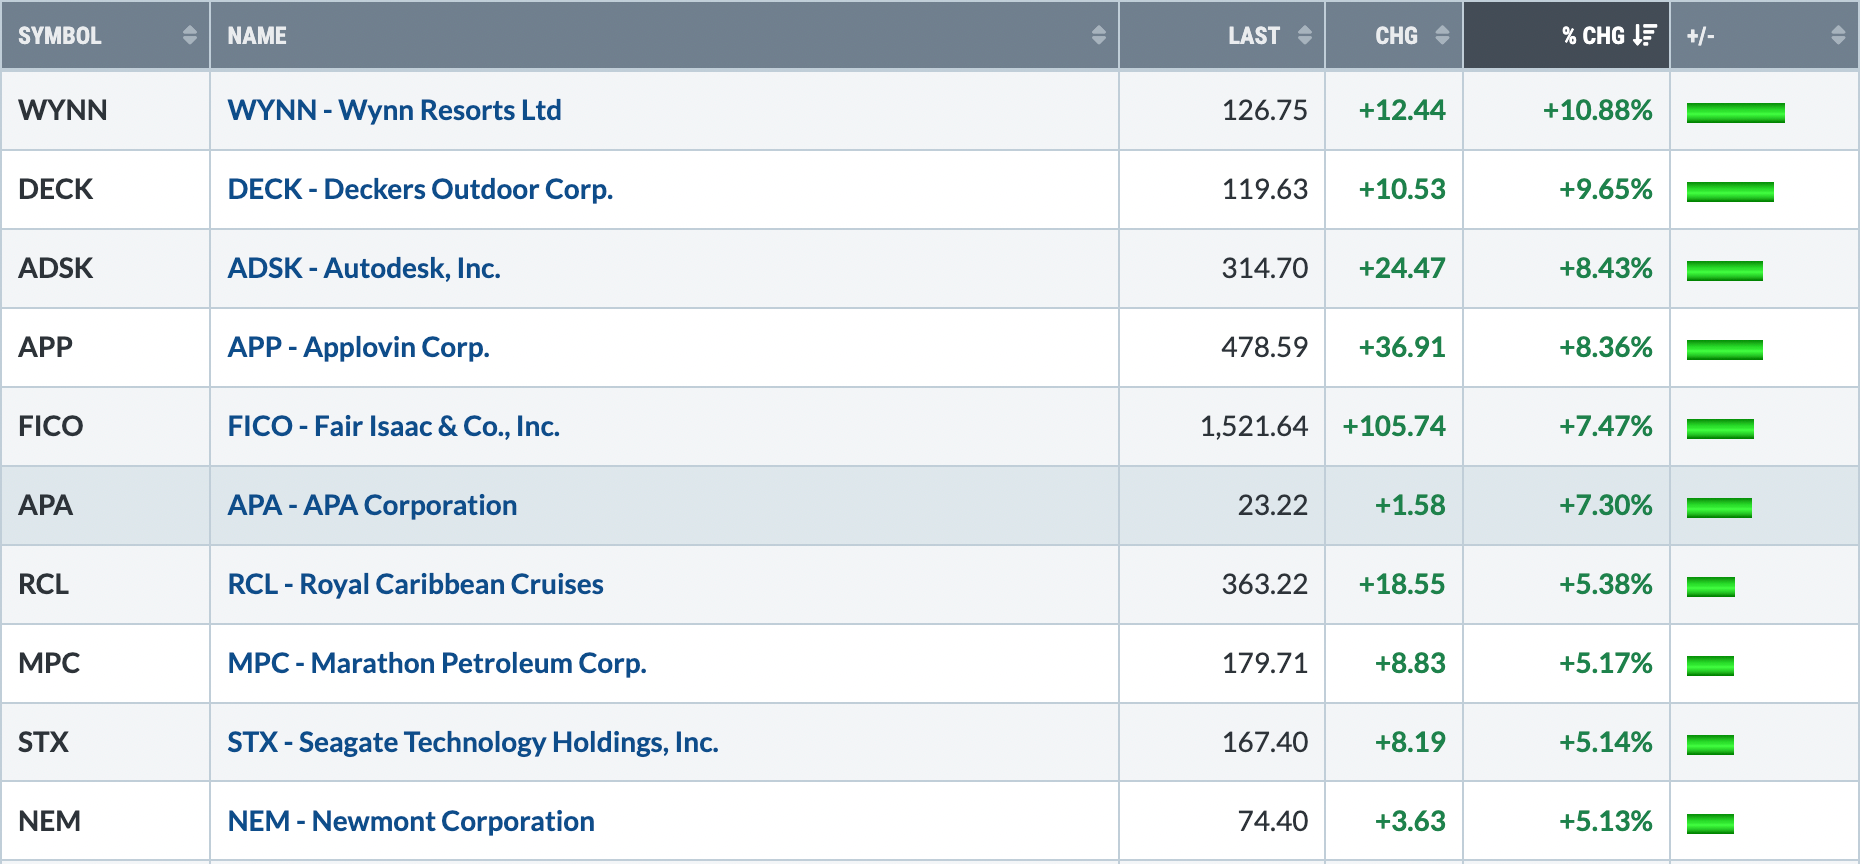
Top 10 Stocks - S&P 500/NASDAQ 100
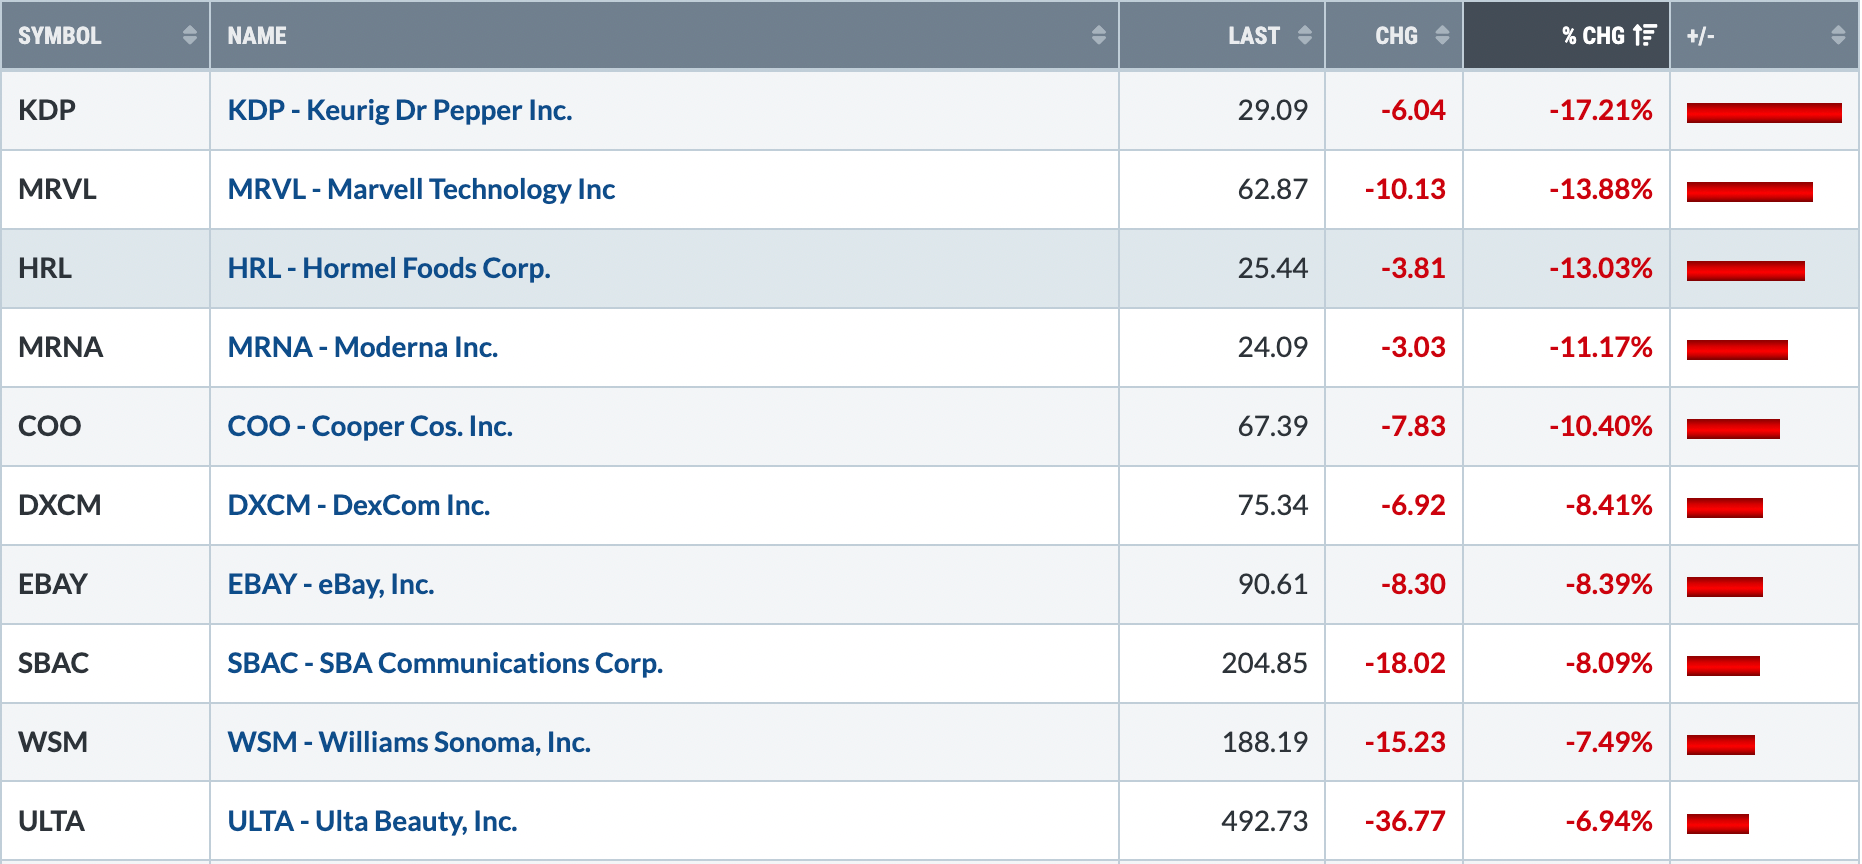
Bottom 10 Stocks - S&P 500/NASDAQ 100
Big Picture
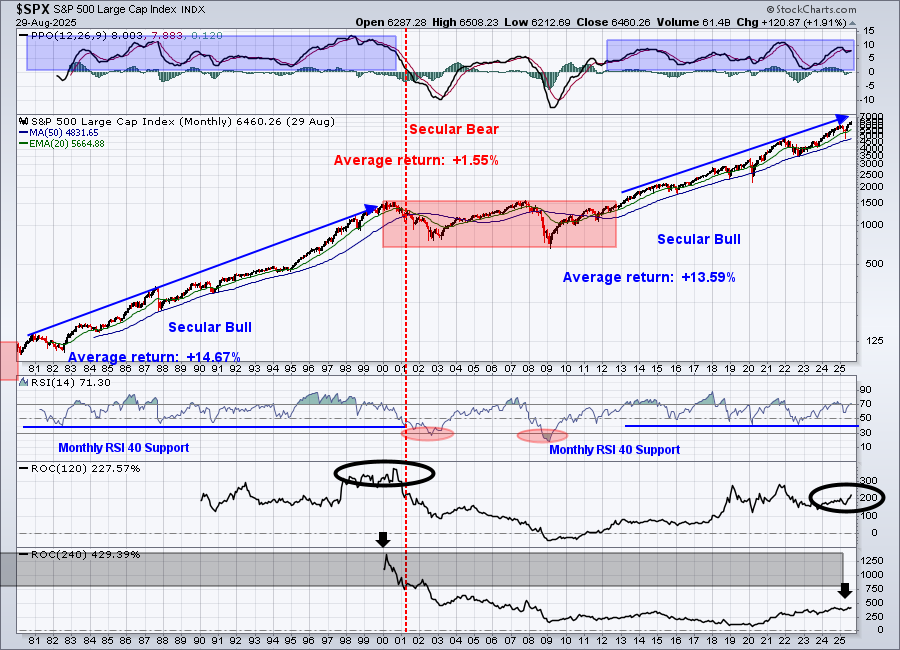
The short-term is definitely growing cloudier after growth stocks took on a bigger hit this past week. The weakness in growth stocks occurred with the S&P 500 setting a new all-time closing high on Thursday above 6500. If I'm being honest, that's a clear-cut warning sign. However, rotation from growth stocks into value is quite normal during the second half of Q3. Furthermore, after the huge advance off the early-April low, it would be nice to see a period of extended consolidation or weakness prior to what I believe will be a very strong Q4. So the next 4-6 weeks, in my view, could be quite dicey. I don't have enough signals of impending doom to suggest that long-term investors consider cash. I believe it still makes sense to remain long. For shorter-term traders, though, the decision of how aggressive to be is a much more complicated one.
I definitely remain bullish, though I continue to recognize that weak seasonality in September should keep us somewhat grounded about the upcoming performance of our major indices. I will personally trade more rate-sensitive areas, until the market tells me to think otherwise. That means I favor small caps (IWM), financials (XLF), industrials (XLI), regional banks (KRE), homebuilders (XHB), etc. I wouldn't totally avoid growth stocks, but I'd be careful to pick my spots where downside risk is limited and I'd make sure to keep stops in place.
As an example, check out the weak seasonal performance of software ($DJUSSW) during September over the past decade, even though we've been in a secular bull market throughout the past decade:
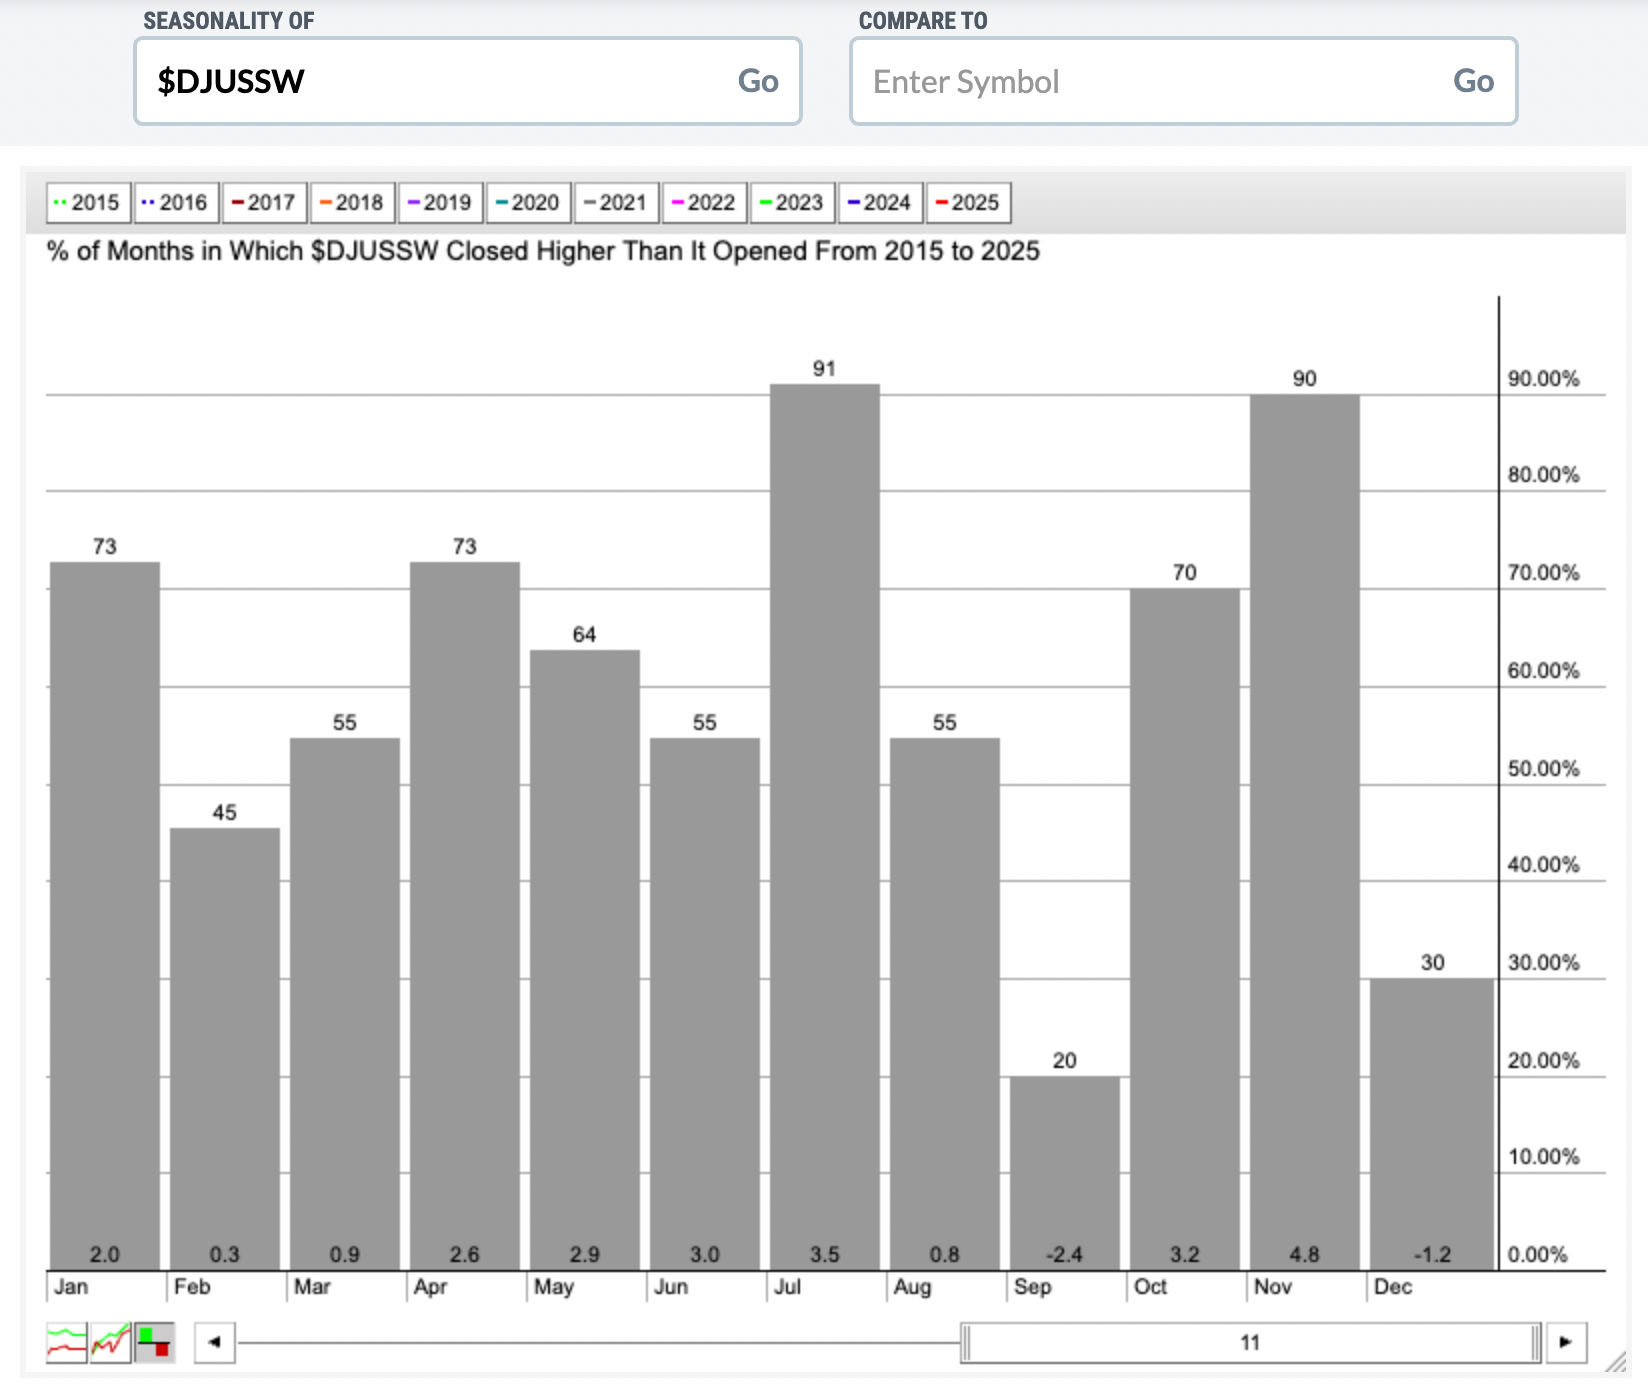
The group has only advanced during September twice in the past 10 years and the average return is -2.4%. That doesn't exactly make me feel great about getting too aggressive with the growth-oriented software industry. Again, this doesn't mean that there won't be good trading opportunities in this space, just that the historical odds are stacked a bit more against the group for now. You can see that October and November have been much more favorable for software stocks.
Sustainability Ratios
Here's the latest look at our key intraday ratios as we follow where the money is traveling on an INTRADAY basis (ignoring gaps):
QQQ:SPY
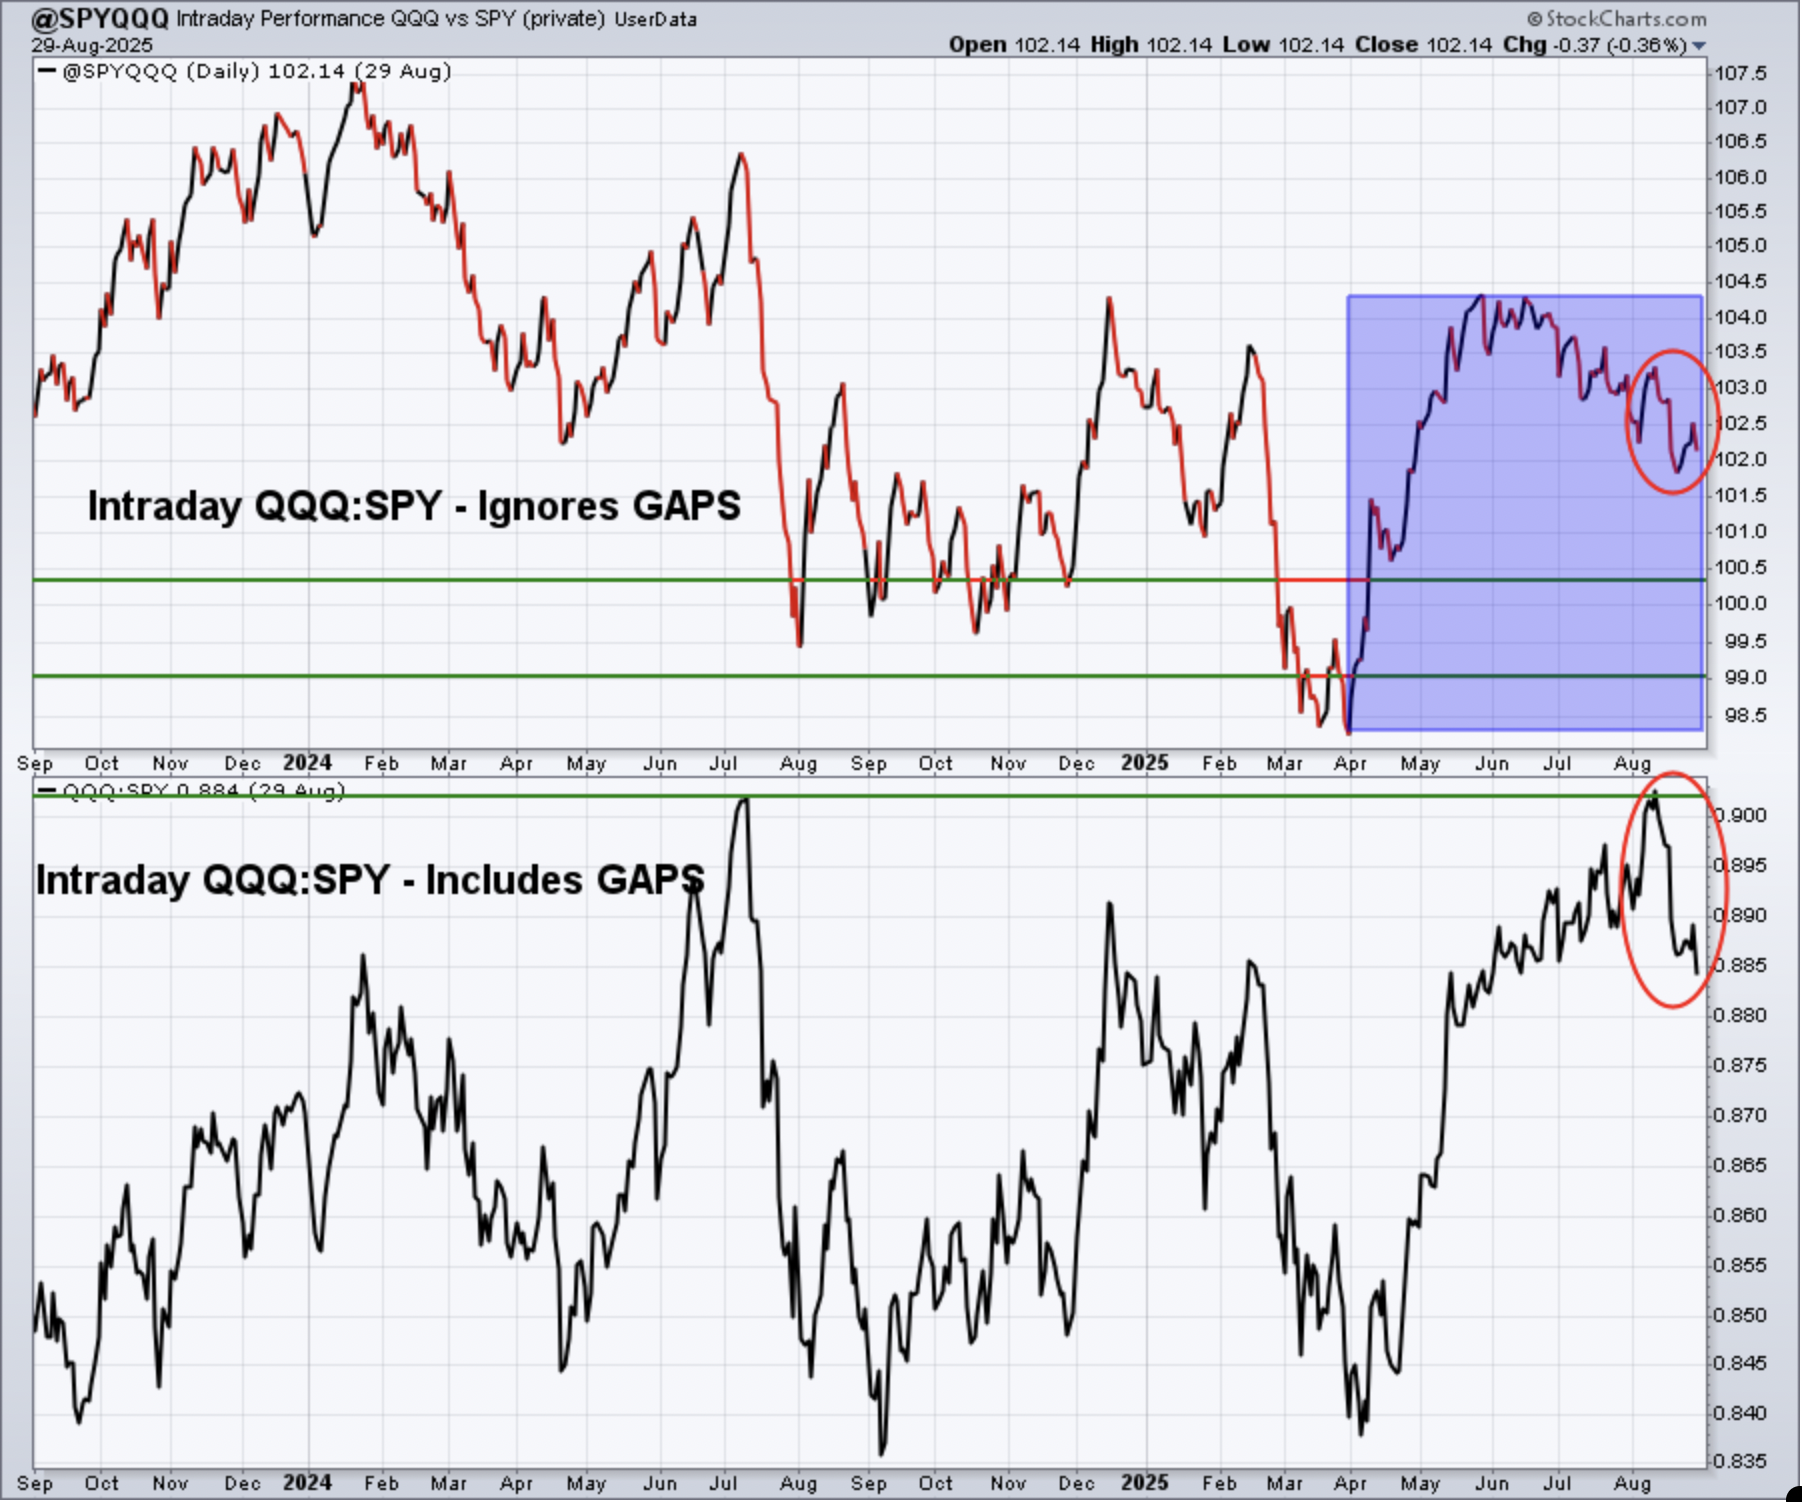
Money has been rotating away from growth during August, especially during the 2nd half of August, which history tells us is a seasonal tendency. While I definitely feel this is something worth monitoring, I'm certainly not to the point where I believe a cyclical bear market could be on the horizon.
IWM:QQQ
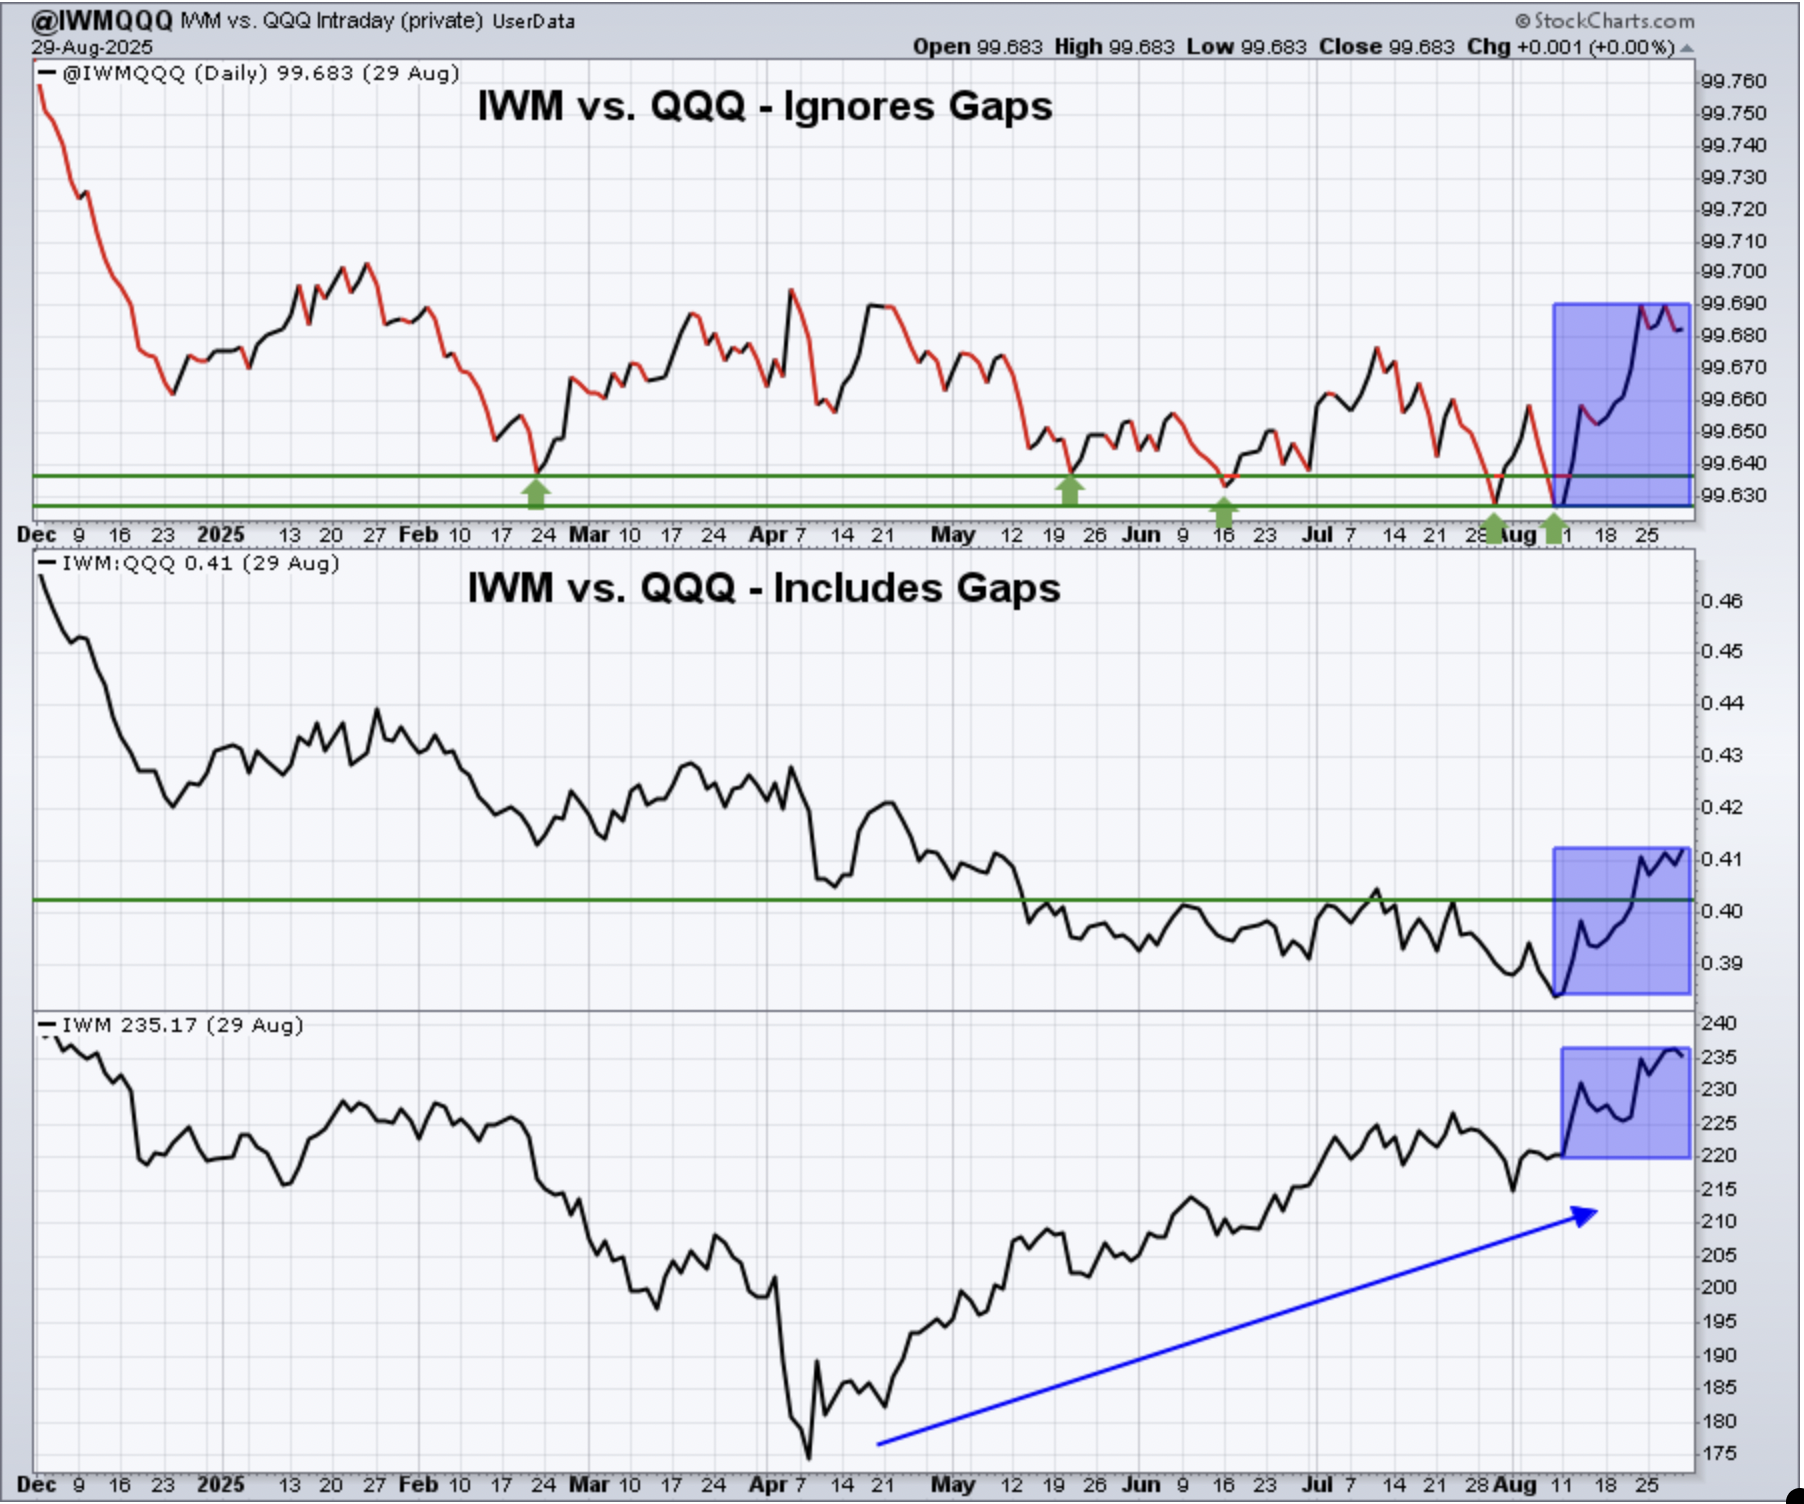
Small caps held their own on a relative basis - both intraday and on a closing basis. That's encouraging after a week of strong relative outperformance. I'm expecting the IWM to outperform the QQQ during September, a month in which we typically see underwhelming results in growth stocks, especially considering that the stock market should be laser focused on small caps if the fed funds rate is cut.
XLY:XLP
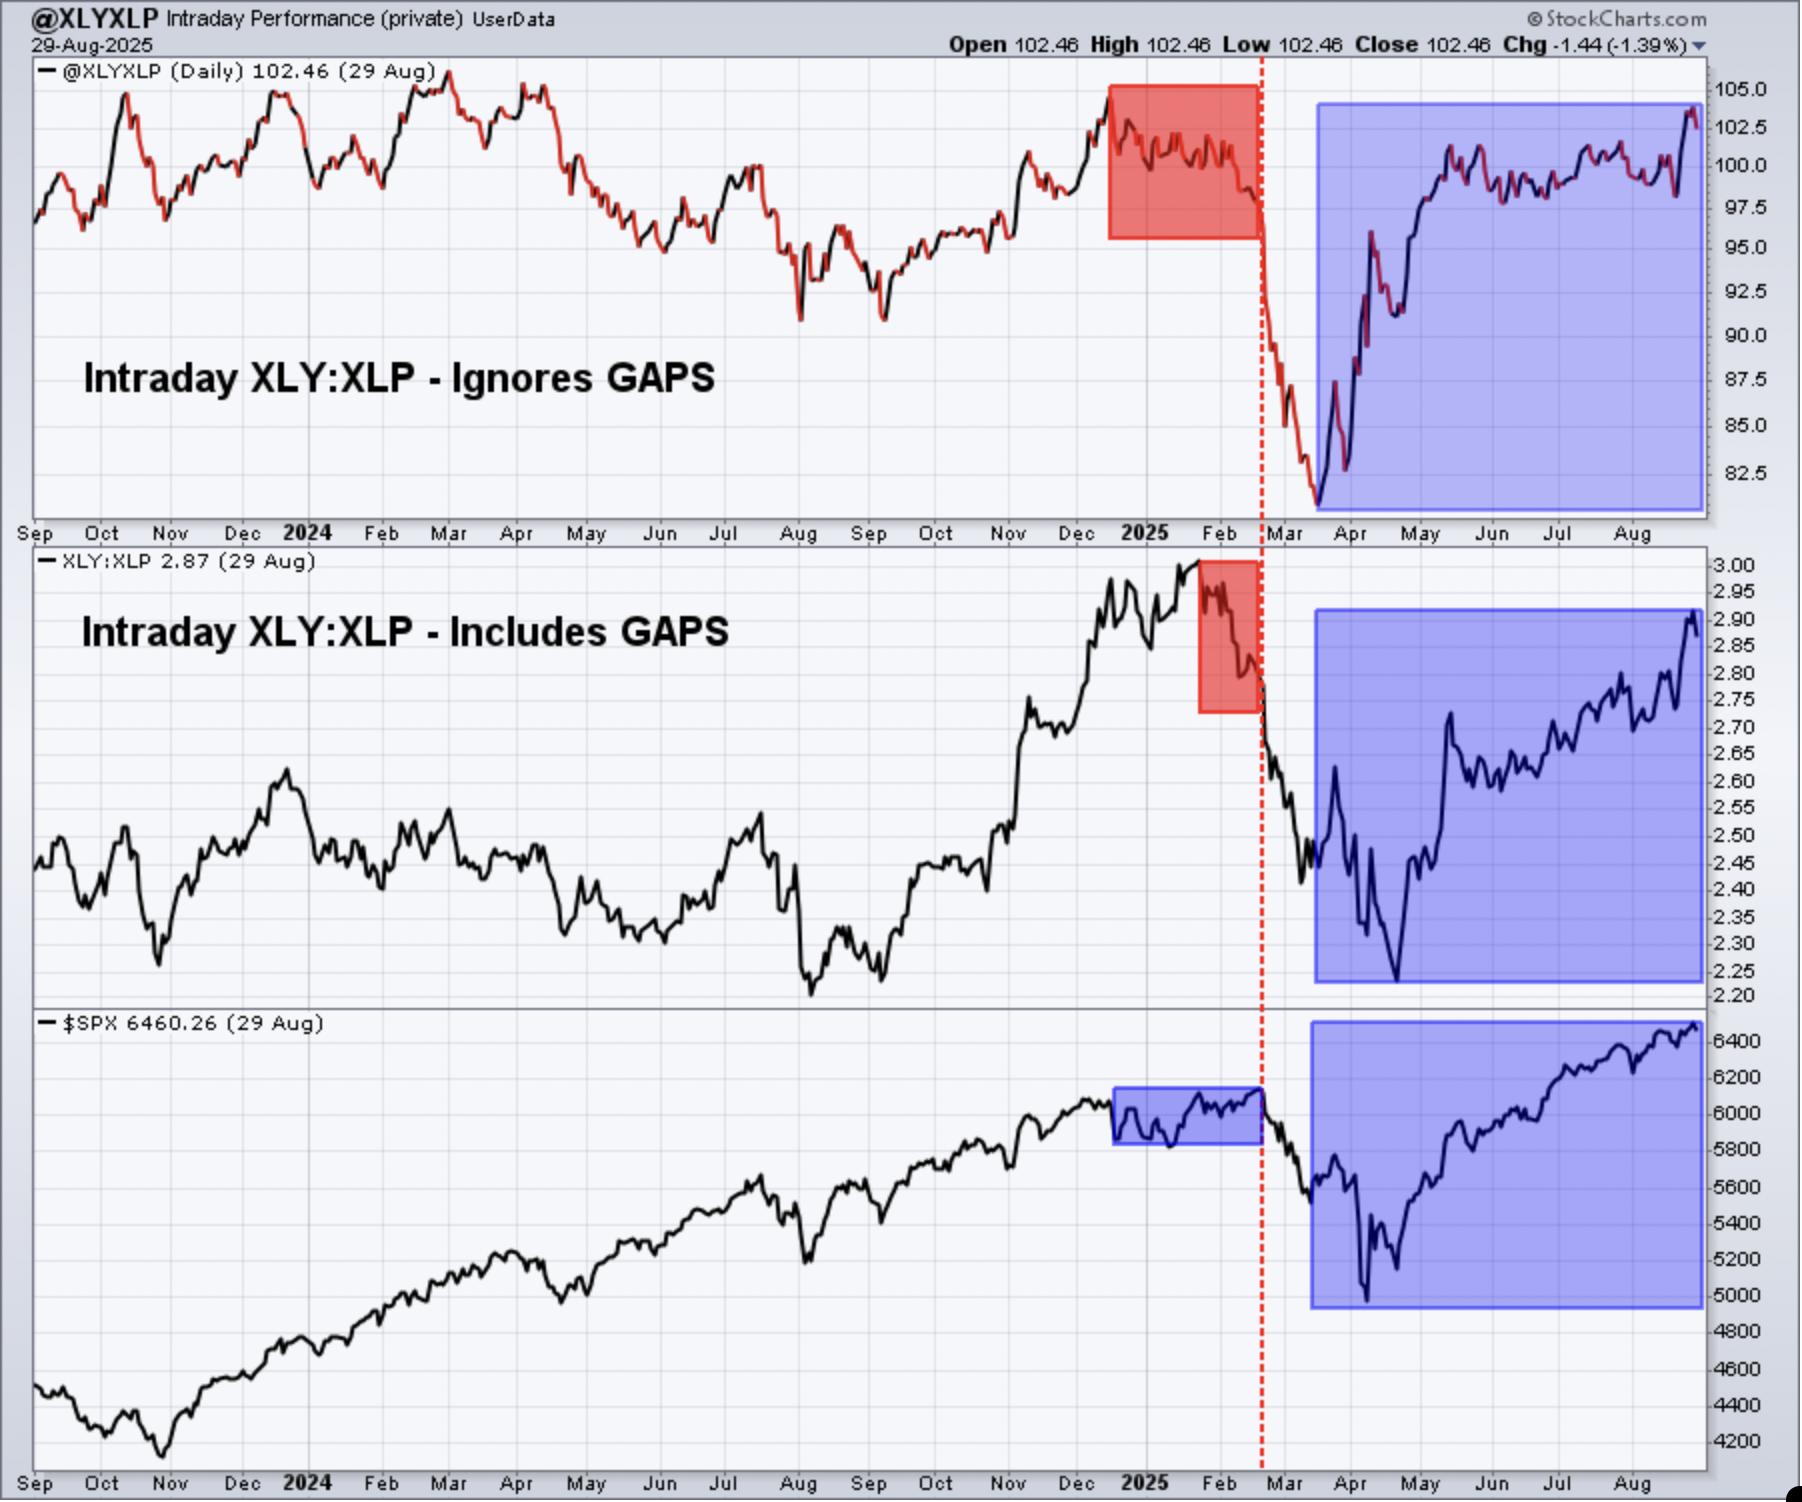
I cannot imagine the XLY performing so well vs. the XLP just before a significant market decline. As a result of this chart alone, I believe that we're much more likely to see one of three scenarios develop. I'm looking for either (a) a continuing ascent in our major indices, (b) consolidation or perhaps a fairly minor 3-5% correction, or (c) a 10% correction. If I were placing odds on the likelihood of each scenario, I'd say 25%, 65%, and 10%, respectively.
Sentiment
5-day SMA ($CPCE)
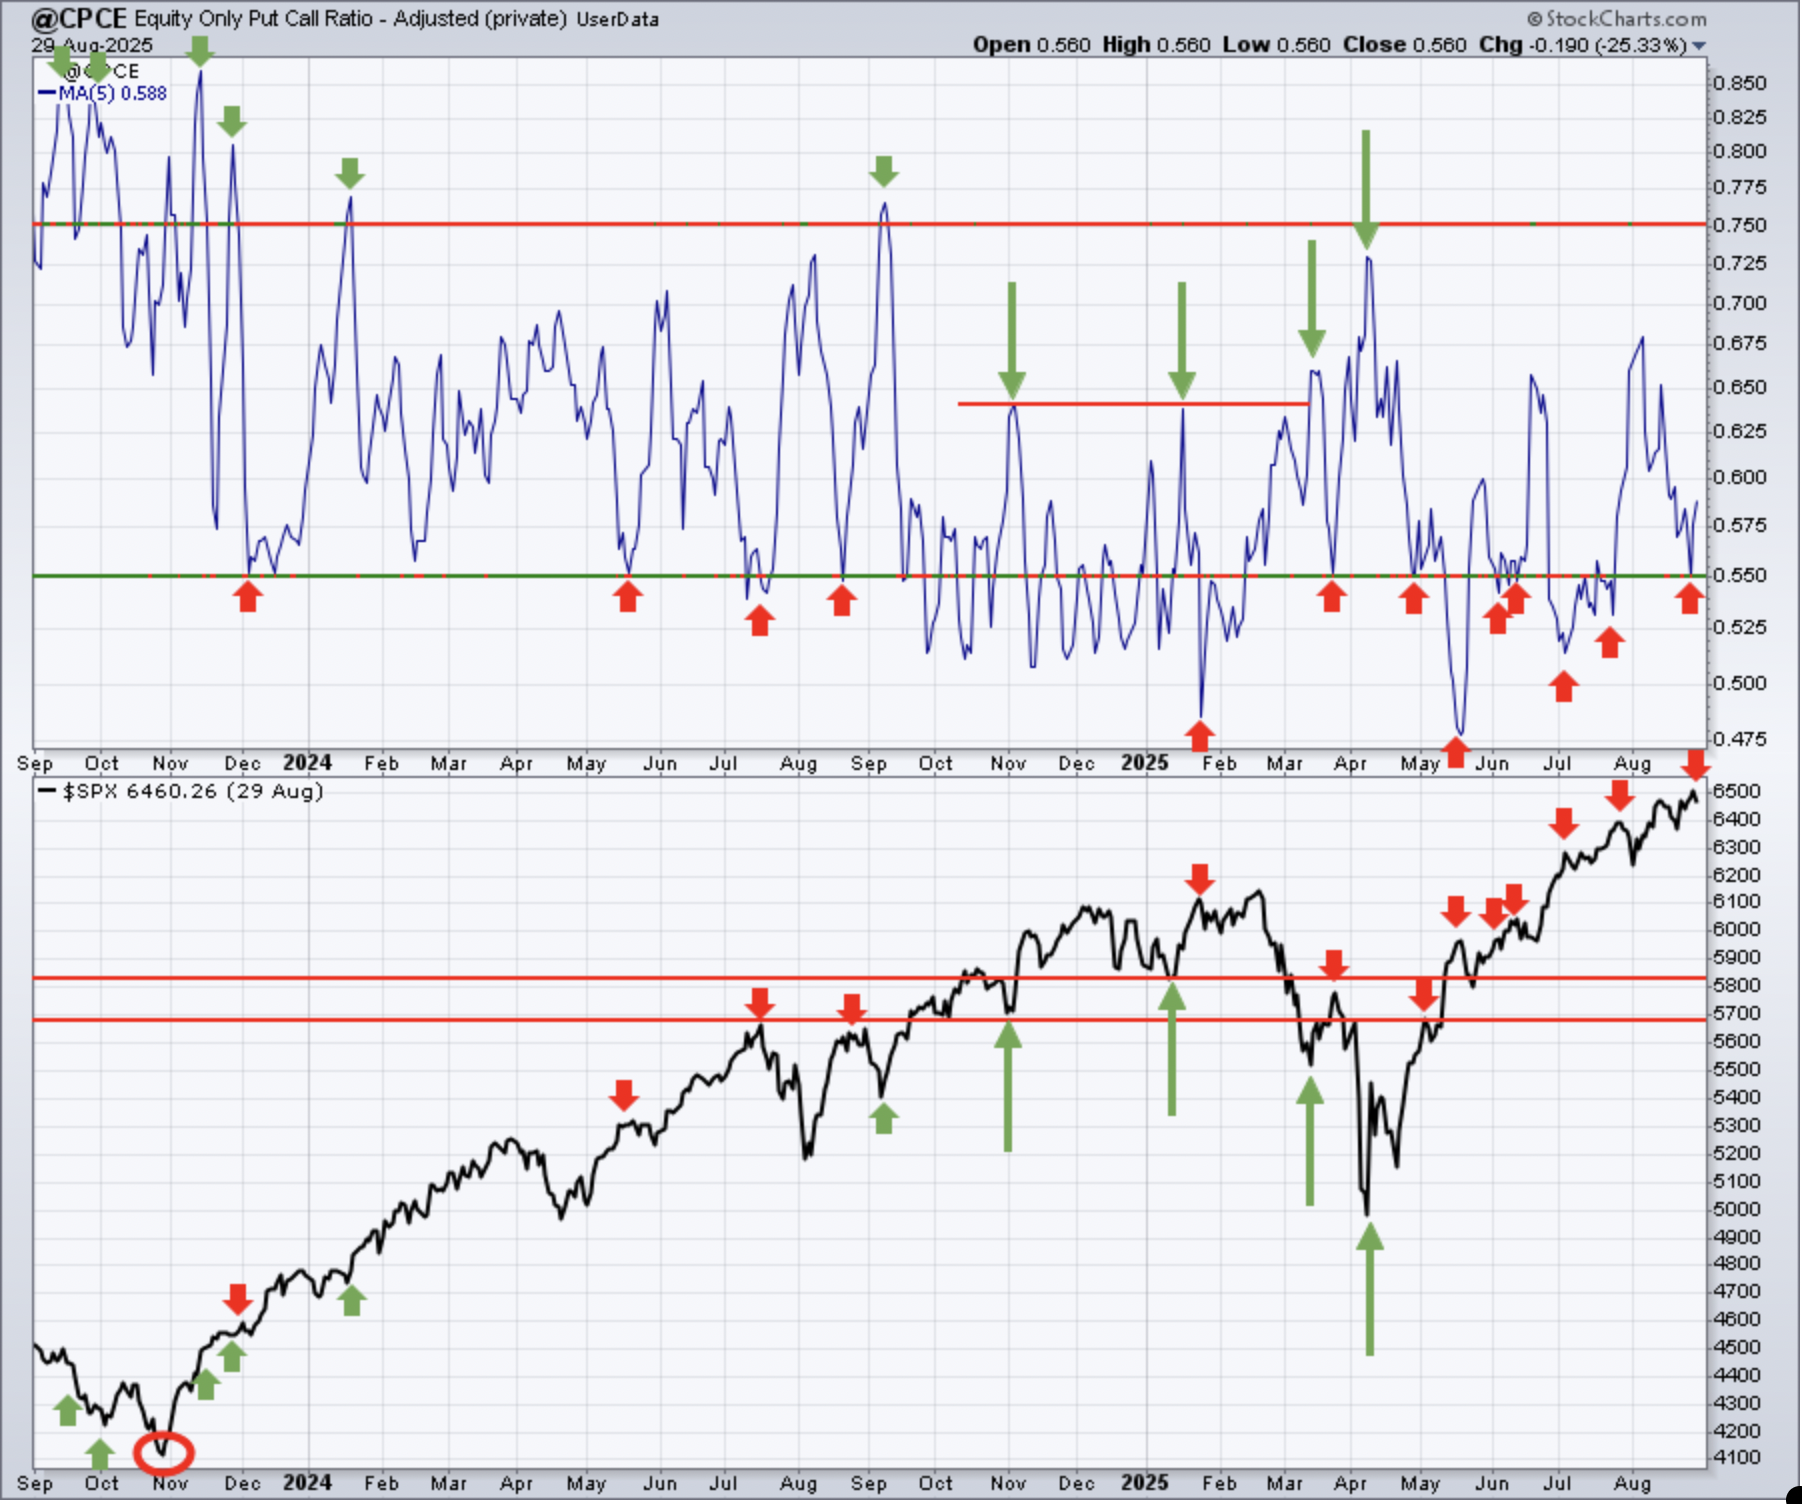
Sentiment indicators are contrarian indicators. When they show extreme bullishness, we need to be a bit cautious and when they show extreme pessimism, it could be time to become much more aggressive. Major market bottoms are carved out when pessimism is at its absolute highest level.
Keep in mind that the above 5-day SMA reading of the CPCE is our "speed boat" sentiment indicator that changes quite frequently. It was interesting to see the 5-day SMA of the CPCE touch the .55 level one more time last week as the S&P 500 printed its first closing high EVER above 6500. Perhaps that will mark a near-term top as consolidation hits U.S. stocks during September. For those that are more bearish, there's certainly no guarantee of any significant selling.
253-day SMA ($CPCE)
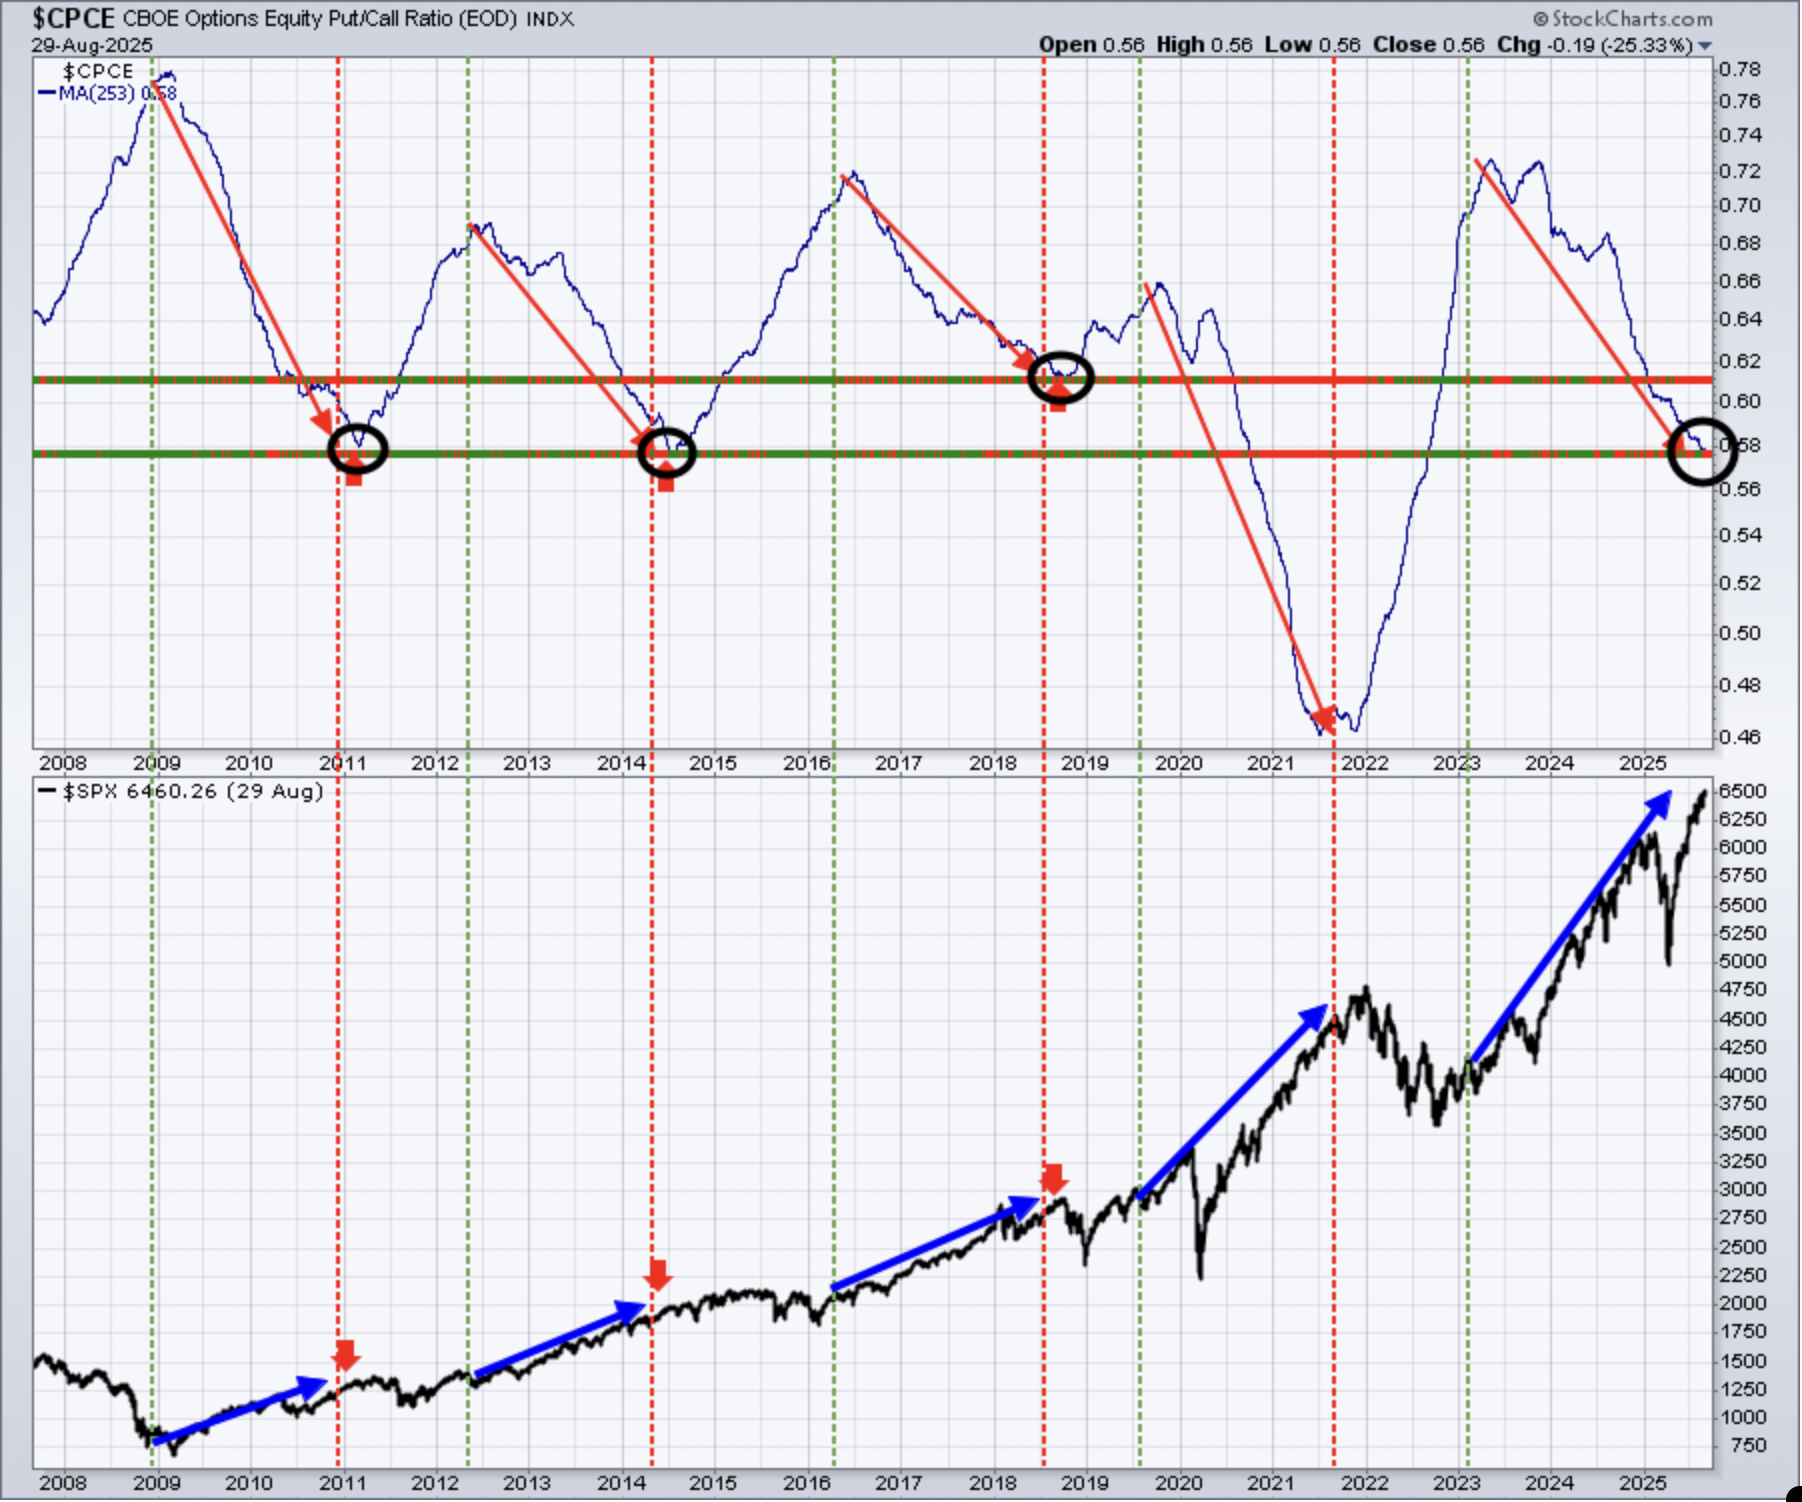
This longer-term 253-day SMA of the CPCE is our "ocean-liner" signal, unlike our short-term speedboat indicator. This one usually provides us a very solid long-term signal as the overall market environment moves from one of pessimism to complacency and vice versa. Look at the above chart. Nothing is changing here. When the 253-day SMA is moving lower like it is now, it accompanies our most bullish S&P 500 moves. I cannot think about being long-term bearish while this 253-day SMA keeps falling. I still won't rule out a bit of September selling, given history, but I find it extremely unlikely that we're on the precipice of a major market decline based upon current sentiment.
Long-Term Trade Setup
Since beginning this Weekly Market Report in September 2023, I've discussed the long-term trade candidates below that I really like. Generally, these stocks have excellent long-term track records, and many pay nice dividends that mostly grow every year. Only in specific cases (exceptions) would I consider a long-term entry into a stock that has a poor or limited long-term track record and/or pays no dividends. Below is a quick recap of how these stocks looked as of two weeks ago:
- JPM – consolidating the past several weeks, remains bullish
- BA – currently in an uptrend, I’m expecting a move to 270-280
- FFIV – is in all-time high territory
- MA – same, in all-time high territory
- GS – very bullish long-term chart, though somewhat overbought
- FDX – trending below its 20-month EMA and 50-month SMA, needs to clear both to the upside
- AAPL – recently discussed importance of RSI 50 on monthly chart, now back in uptrend
- CHRW – huge July move higher, followed by more buying in August – to all-time highs
- JBHT – remains in 2025 downtrend, I’m expecting April low to hold on any further weakness
- STX - long-term breakout in May has sent stock soaring
- HSY – has improved significantly, but needs to clear price resistance at 200
- DIS – another on the improve, but needing a breakout above 125
- MSCI – slow and steady advance, watch for 654 breakout level
- SBUX - remains squarely in the middle of a wide consolidation range between roughly 70 and 115
- KRE – remains in nice uptrend; should benefit from future rate cuts
- ED – trading above its rising 20-month EMA
- AJG – successfully testing its rising 20-month EMA
- NSC – could be breaking out of long-term cup with handle, measuring to 380
- RHI – very, very weak, with tons of price support at 30 and just below
- ADM – clearing its 20-month EMA for first time in two years
- BG – its primary short-term hurdle is clearing its declining 20-month EMA
- CVS – move back above 75 is what the bulls would like to see
- IPG – bouncing off 22.50 price support
- HRL - the last 18 months have been spent in a fairly narrow 27-35 range
- DE – dropped a bit with earnings recently, but remains in very bullish long-term uptrend
Keep in mind that our Weekly Market Reports favor those who are more interested in the long-term market picture. Therefore, the list of stocks above are stocks that we believe are safer (but nothing is ever 100% safe) to own with the long-term in mind. Nearly everything else we do at EarningsBeats.com favors short-term momentum trading, so I wanted to explain what we're doing with this list and why it's different.
Also, please keep in mind that I'm not a Registered Investment Advisor (and neither is EarningsBeats.com nor any of its employees) and am only providing (mostly) what I believe to be solid dividend-paying stocks for the long term. Companies periodically go through adjustments, new competition, restructuring, management changes, etc. that can have detrimental long-term impacts. Neither the stock price nor the dividend is ever guaranteed. I simply point out interesting stock candidates for longer-term investors. Do your own due diligence and please consult with your financial advisor before making any purchases or sales of securities.
Looking Ahead
Upcoming Earnings
The following list of companies is NOT a list of all companies scheduled to report quarterly earnings, however, just key reports, so please be sure to check for earnings dates of any companies that you own. Any company in BOLD represents a stock in one of our portfolios and the amount in parenthesis represents the market capitalization of each company listed:
- Monday: None
- Tuesday: ZS ($44 billion)
- Wednesday: CRM ($243 billion), HPE ($30 billion), CRDO ($23 billion)
- Thursday: AVGO ($1.45 trillion), LULU ($25 billion)
- Friday: None
Key Economic Reports
- Monday: None
- Tuesday: August PMI manufacturing, August ISM manufacturing, July construction spending
- Wednesday: July factory orders, July JOLTS, beige book
- Thursday: Initial jobless claims, ADP employment report, Q2 productivity & costs, August ISM services
- August nonfarm payrolls
Historical Data
I'm a true stock market historian. I am absolutely PASSIONATE about studying stock market history to provide us more clues about likely stock market direction and potential sectors/industries/stocks to trade. While I don't use history as a primary indicator, I'm always very aware of it as a secondary indicator. I love it when history lines up with my technical signals, providing me with much more confidence to make particular trades.
Below you'll find the next two weeks of historical data and tendencies across the three key indices that I follow most closely. The percentage for each calendar day represents the annualized return for that day. An example of how this is calculated is reflected next to the first day under the S&P 500 and in parenthesis:
S&P 500 (since 1950)
- Sep 1: +27.13% (Ex: cumulative gains = +4.50% over 42 trading days since 1950. +4.50% x 253/42 = +27.13%)
- Sep 2: +62.42%
- Sep 3: -8.63%
- Sep 4: -40.03%
- Sep 5: -19.14%
- Sep 6: +16.31%
- Sep 7: -8.58%
- Sep 8: +8.58%
- Sep 9: -41.43%
- Sep 10: -21.00%
- Sep 11: +22.45%
- Sep 12: +14.92%
- Sep 13: +14.64%
- Sep 14: +35.62%
NASDAQ (since 1971)
- Sep 1: +57.15%
- Sep 2: +75.21%
- Sep 3: -89.77%
- Sep 4: -51.66%
- Sep 5: -49.94%
- Sep 6: -8.20%
- Sep 7: +38.60%
- Sep 8: -6.25%
- Sep 9: -7.54%
- Sep 10: -2.65%
- Sep 11: +66.40%
- Sep 12: -0.43%
- Sep 13: +1.53%
- Sep 14: +65.92%
Russell 2000 (since 1987)
- Sep 1: +39.71%
- Sep 2: +94.68%
- Sep 3: -96.69%
- Sep 4: +34.66%
- Sep 5: -64.90%
- Sep 6: -15.74%
- Sep 7: +31.72%
- Sep 8: +50.64%
- Sep 9: -23.28%
- Sep 10: +2.26%
- Sep 11: +85.61%
- Sep 12: +65.58%
- Sep 13: +44.65%
- Sep 14: +58.36%
The S&P 500 data dates back to 1950, while the NASDAQ and Russell 2000 information date back to 1971 and 1987, respectively.
Final Thoughts
Well, the good news is that the S&P 500 set yet another all-time closing high on Thursday above the 6500 level. The bad news is that it occurred with little support from growth stocks. On the surface, we should always view this as a potential warning sign. It is mitigated somewhat by the simple fact that the strongest historical period for growth stocks just ended. Therefore, the lack of support from growth stocks could be nothing more than a brief seasonal influence. Here are a few things to keep in mind as we open up the month of September:
Jobs. Last month, the July jobs report came in quite weak and, if you recall, the May and June jobs numbers were revised downward by more than 250,000 jobs combined. That essentially resulted in 3 consecutive months where jobs were barely positive. We have the August jobs report on Friday with the consensus estimate at just 77,000 and, if they come in weak as well, it would almost guarantee us that the Fed will lower rates at the September meeting.
Interest-Rate-Sensitive Stocks. I'm expecting to see areas like regional banks continue to do well - at least on a relative basis. If, however, the Fed begins discussing the likelihood that the fed fund rate will remain unchanged at the September meeting, a lot of the recent strength in rate-sensitive stocks could fall apart. I don't expect it to happen, simply mentioning it, because I can't control the Fed's history of waffling on the subject of whether to cut rates or not. The case does seem to be building among Fed officials to cut rates 25 bps in two weeks.
Technical Conditions. While it was great to see the S&P 500 pierce the 6500 level for the first time ever on Thursday's close, we need to acknowledge the failure to sustain that breakout on Friday and the heavy rotation away from many high-octane growth stocks. That can lead to further deterioration in equity prices, especially given the seasonally-week September on the horizon.
Seasonality. Well, it's September. Historically, that's not been good for stocks. I will say this. While September has easily been the worst calendar month for U.S. stocks since 1950, the 2nd half of the month has historically been much more bearish than the 1st half. I provided some numbers on that in the September Seasonality Report, so be sure to check that out, if you haven't already.
Happy trading!
Tom