
EB Weekly Market Report - Monday, September 8, 2025
Schedule Changes This Week
I'm traveling and in Redmond, WA this week, meeting with the StockCharts.com team throughout the week. As a result, we will have a modified schedule. There was no Weekly Market Recap video this weekend and there'll be no Trading Places Live show on Tuesday morning nor Live Trading Room on Wednesday. We did update ChartLists over the weekend, but I'll be in travel mode to start the upcoming weekend, so ChartLists will next be updated the weekend of Friday, September 19th.
The Weekly Portfolio Report was not produced as of Friday, September 5th, but will return for the week ending Friday, September 12th.
ChartLists/Spreadsheets
The following ChartLists/Spreadsheets were updated over the weekend:
- Strong Earnings (SECL)
- Strong Future Earnings (SFECL)
- Raised Guidance (RGCL)
- Bullish Trifecta (BTCL)
- Leading Stock (LSCL)
- Key Manipulation Spreadsheet
The above ChartLists and spreadsheet have been updated on our website.
Weekly Market Recap
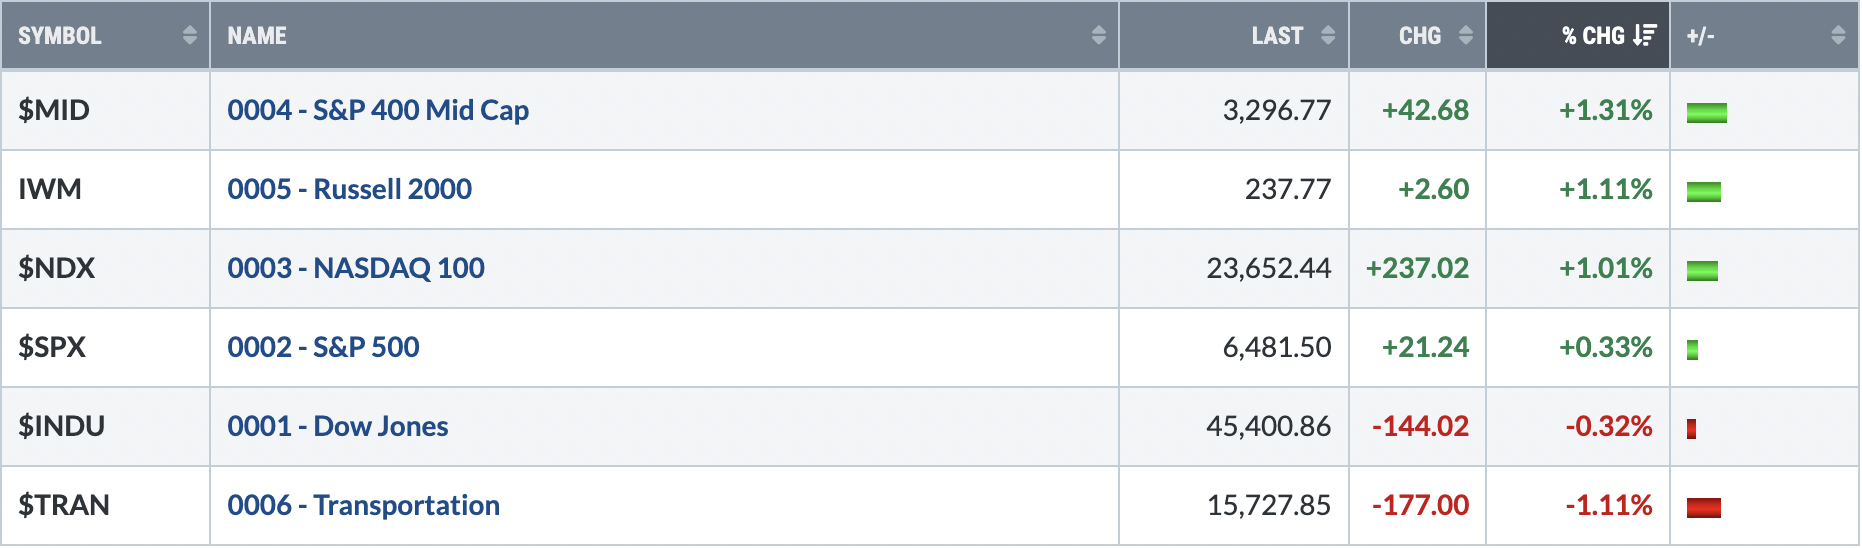
Major Indices
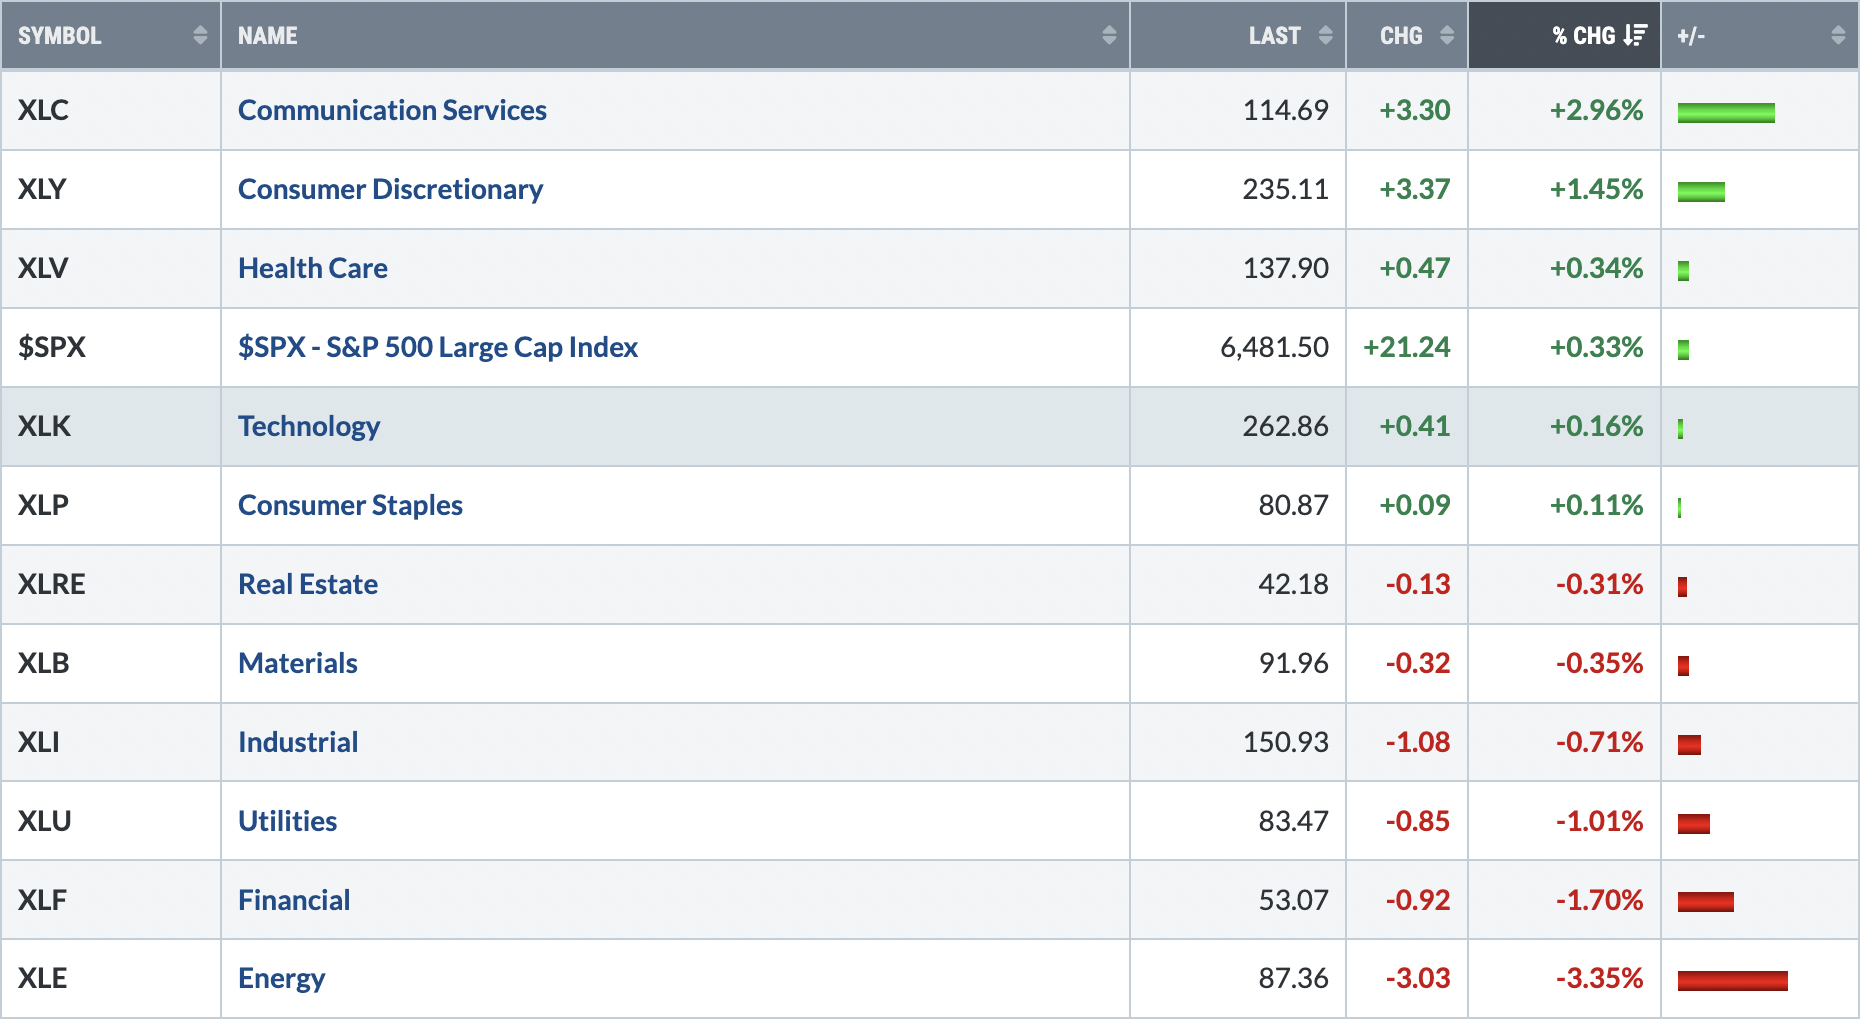
Sectors
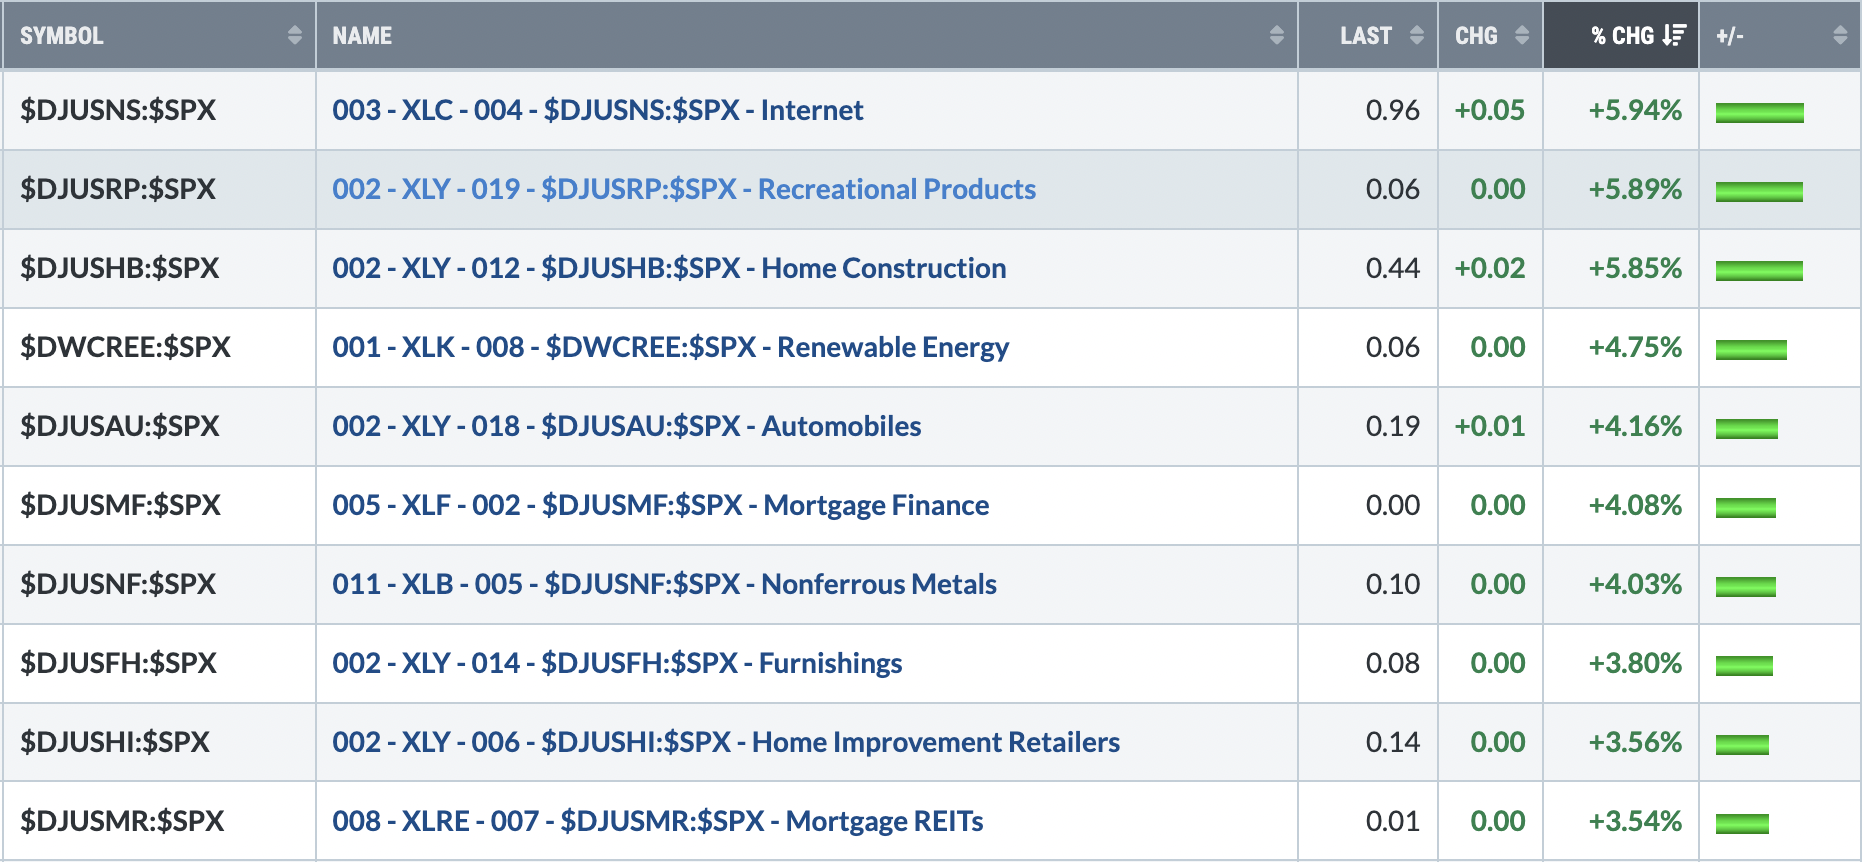
Top 10 Industries Last Week
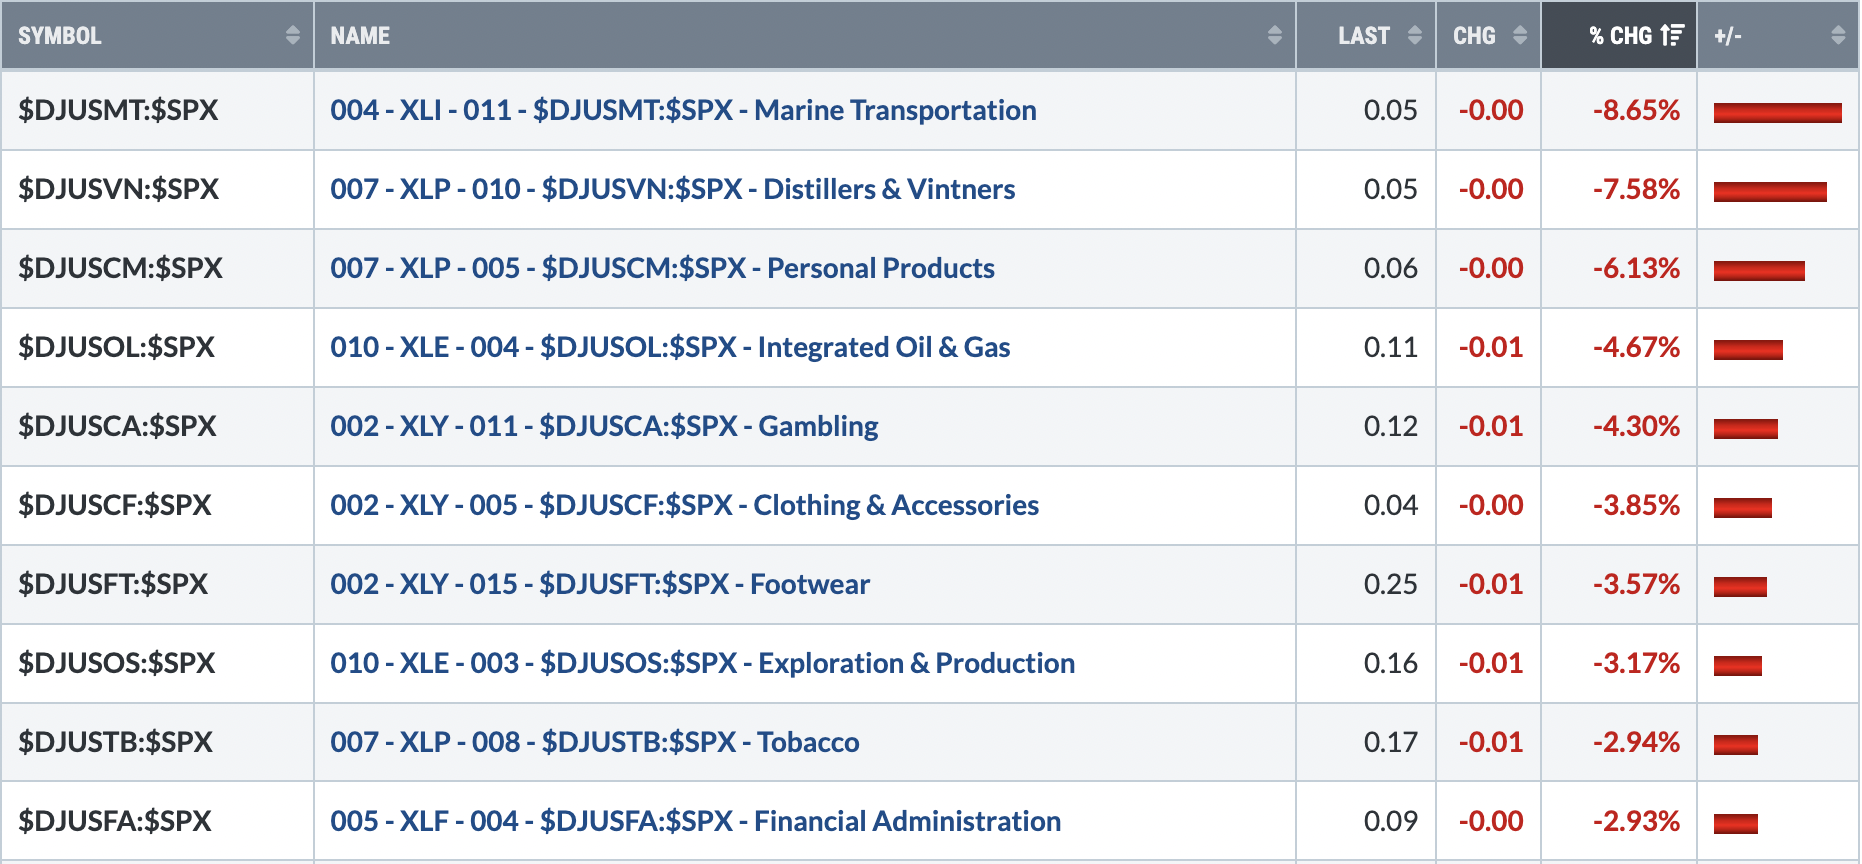
Bottom 10 Industries Last Week
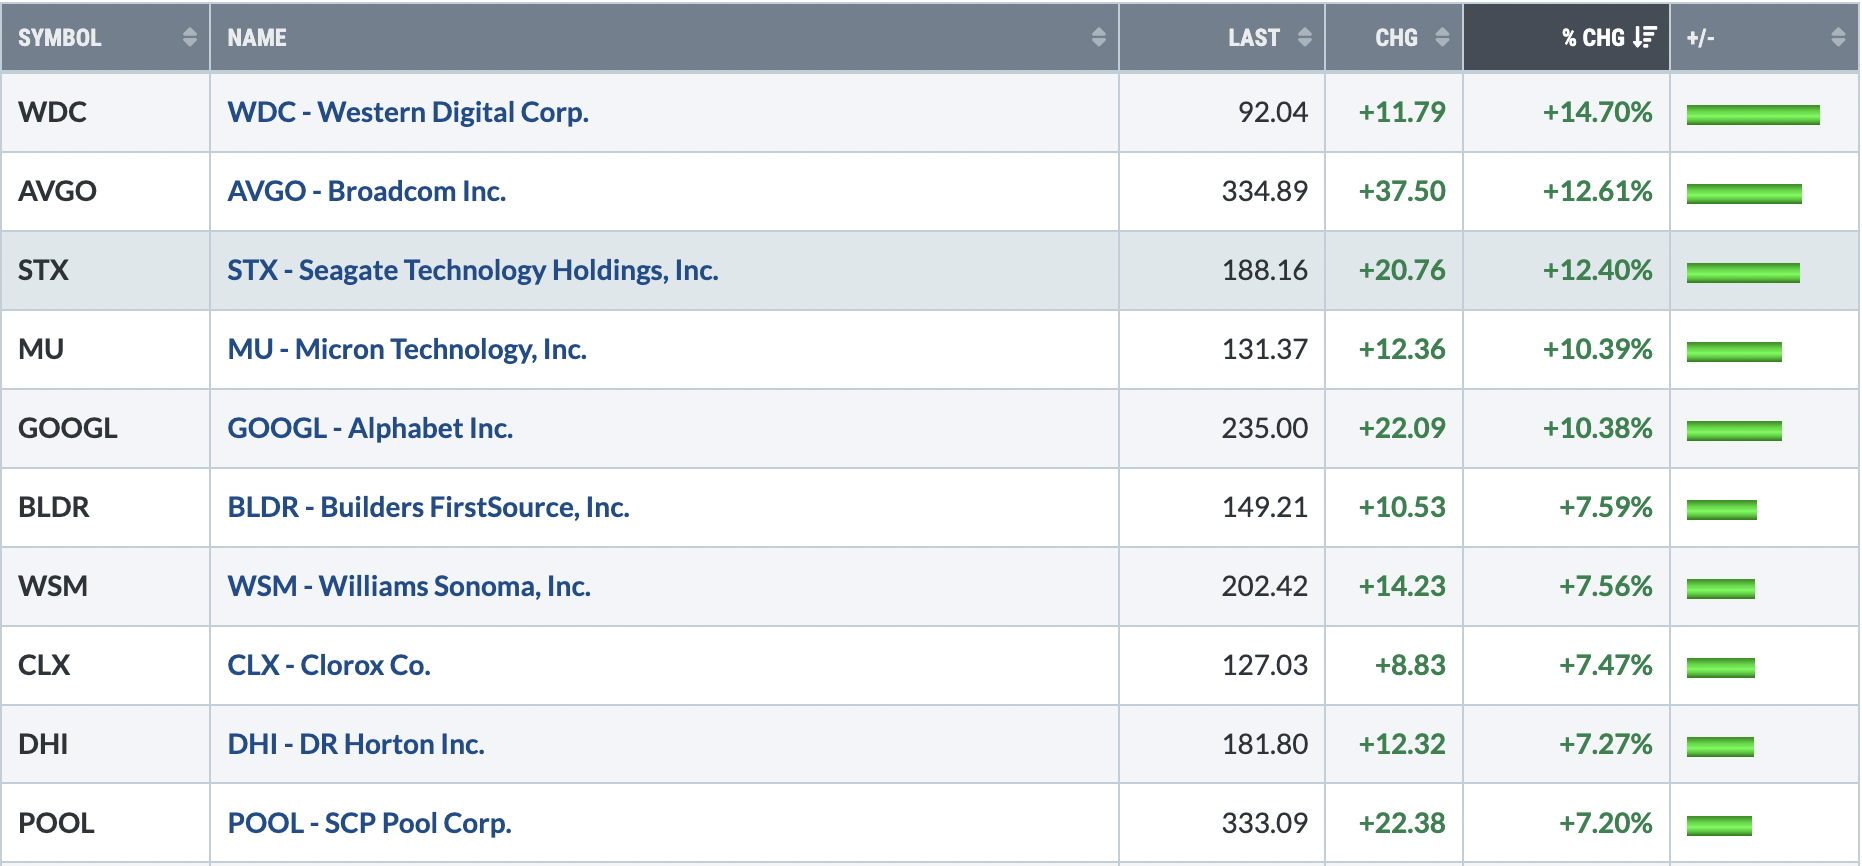
Top 10 Stocks - S&P 500/NASDAQ 100
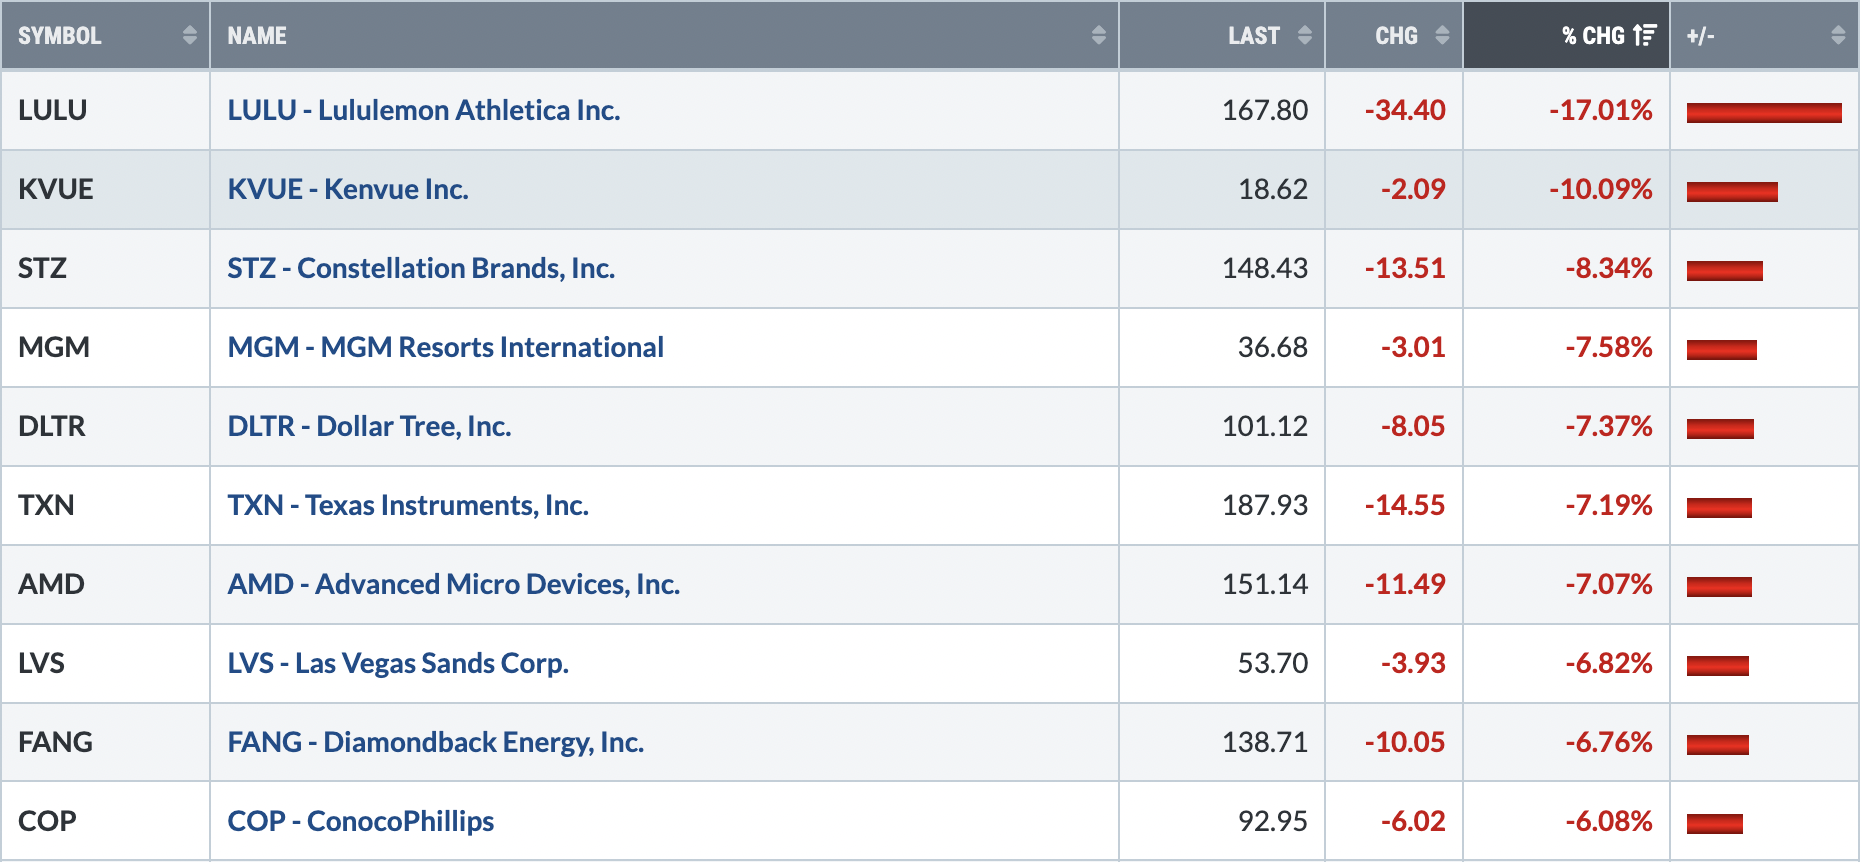
Bottom 10 Stocks - S&P 500/NASDAQ 100
Big Picture
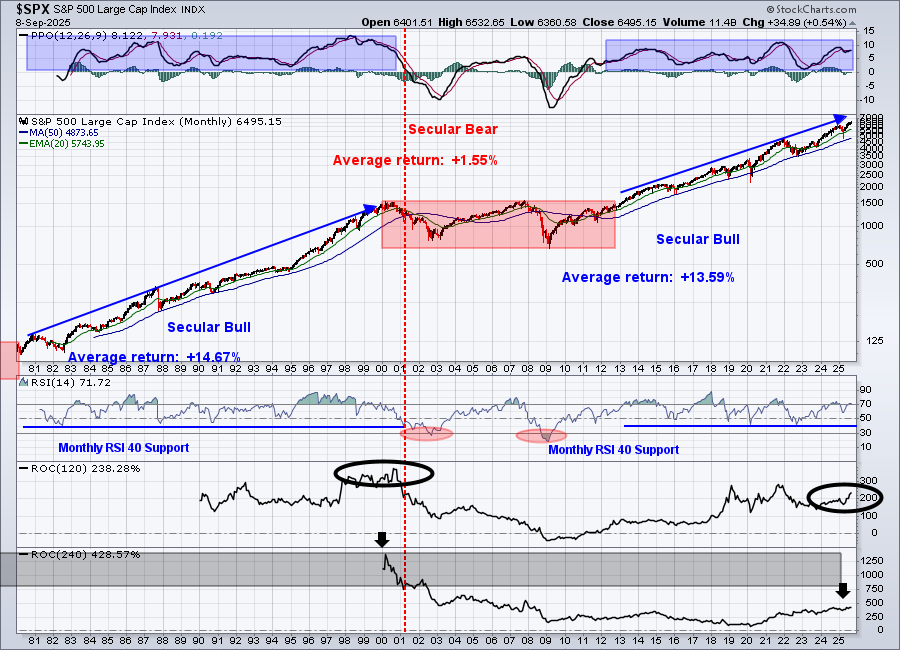
The overall market performance remains quite solid, especially considering the time of the year. I would simply further caution everyone from expecting too much from the stock market, especially during the notably weak historical tendencies during the second half of September.
Sustainability Ratios
Here's the latest look at our key intraday ratios as we follow where the money is traveling on an INTRADAY basis (ignoring gaps):
QQQ:SPY
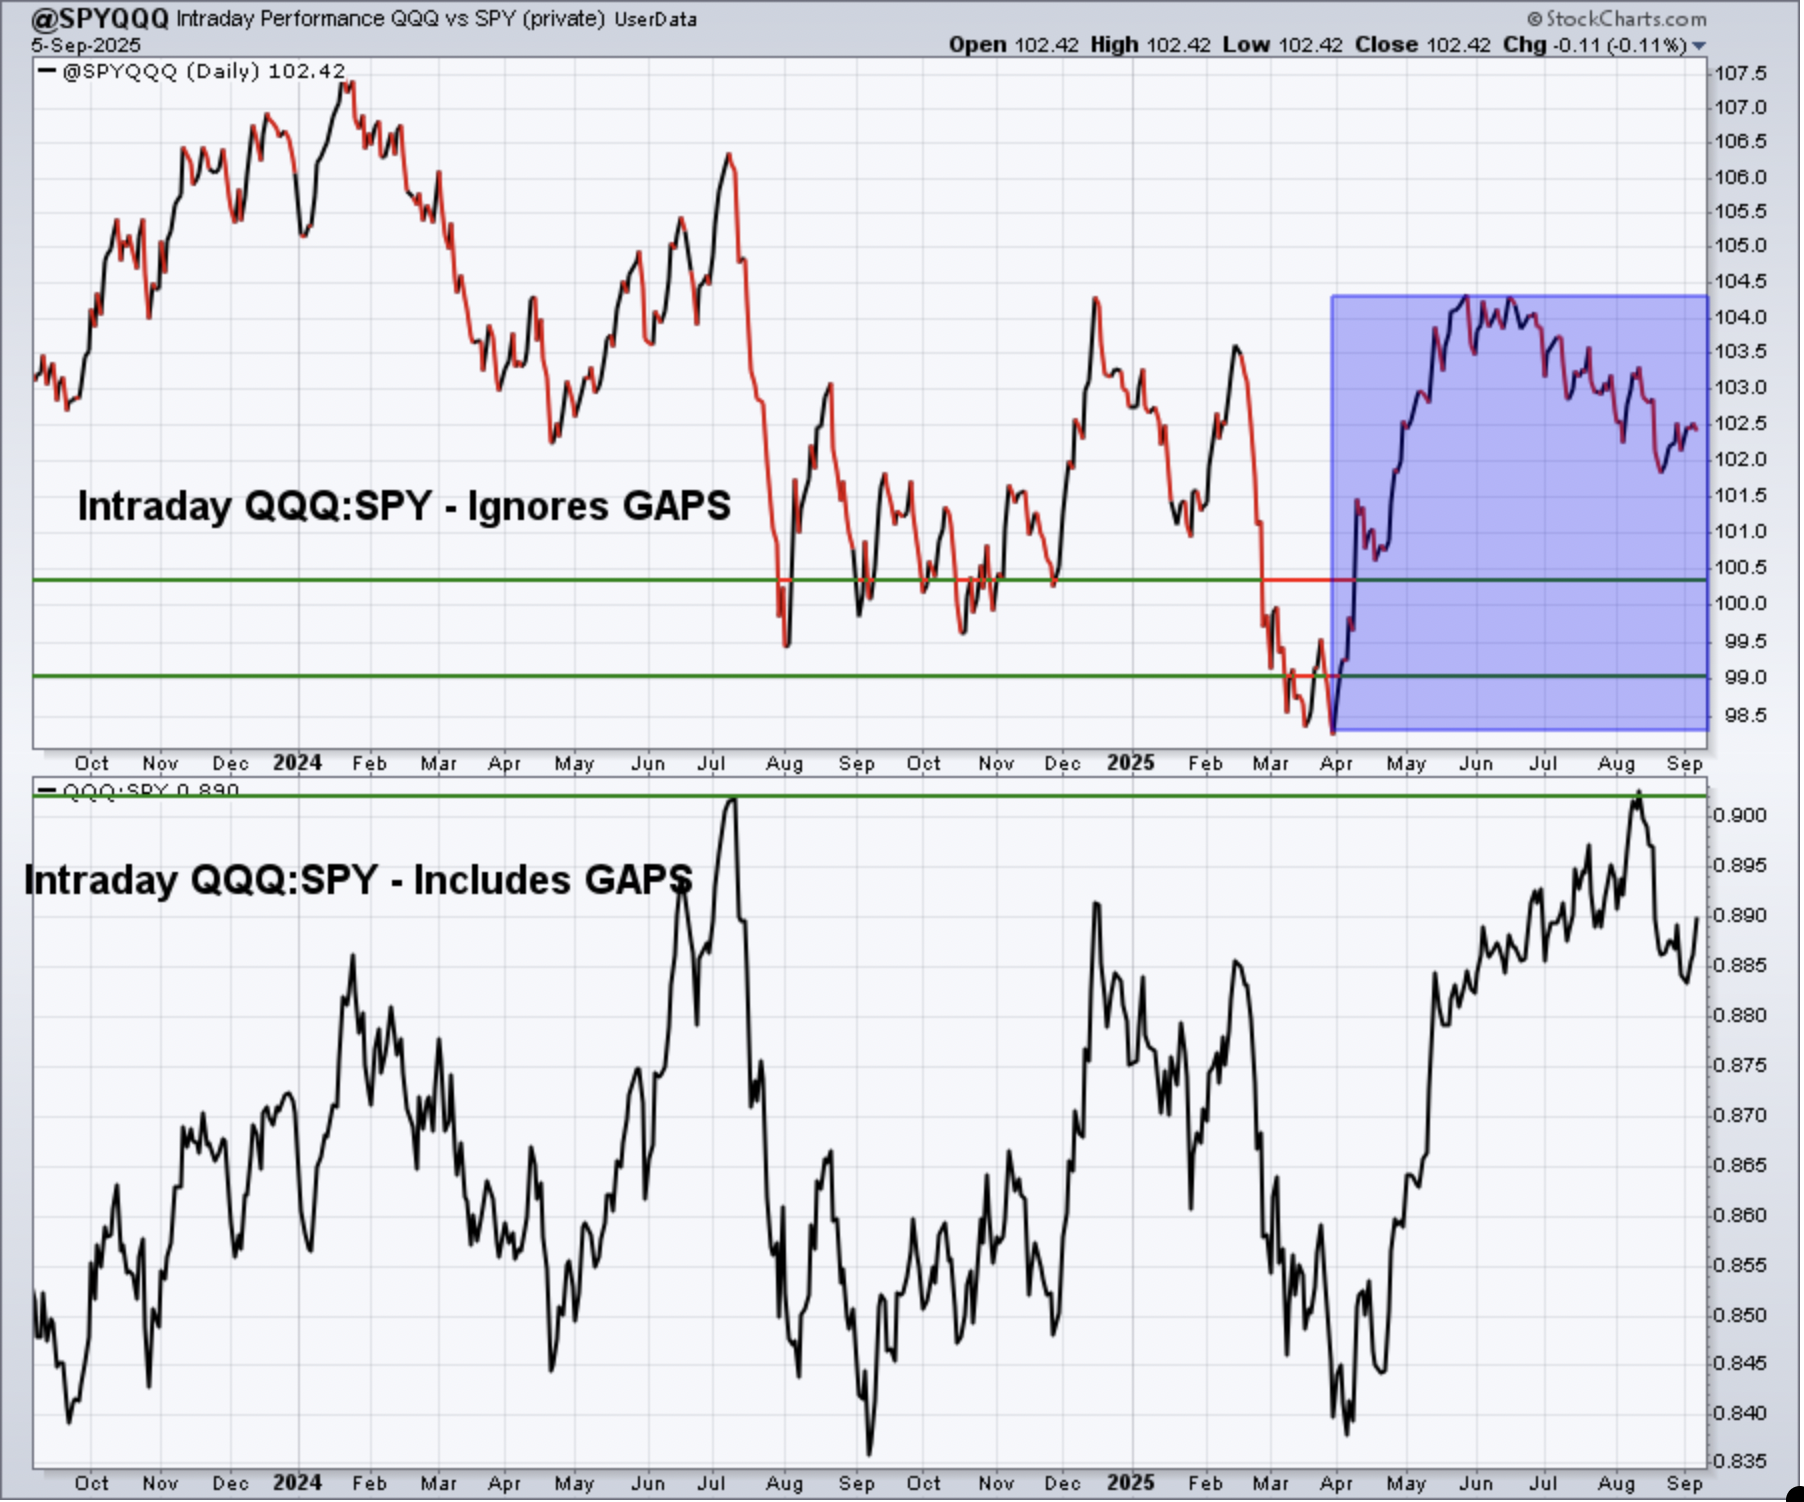
This ratio has turned higher in September, but still feels like it's in an overall downtrend. I'm fairly neutral based on this chart, but understand we still have a lot of September to get through.
IWM:QQQ
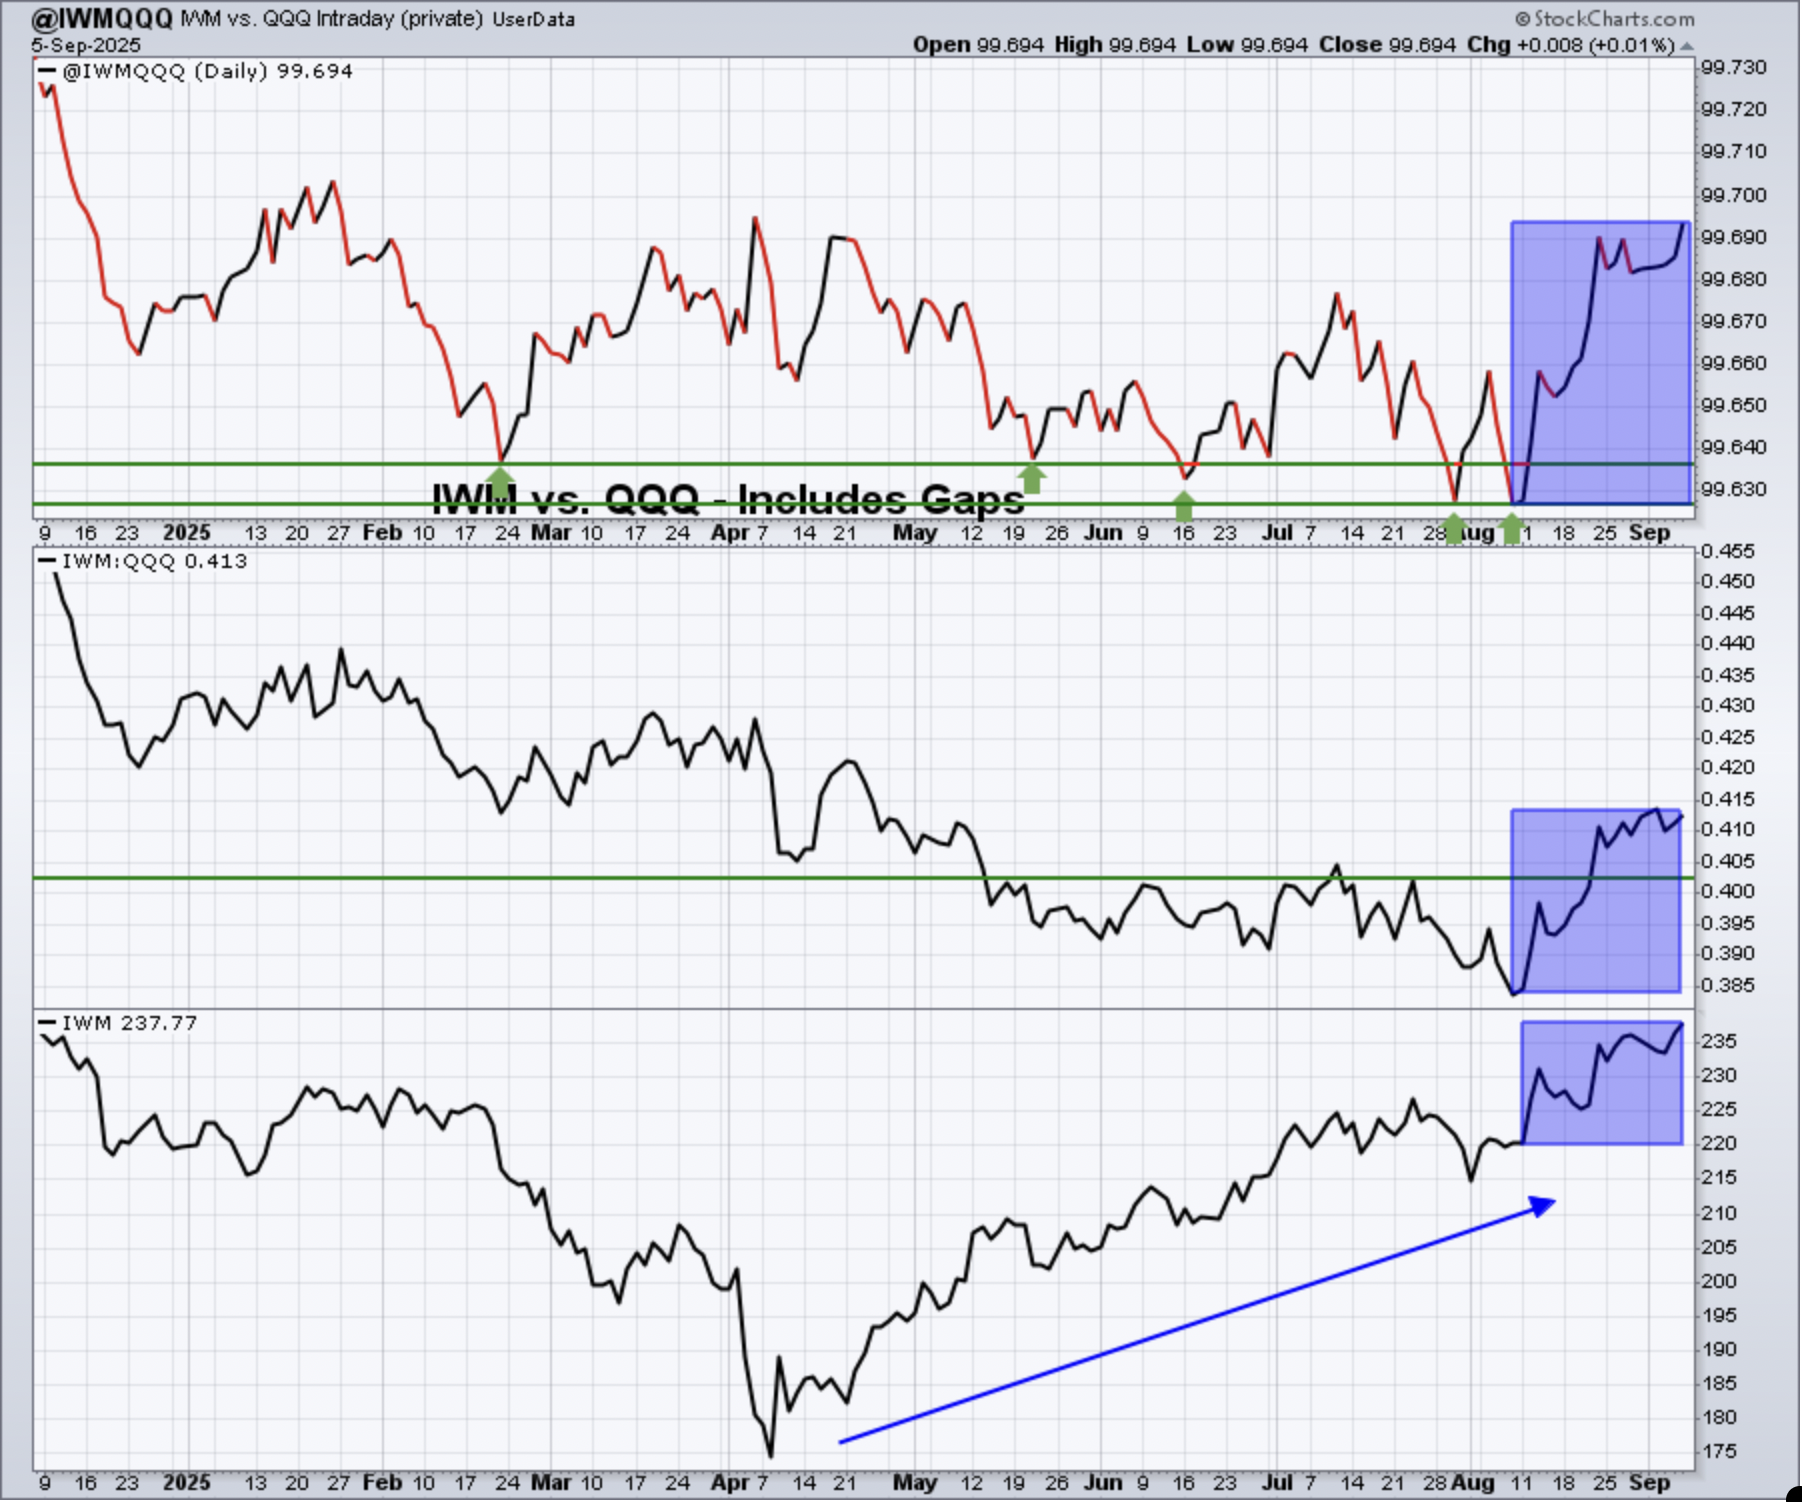
I love the rotation that's taking place here towards small caps. It's nice to see the IWM climbing (bottom panel), but the top part of the chart shows the relative performance of the small cap IWM to the large cap QQQ throughout the trading day - from open to close. As long as the current uptrend remains in play, the IWM is the better investment/trading alternative.
XLY:XLP
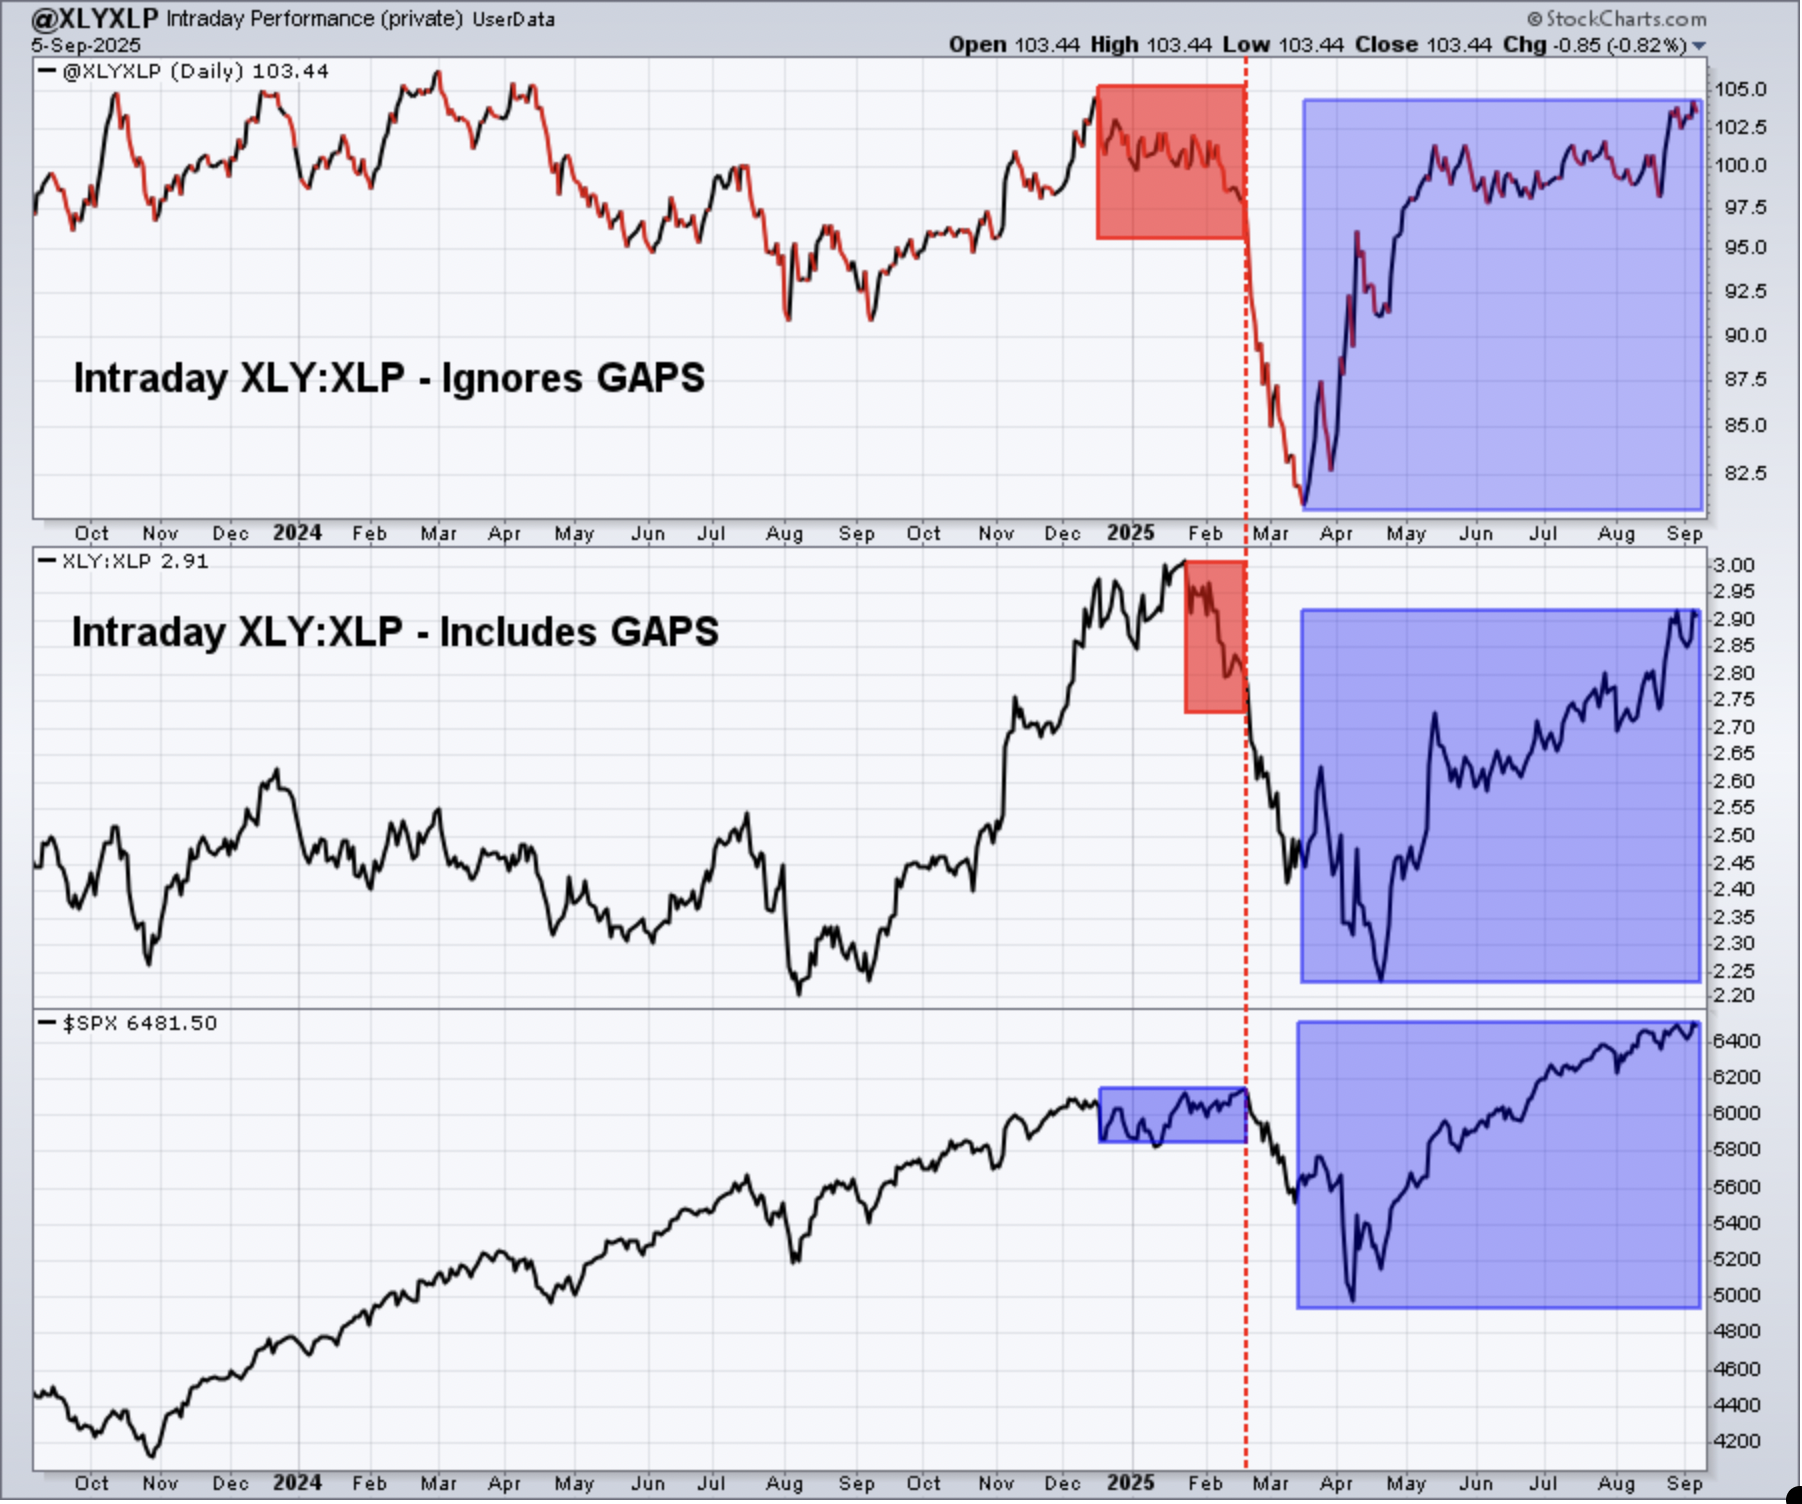
The blue-shaded area tells us essentially all we need to know about the stock market. This ratio is clear evidence that the big Wall Street firms prefer the more aggressive consumer discretionary group (XLY) vs. its consumer staples counterparts (XLP). There is a VERY strong positive correlation between the direction of this XLY:XLP ratio and the direction of the benchmark S&P 500. I believe the uptrend here reflects the high likelihood that the S&P 500 is going higher in Q4, not lower. Again, though, we do still need to navigate September.
Sentiment
5-day SMA ($CPCE)
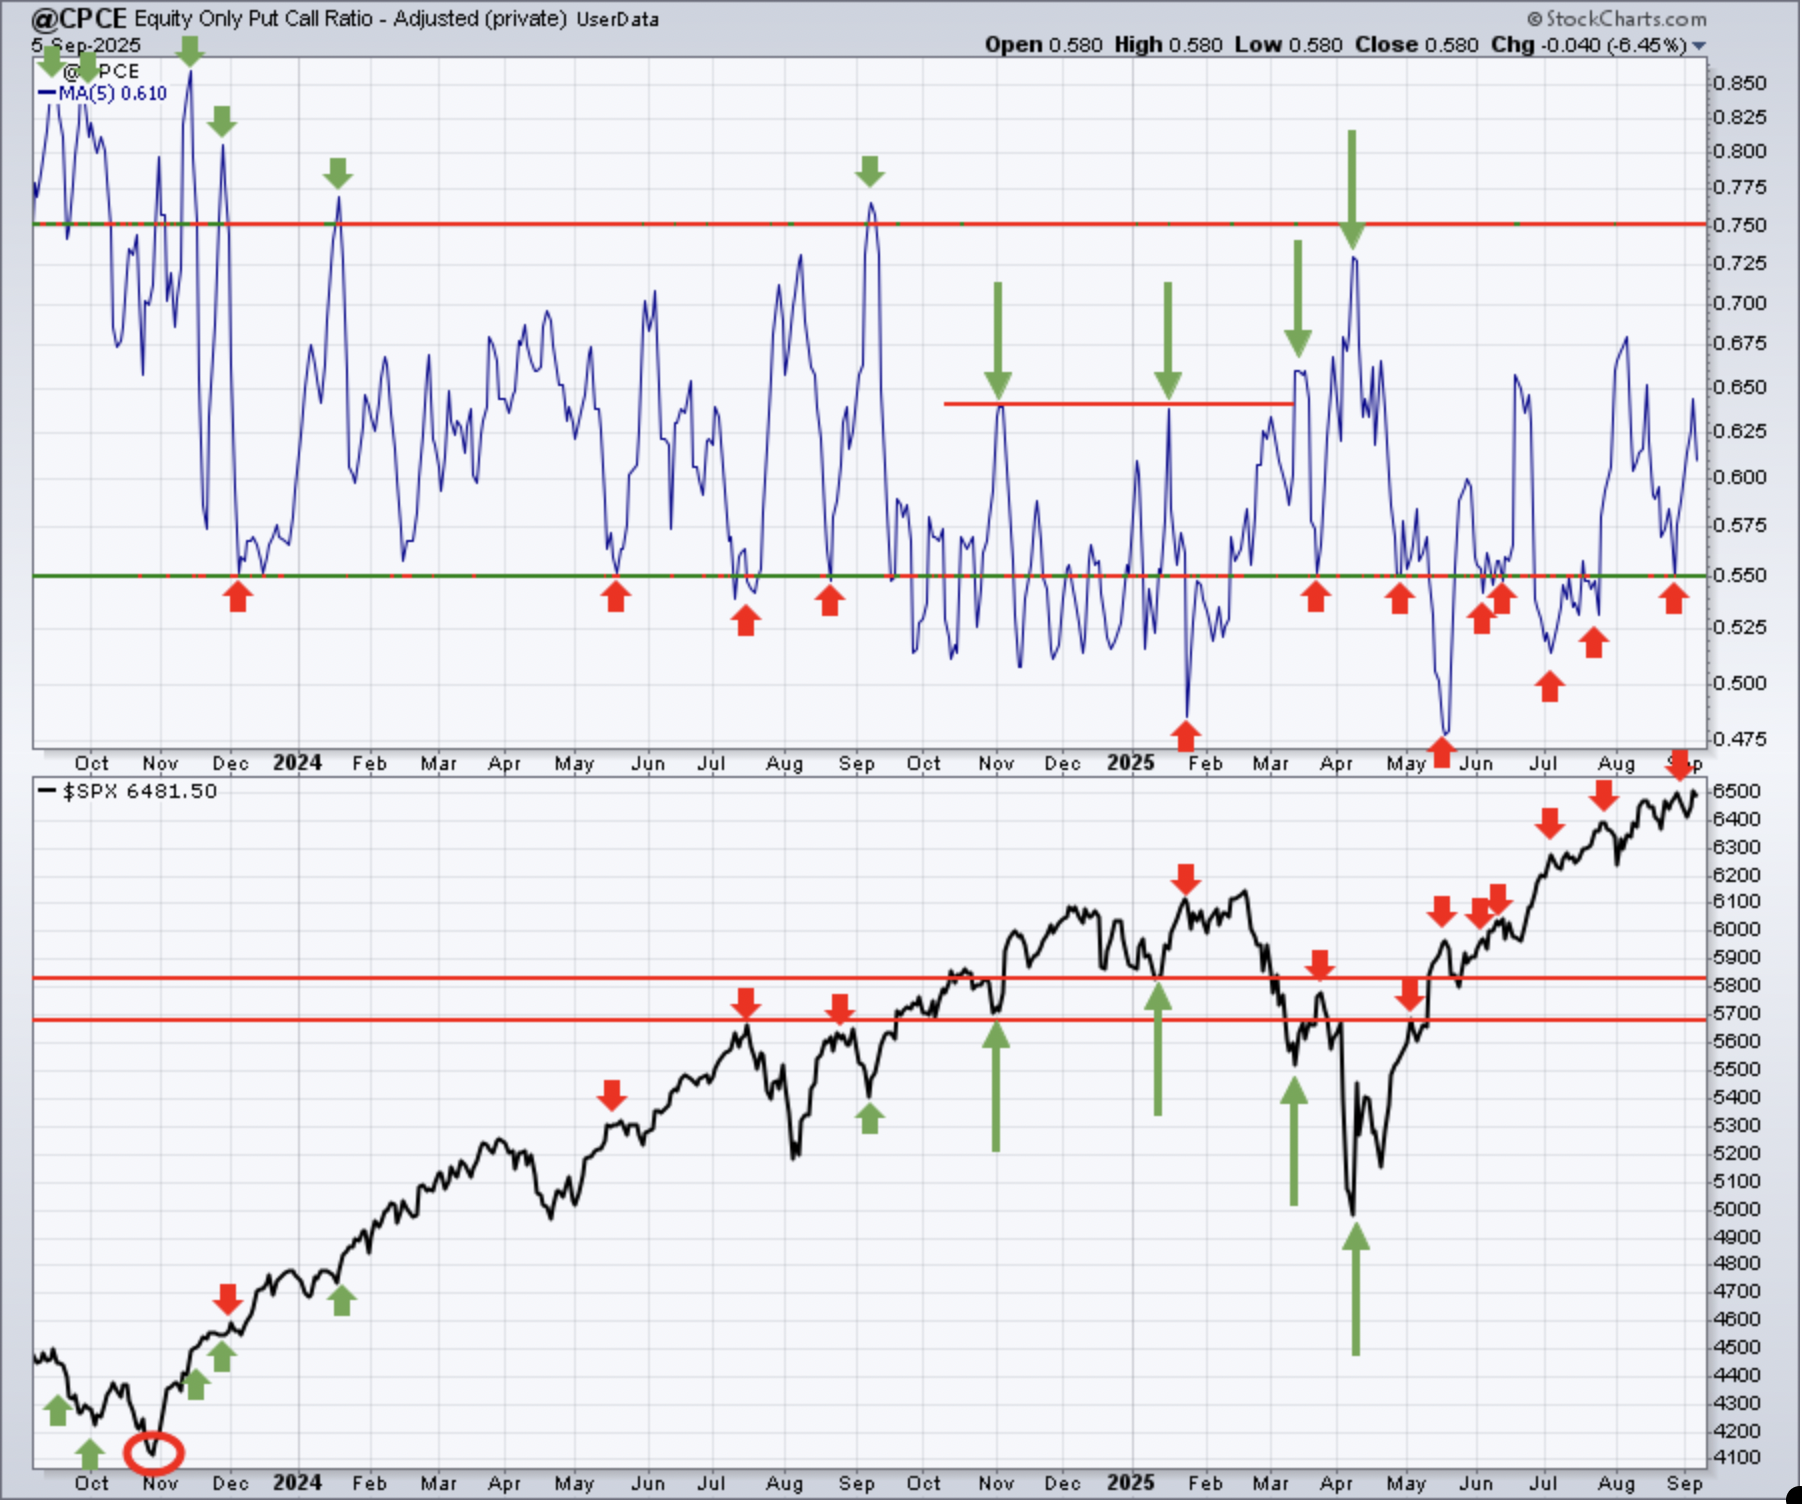
Sentiment indicators are contrarian indicators. When they show extreme bullishness, we need to be a bit cautious and when they show extreme pessimism, it could be time to become much more aggressive. Major market bottoms are carved out when pessimism is at its absolute highest level.
Keep in mind that the above 5-day SMA reading of the CPCE is our "speed boat" sentiment indicator that changes quite frequently. It was interesting to see the 5-day SMA of the CPCE touch the .55 level one more time recently as the S&P 500 printed its first closing high EVER above 6500. That still could mark a near-term top as consolidation many times hits U.S. stocks during September.
253-day SMA ($CPCE)
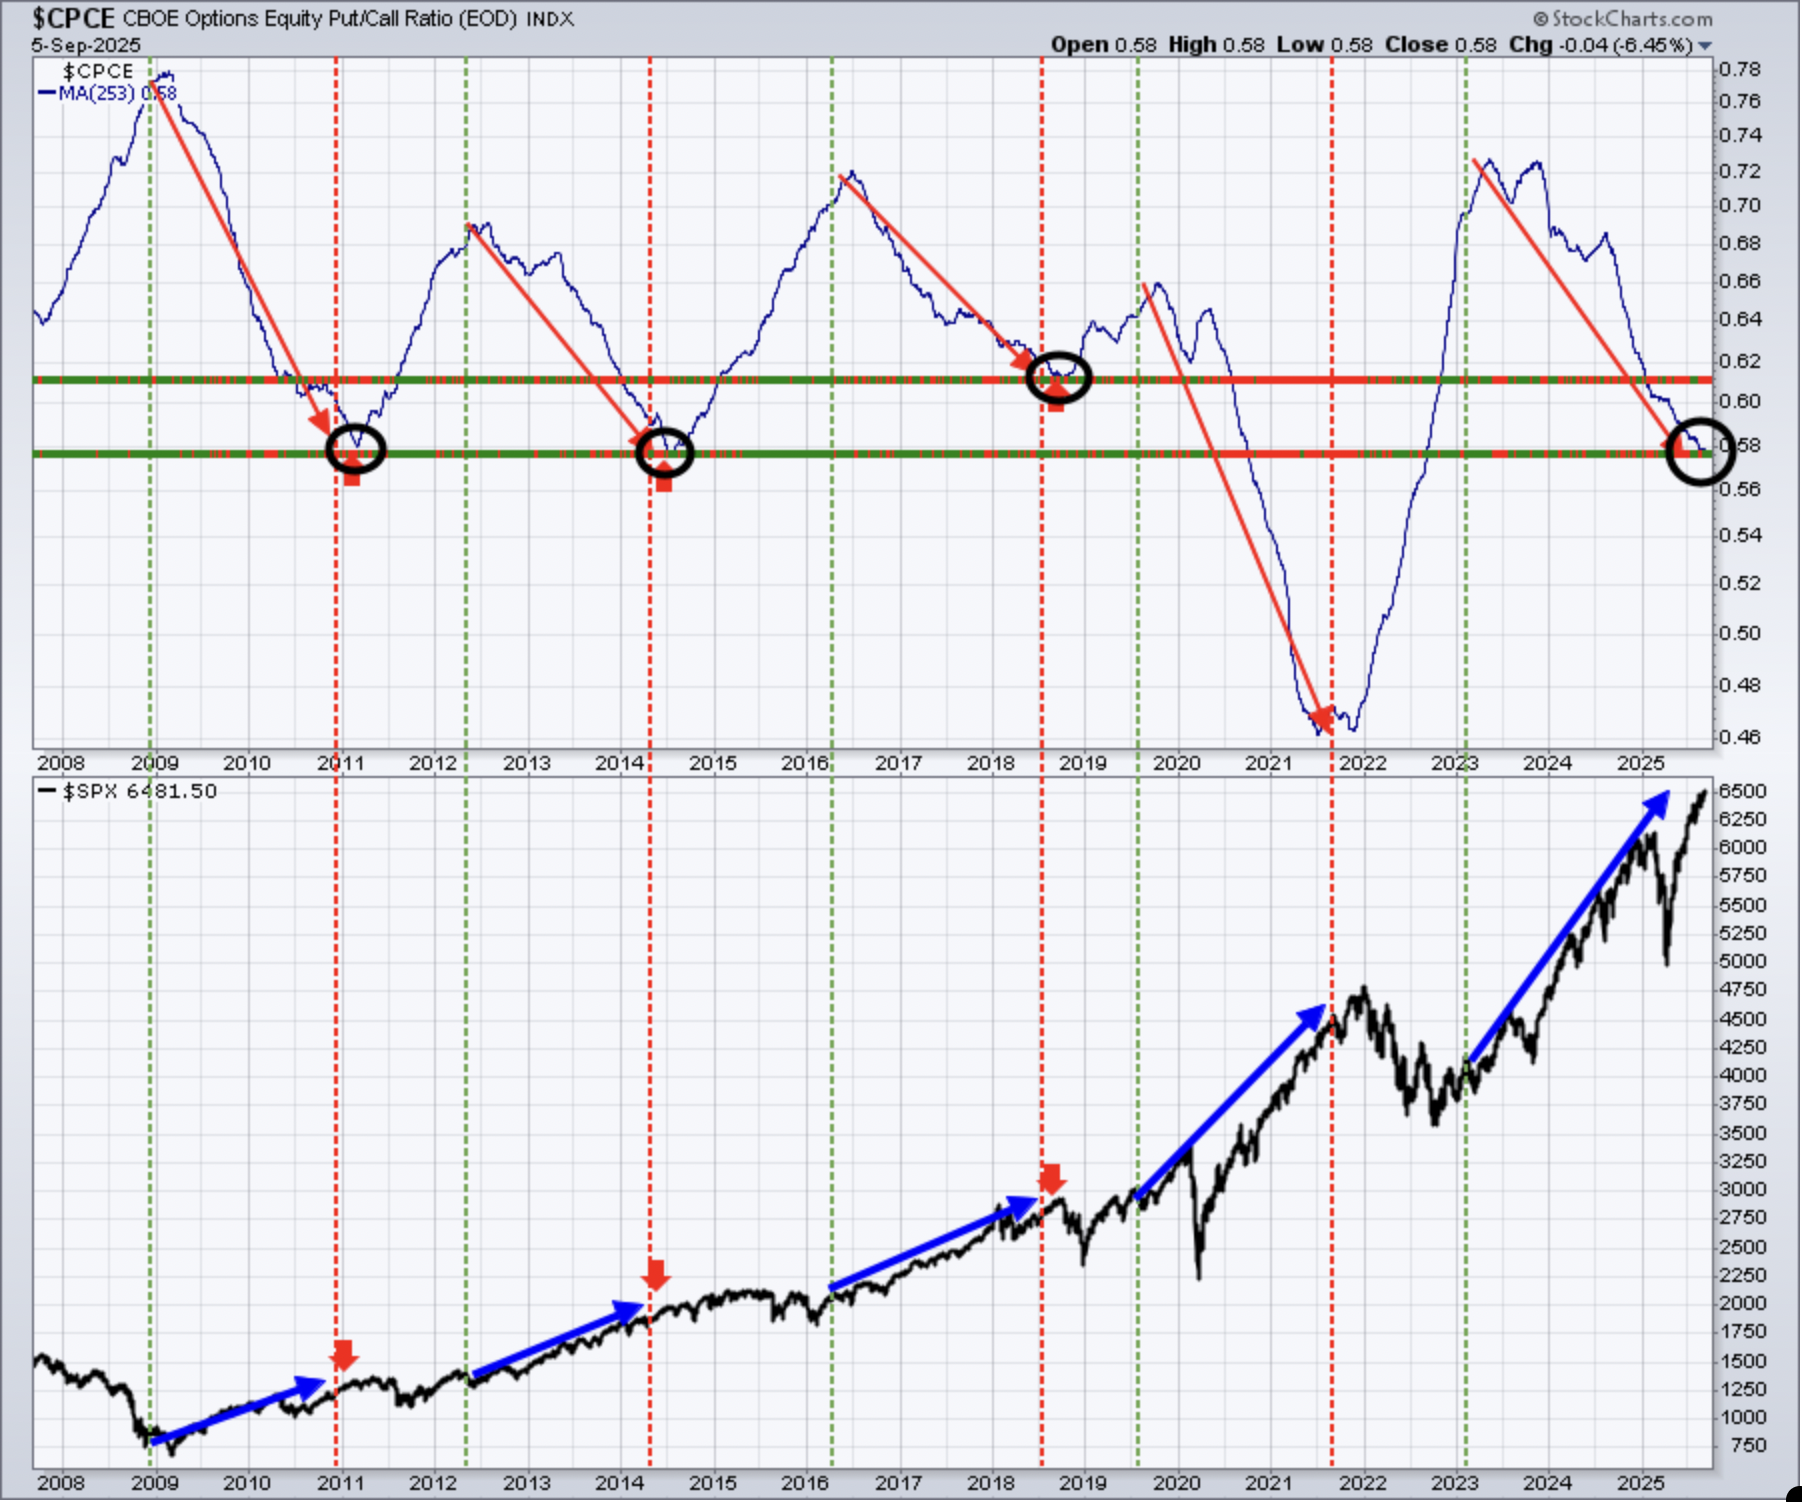
This longer-term 253-day SMA of the CPCE is our "ocean-liner" signal, unlike our short-term speedboat indicator. This one usually provides us a very solid long-term signal as the overall market environment moves from one of pessimism to complacency and vice versa. Look at the above chart. As I've been saying, nothing is changing here. When the 253-day SMA is moving lower like it is now, it accompanies our most bullish S&P 500 moves. I cannot think about being long-term bearish while this 253-day SMA keeps falling. I cannot rule out a bit of September selling, given history, but I find it extremely unlikely that we're on the precipice of a major market decline based upon current sentiment.
Long-Term Trade Setup
Since beginning this Weekly Market Report in September 2023, I've discussed the long-term trade candidates below that I really like. Generally, these stocks have excellent long-term track records, and many pay nice dividends that mostly grow every year. Only in specific cases (exceptions) would I consider a long-term entry into a stock that has a poor or limited long-term track record and/or pays no dividends. Below is a quick recap of how these stocks looked as of three weeks ago:
- JPM – consolidating the past several weeks, remains bullish
- BA – currently in an uptrend, I’m expecting a move to 270-280
- FFIV – is in all-time high territory
- MA – same, in all-time high territory
- GS – very bullish long-term chart, though somewhat overbought
- FDX – trending below its 20-month EMA and 50-month SMA, needs to clear both to the upside
- AAPL – recently discussed importance of RSI 50 on monthly chart, now back in uptrend
- CHRW – huge July move higher, followed by more buying in August – to all-time highs
- JBHT – remains in 2025 downtrend, I’m expecting April low to hold on any further weakness
- STX - long-term breakout in May has sent stock soaring
- HSY – has improved significantly, but needs to clear price resistance at 200
- DIS – another on the improve, but needing a breakout above 125
- MSCI – slow and steady advance, watch for 654 breakout level
- SBUX - remains squarely in the middle of a wide consolidation range between roughly 70 and 115
- KRE – remains in nice uptrend; should benefit from future rate cuts
- ED – trading above its rising 20-month EMA
- AJG – successfully testing its rising 20-month EMA
- NSC – could be breaking out of long-term cup with handle, measuring to 380
- RHI – very, very weak, with tons of price support at 30 and just below
- ADM – clearing its 20-month EMA for first time in two years
- BG – its primary short-term hurdle is clearing its declining 20-month EMA
- CVS – move back above 75 is what the bulls would like to see
- IPG – bouncing off 22.50 price support
- HRL - the last 18 months have been spent in a fairly narrow 27-35 range
- DE – dropped a bit with earnings recently, but remains in very bullish long-term uptrend
Keep in mind that our Weekly Market Reports favor those who are more interested in the long-term market picture. Therefore, the list of stocks above are stocks that we believe are safer (but nothing is ever 100% safe) to own with the long-term in mind. Nearly everything else we do at EarningsBeats.com favors short-term momentum trading, so I wanted to explain what we're doing with this list and why it's different.
Also, please keep in mind that I'm not a Registered Investment Advisor (and neither is EarningsBeats.com nor any of its employees) and am only providing (mostly) what I believe to be solid dividend-paying stocks for the long term. Companies periodically go through adjustments, new competition, restructuring, management changes, etc. that can have detrimental long-term impacts. Neither the stock price nor the dividend is ever guaranteed. I simply point out interesting stock candidates for longer-term investors. Do your own due diligence and please consult with your financial advisor before making any purchases or sales of securities.
Looking Ahead
Upcoming Earnings
The following list of companies is NOT a list of all companies scheduled to report quarterly earnings, however, just key reports, so please be sure to check for earnings dates of any companies that you own. Any company in BOLD represents a stock in one of our portfolios and the amount in parenthesis represents the market capitalization of each company listed:
- Monday: None
- Tuesday: ORCL ($626 billion), SNPS ($93 billion), RBRK ($17 billion)
- Wednesday: None
- Thursday: ADBE ($146 billion), KR ($45 billion)
- Friday: None
Key Economic Reports
- Monday: None
- Tuesday: None
- Wednesday: August PPI
- Thursday: Initial jobless claims, August CPI
- Friday: September consumer sentiment
Historical Data
I'm a true stock market historian. I am absolutely PASSIONATE about studying stock market history to provide us more clues about likely stock market direction and potential sectors/industries/stocks to trade. While I don't use history as a primary indicator, I'm always very aware of it as a secondary indicator. I love it when history lines up with my technical signals, providing me with much more confidence to make particular trades.
Below you'll find the next two weeks of historical data and tendencies across the three key indices that I follow most closely. The percentage for each calendar day represents the annualized return for that day. An example of how this is calculated is reflected next to the first day under the S&P 500 and in parenthesis:
S&P 500 (since 1950)
- Sep 8: +8.58% (Ex: cumulative gains = +1.80% over 53 trading days since 1950. +1.80% x 253/53 = +8.58%)
- Sep 9: -41.43%
- Sep 10: -21.00%
- Sep 11: +22.45%
- Sep 12: +14.92%
- Sep 13: +14.64%
- Sep 14: +35.62%
- Sep 15: -17.96%
- Sep 16: +77.18%
- Sep 17: -59.84%
- Sep 18: +22.64%
- Sep 19: +17.42%
- Sep 20: -48.24%
- Sep 21: -66.86%
NASDAQ (since 1971)
- Sep 8: -6.25%
- Sep 9: -7.54%
- Sep 10: -2.65%
- Sep 11: +66.40%
- Sep 12: -0.43%
- Sep 13: +1.53%
- Sep 14: +65.92%
- Sep 15: -50.69%
- Sep 16: +39.42%
- Sep 17: -90.62%
- Sep 18: +28.49%
- Sep 19: +91.46%
- Sep 20: -37.69%
- Sep 21: -95.89%
Russell 2000 (since 1987)
- Sep 8: +50.64%
- Sep 9: -23.28%
- Sep 10: +2.26%
- Sep 11: +85.61%
- Sep 12: +65.58%
- Sep 13: +44.65%
- Sep 14: +58.36%
- Sep 15: -35.64%
- Sep 16: +85.61%
- Sep 17: -129.09%
- Sep 18: +78.72%
- Sep 19: +2.42%
- Sep 20: -97.95%
- Sep 21: -172.80%
The S&P 500 data dates back to 1950, while the NASDAQ and Russell 2000 information date back to 1971 and 1987, respectively.
Final Thoughts
U.S. stocks continue to show an extraordinary amount of resiliency. Despite the steady advance off the April low and poor seasonality, prices keep rising. The S&P 500 ended last week a bit lower on Thursday and Friday, down from its all-time high close on Wednesday. Today, prices are up again, though the S&P 500 does remain below its all-time high close of 6502, which was set on August 28th and tested on Wednesday from last week. Here are a few things that I'm thinking about this week:
Inflation. Both the August PPI and August CPI will be released this week. Unless we get a big surprise to the upside, it's quite likely that market participants will be expecting a rate cut when the Fed meets next week.
Technical Conditions. Despite a bit of weakness in many of our sustainability ratios (XLY vs. XLP excluded) over the past few weeks, our major indices keep rising or at least challenging recent price highs. A sustained move beneath the 20-day EMA would be an initial signal that further weakness and/or consolidation could be starting. Until then, however, the bulls remain completely in charge.
Seasonality. As we move into the 2nd week of September, we should continue to remember that the 2nd half of September is where much of the historical weakness has occurred. We're still staring that historically-weak period directly in the eyes. It still makes sense to be cautioius.
Happy trading!
Tom