
EB Weekly Market Report - Monday, October 6, 2025
ChartLists/Spreadsheets
The following ChartLists/Spreadsheets were updated over the weekend:
- Strong Earnings (SECL)
- Strong Future Earnings (SFECL)
- Raised Guidance (RGCL)
- Bullish Trifecta (BTCL)
- Leading Stock (LSCL)
- Short Squeeze (SSCL)
- Hot Stocks (HTCL)
- Key Manipulation Spreadsheet
The above ChartLists and spreadsheet have been updated on our website. The Hot Stocks ChartList (HTCL) is a new ChartList at EarningsBeats.com. It was created by our very own Matt Townsend, who employs a number of momentum strategies in identifying what he believes are 20 very hot momentum stocks. His strategy is to hold onto these stocks as long as the momentum remains. You can read more about this new feature under "ChartLists" on our website.
Weekly Market Recap
Major Indices
Sectors
Top 10 Industries Last Week
Bottom 10 Industries Last Week
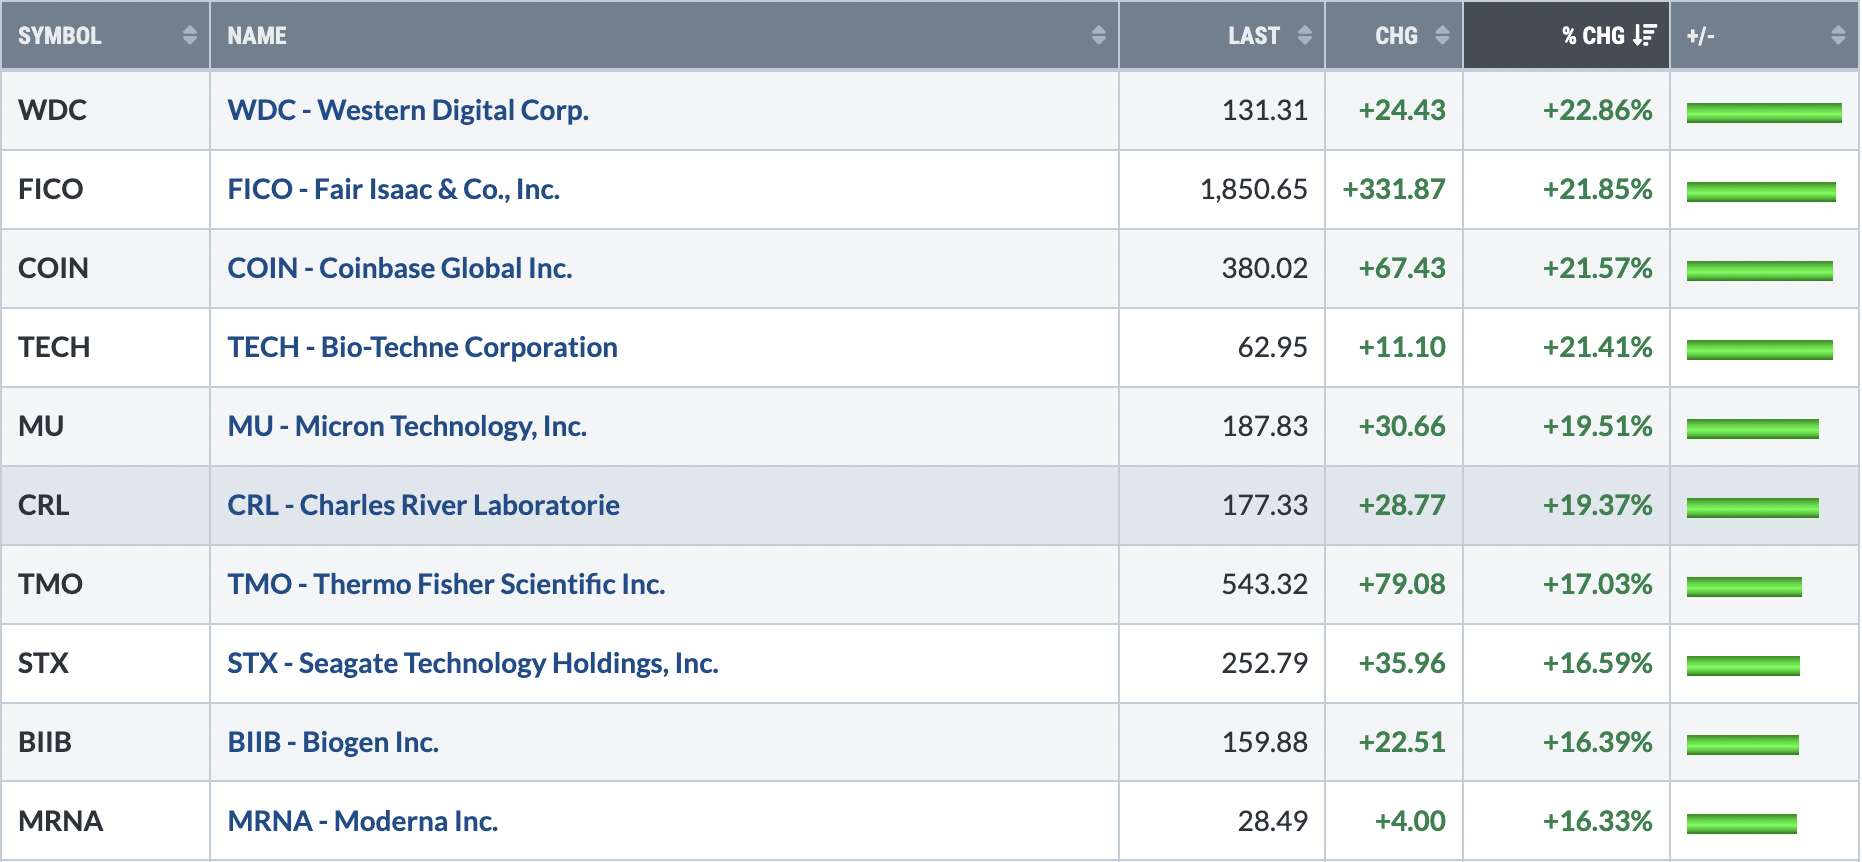
Top 10 Stocks - S&P 500/NASDAQ 100
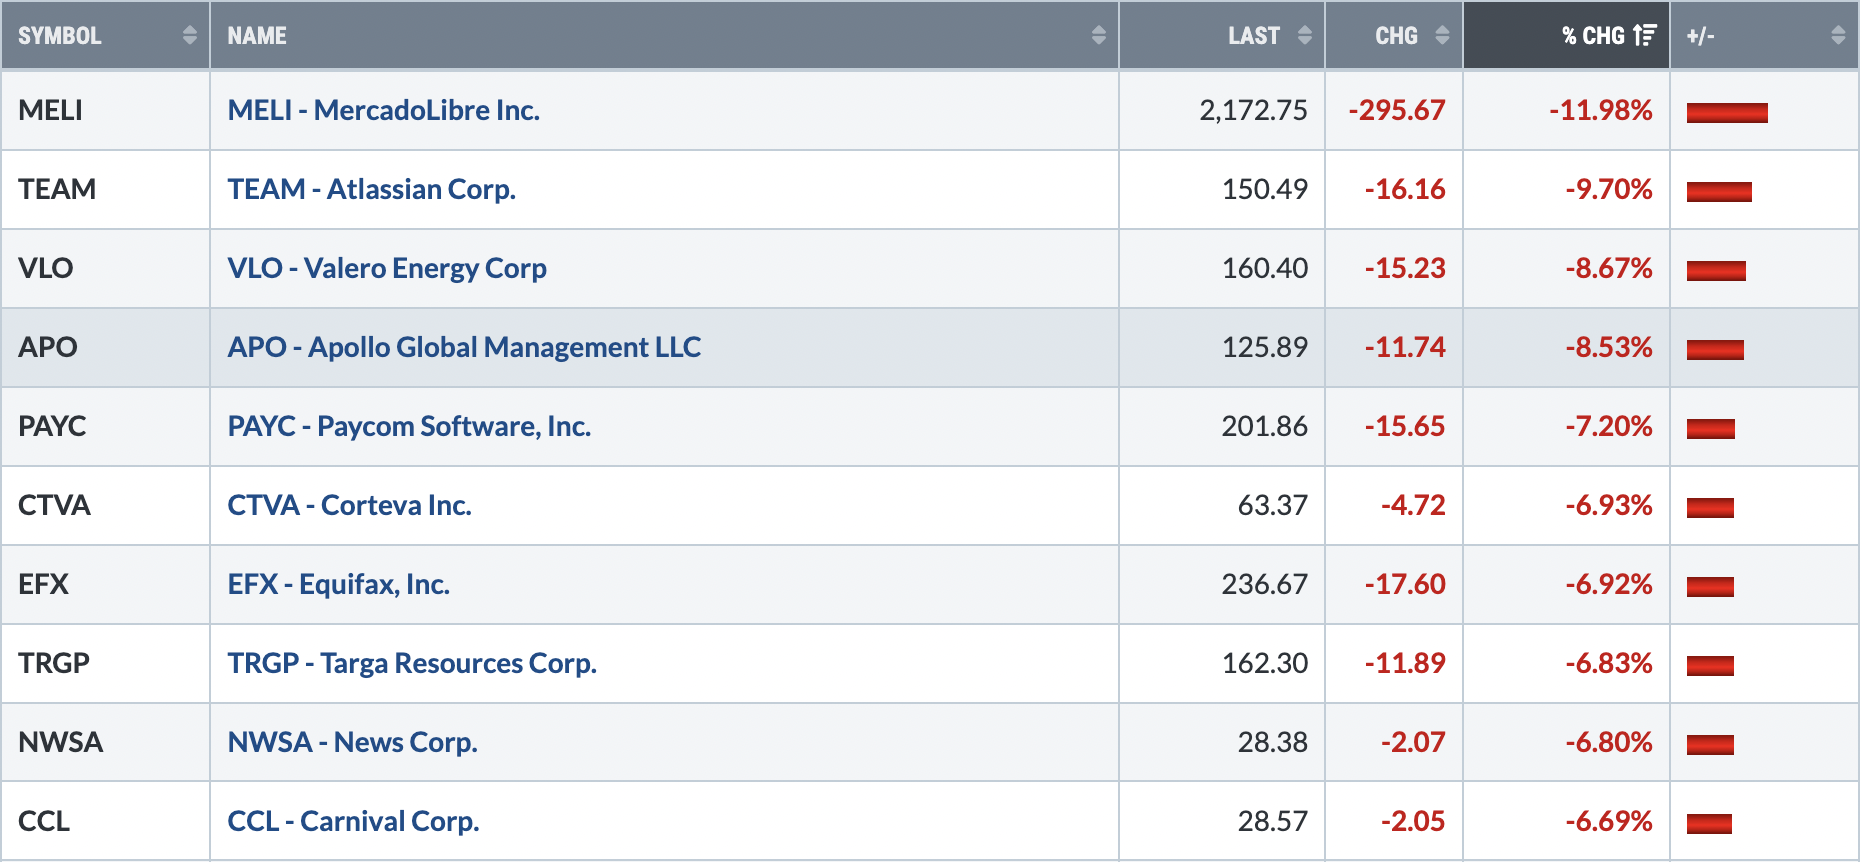
Bottom 10 Stocks - S&P 500/NASDAQ 100
Big Picture
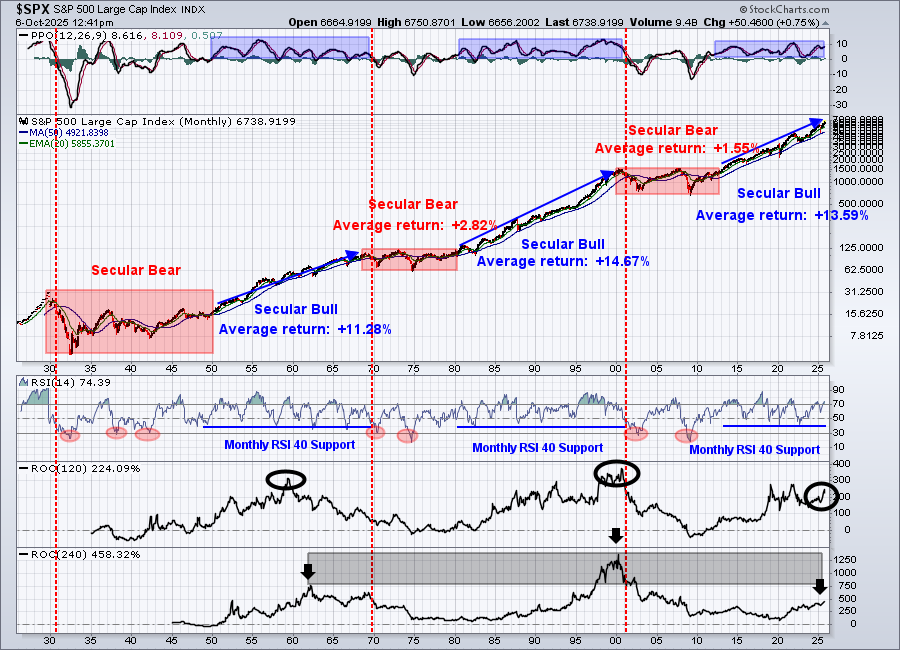
We just keep trending higher in our benchmark S&P 500. This remains a very important chart to keep in mind to dissuade you from trying to time a long-term market top. CNBC folks have called 45 of the last 2 bear markets. Let the signals come to us, don't force the issue.
Sustainability Ratios
Here's the latest look at our key intraday ratios as we follow where the money is traveling on an INTRADAY basis (ignoring gaps):
QQQ:SPY
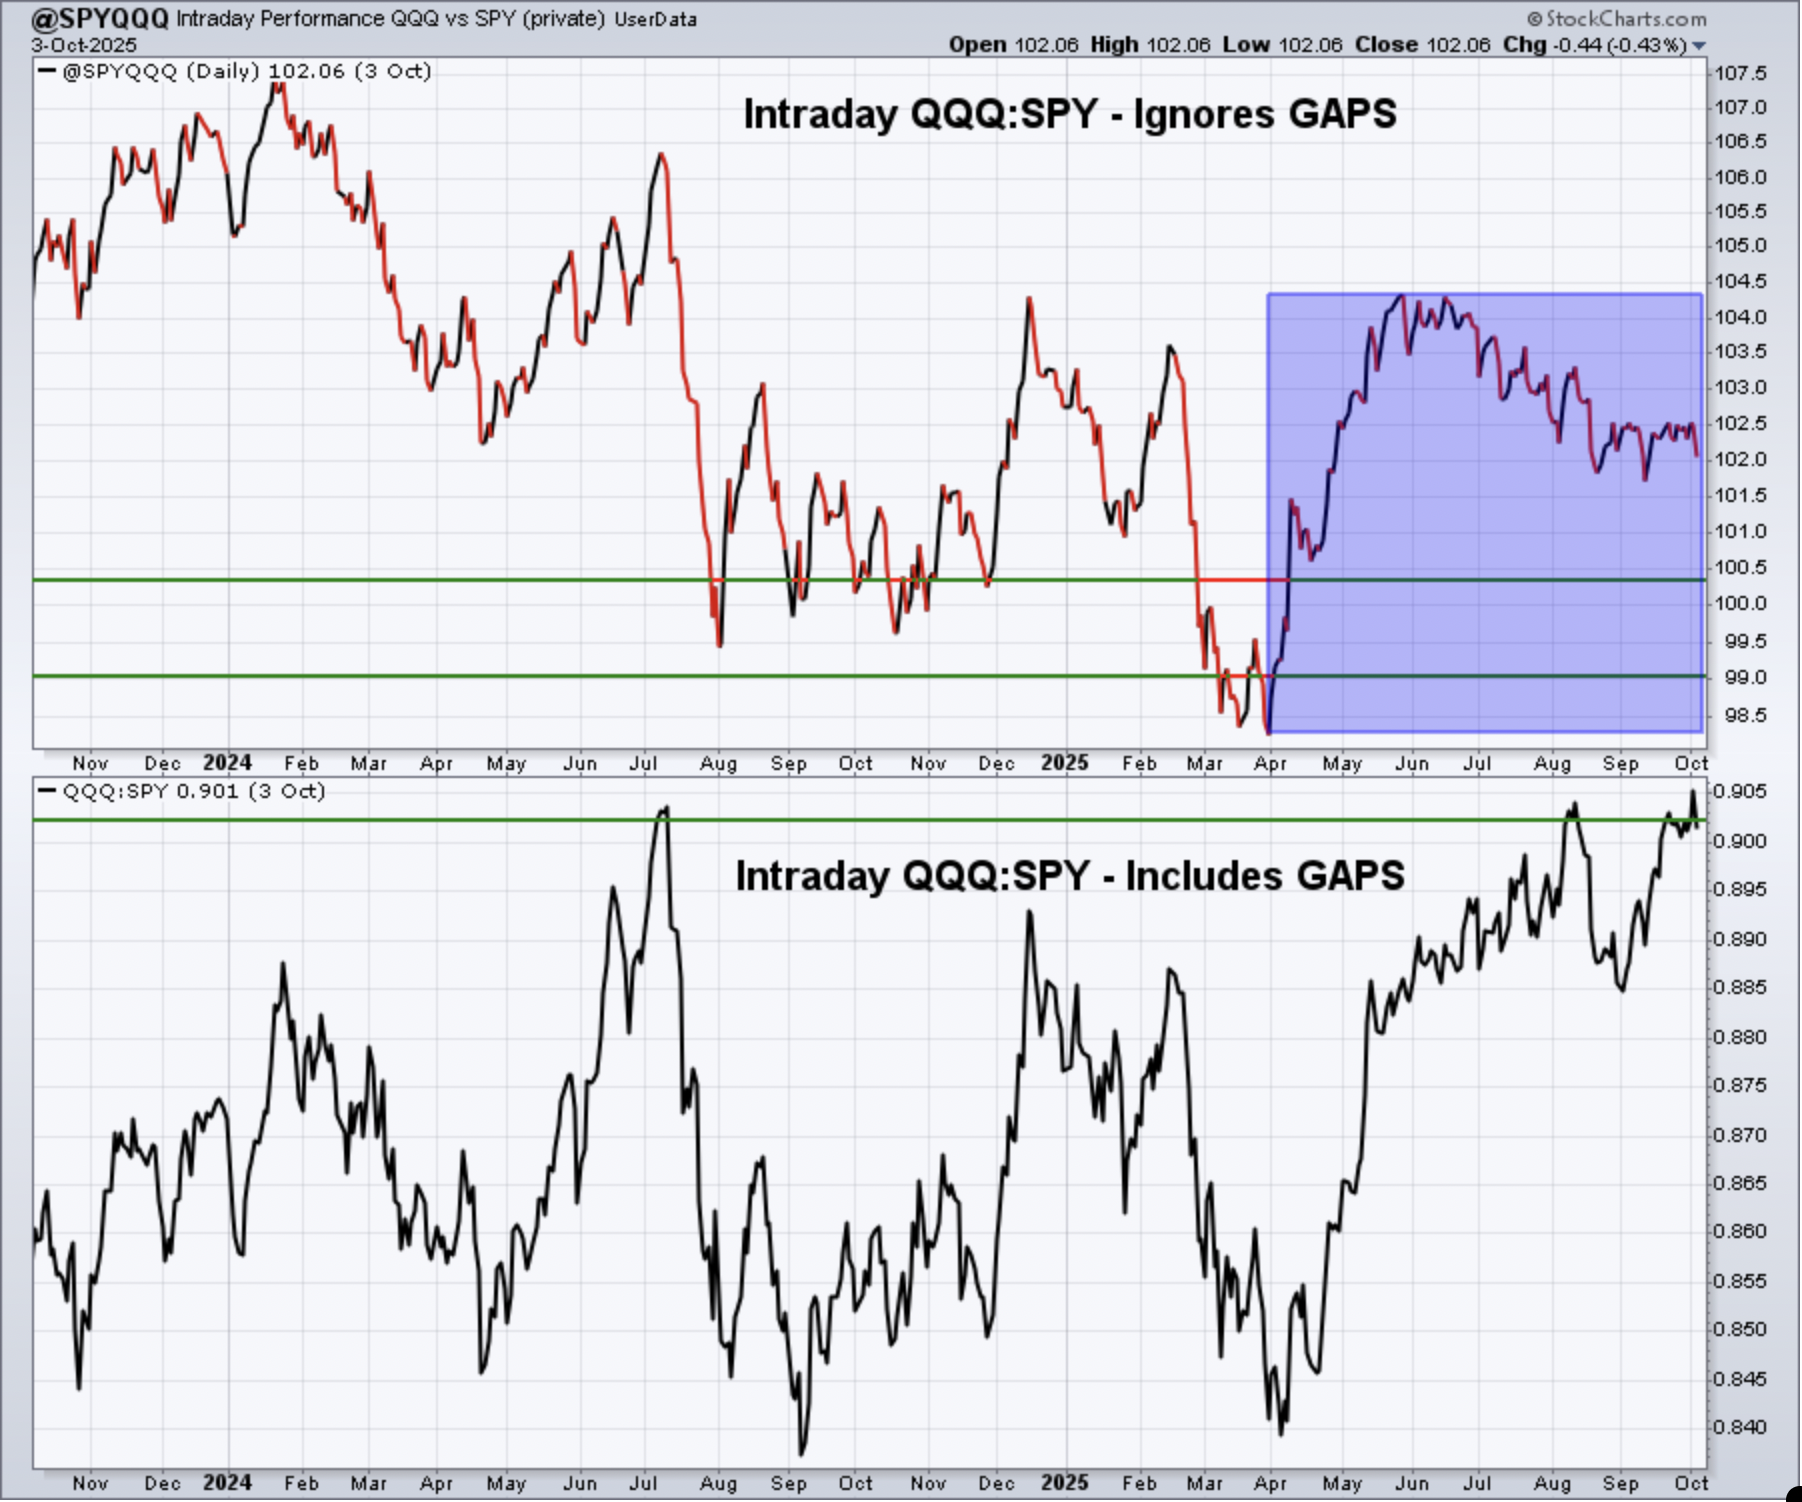
We saw another new high in the bottom panel last week, which tells us that the more growth-oriented QQQ continues to more than hold its own vs. the less growth-oriented SPY. I view this bullishly as Wall Street is not bailing on growth stocks. I'm not really looking for growth leadership right now, but getting it further supports the notion that U.S. stocks are heading higher.
IWM:QQQ
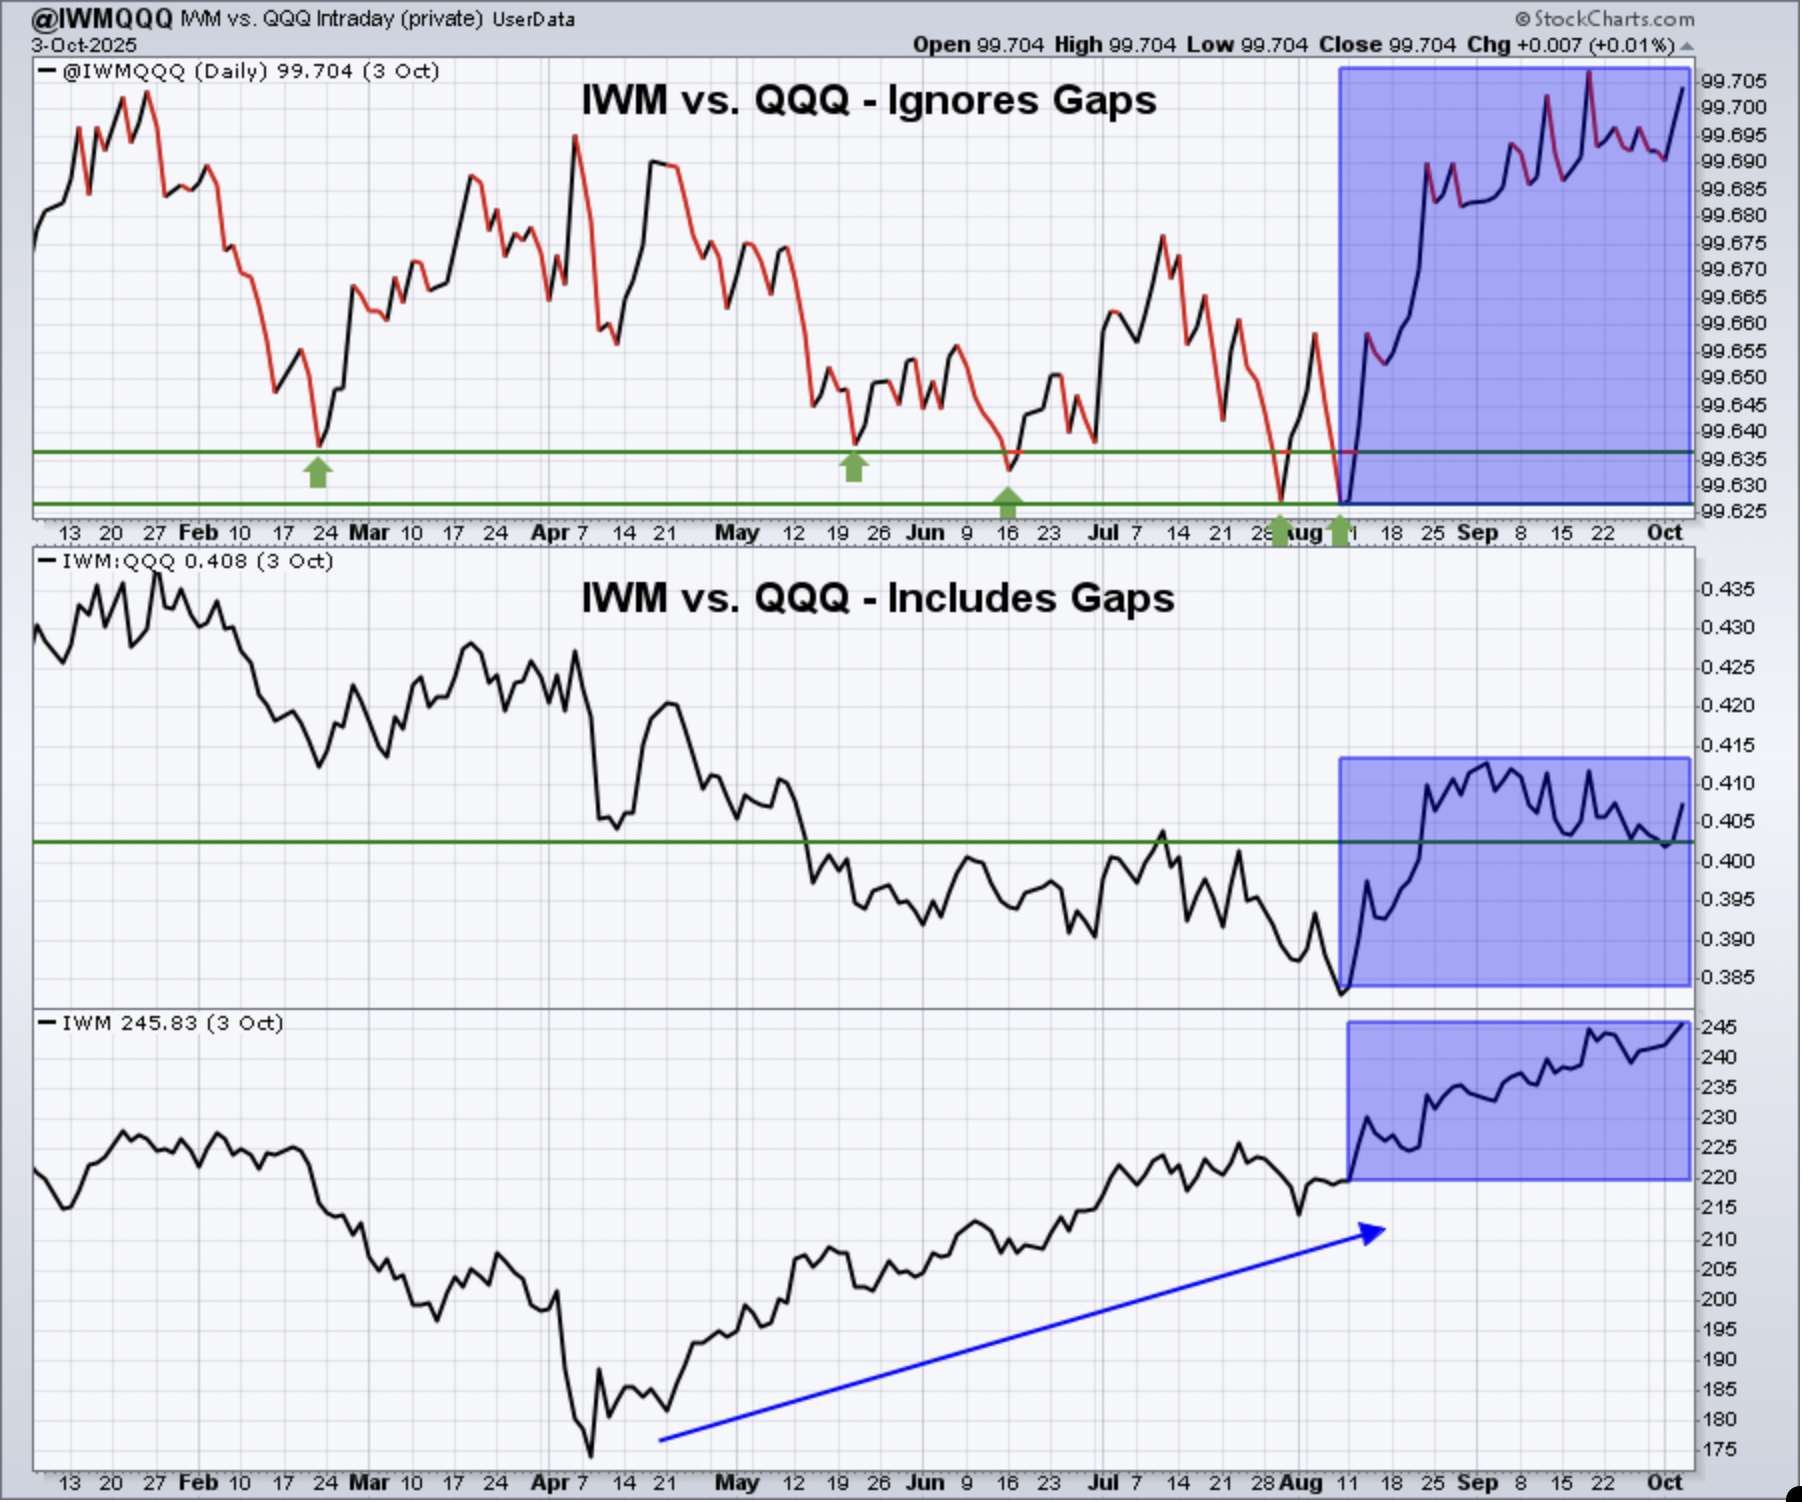
I continue to like small caps vs. large caps and there's nothing on this chart that suggests I change my tune. The IWM has outperformed since June, is setting new all-time highs, and has the backdrop (lower rates) to support further relative strength.
XLY:XLP
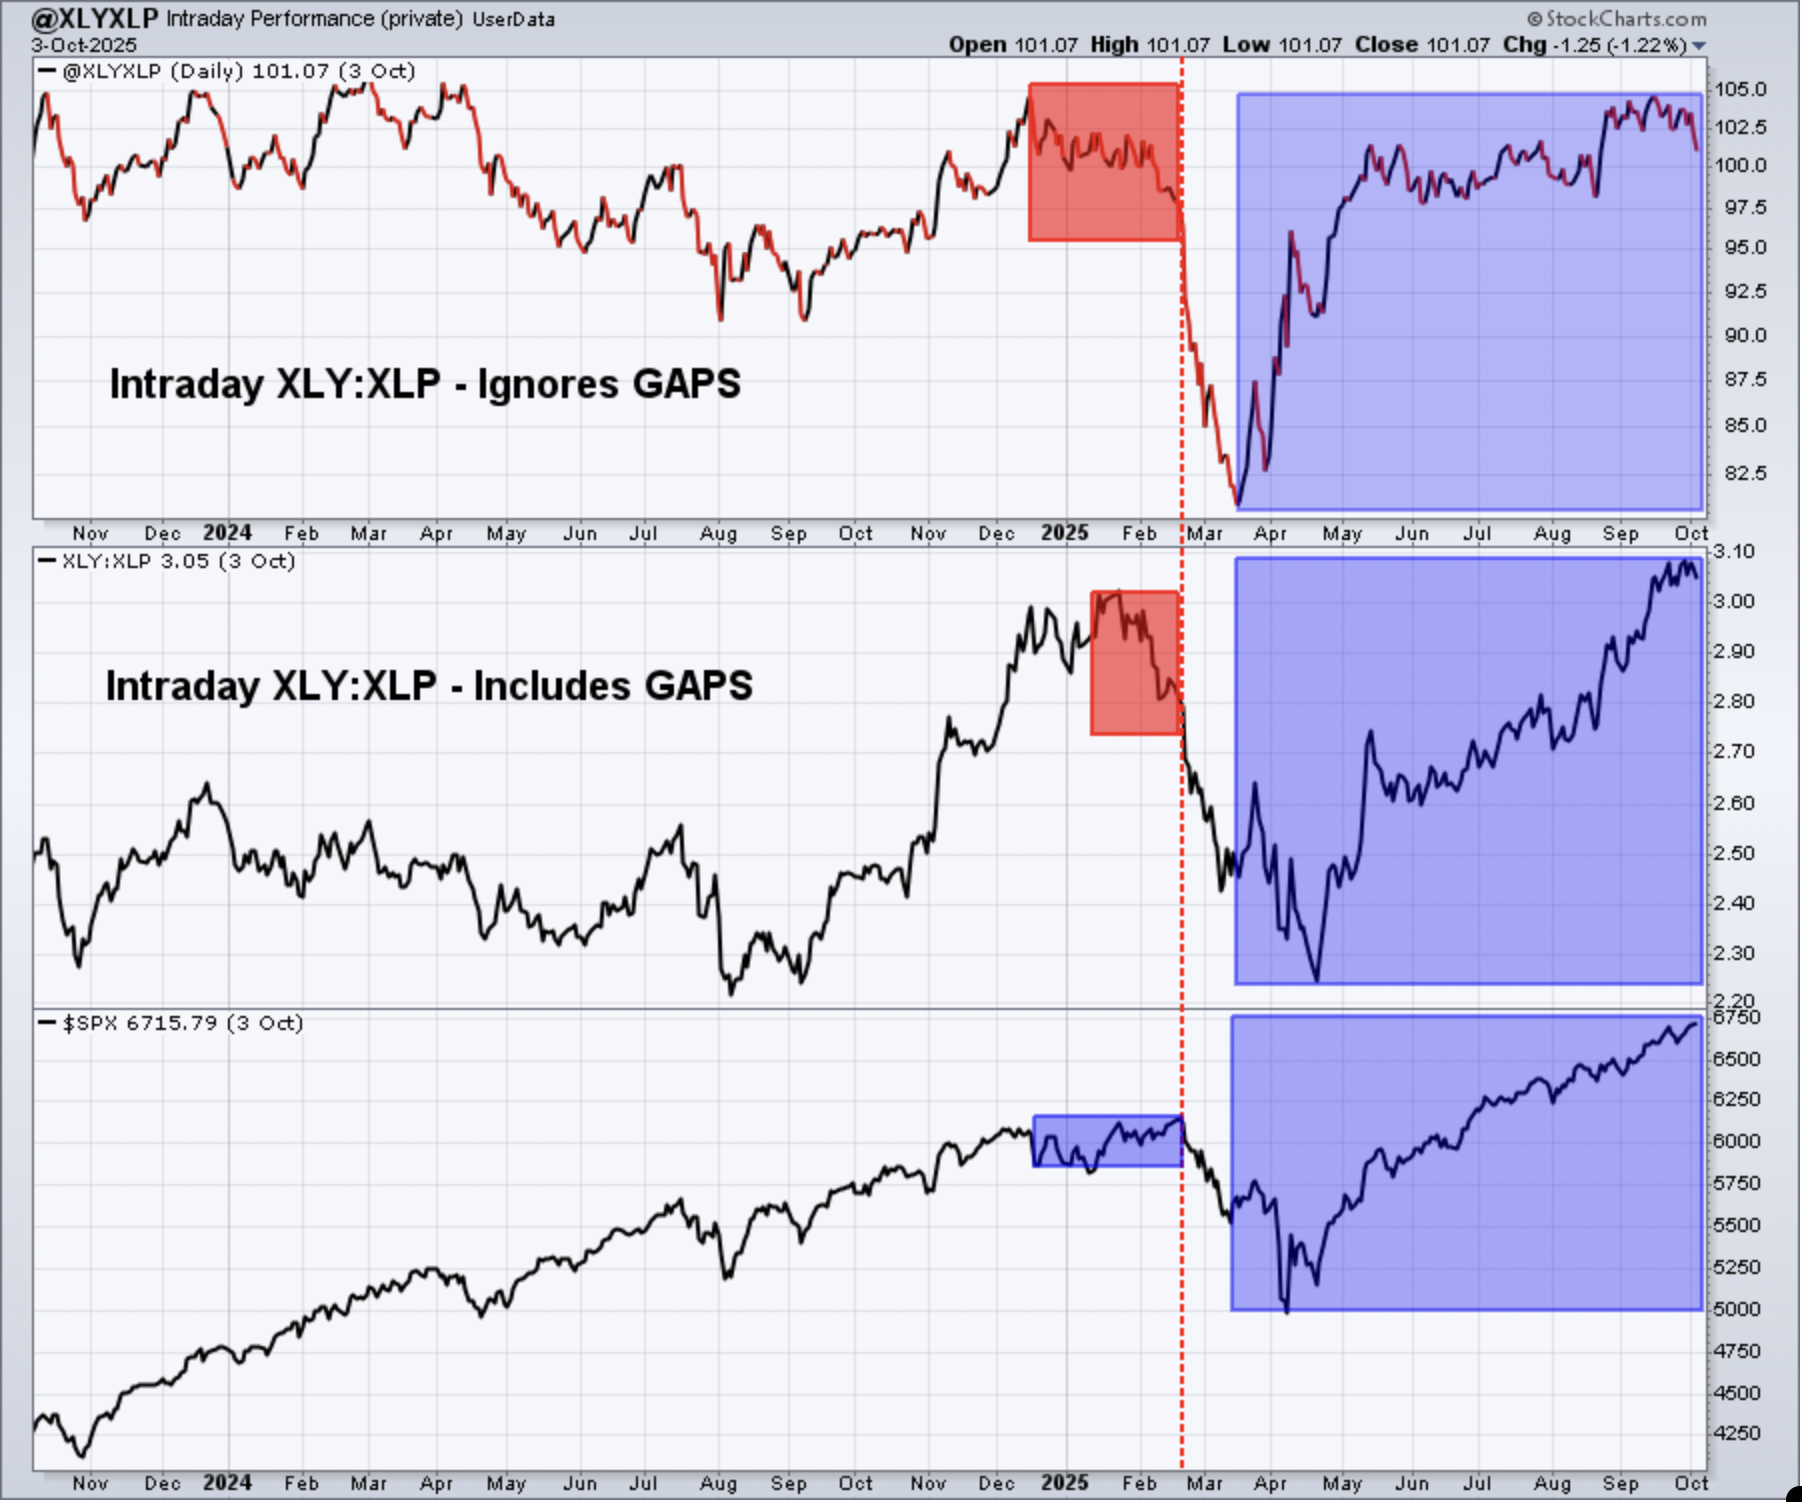
If we "ignore gaps" and concentrate on that top panel, we saw a bit of erosion in the XLY:XLP relative strength. Clearly, however, the trend overall remains up and that fully supports the current S&P 500 rally. This is probably my favorite sustainability ratio and says to stay invested and remain bullish. I won't argue.
Sentiment
5-day SMA ($CPCE)
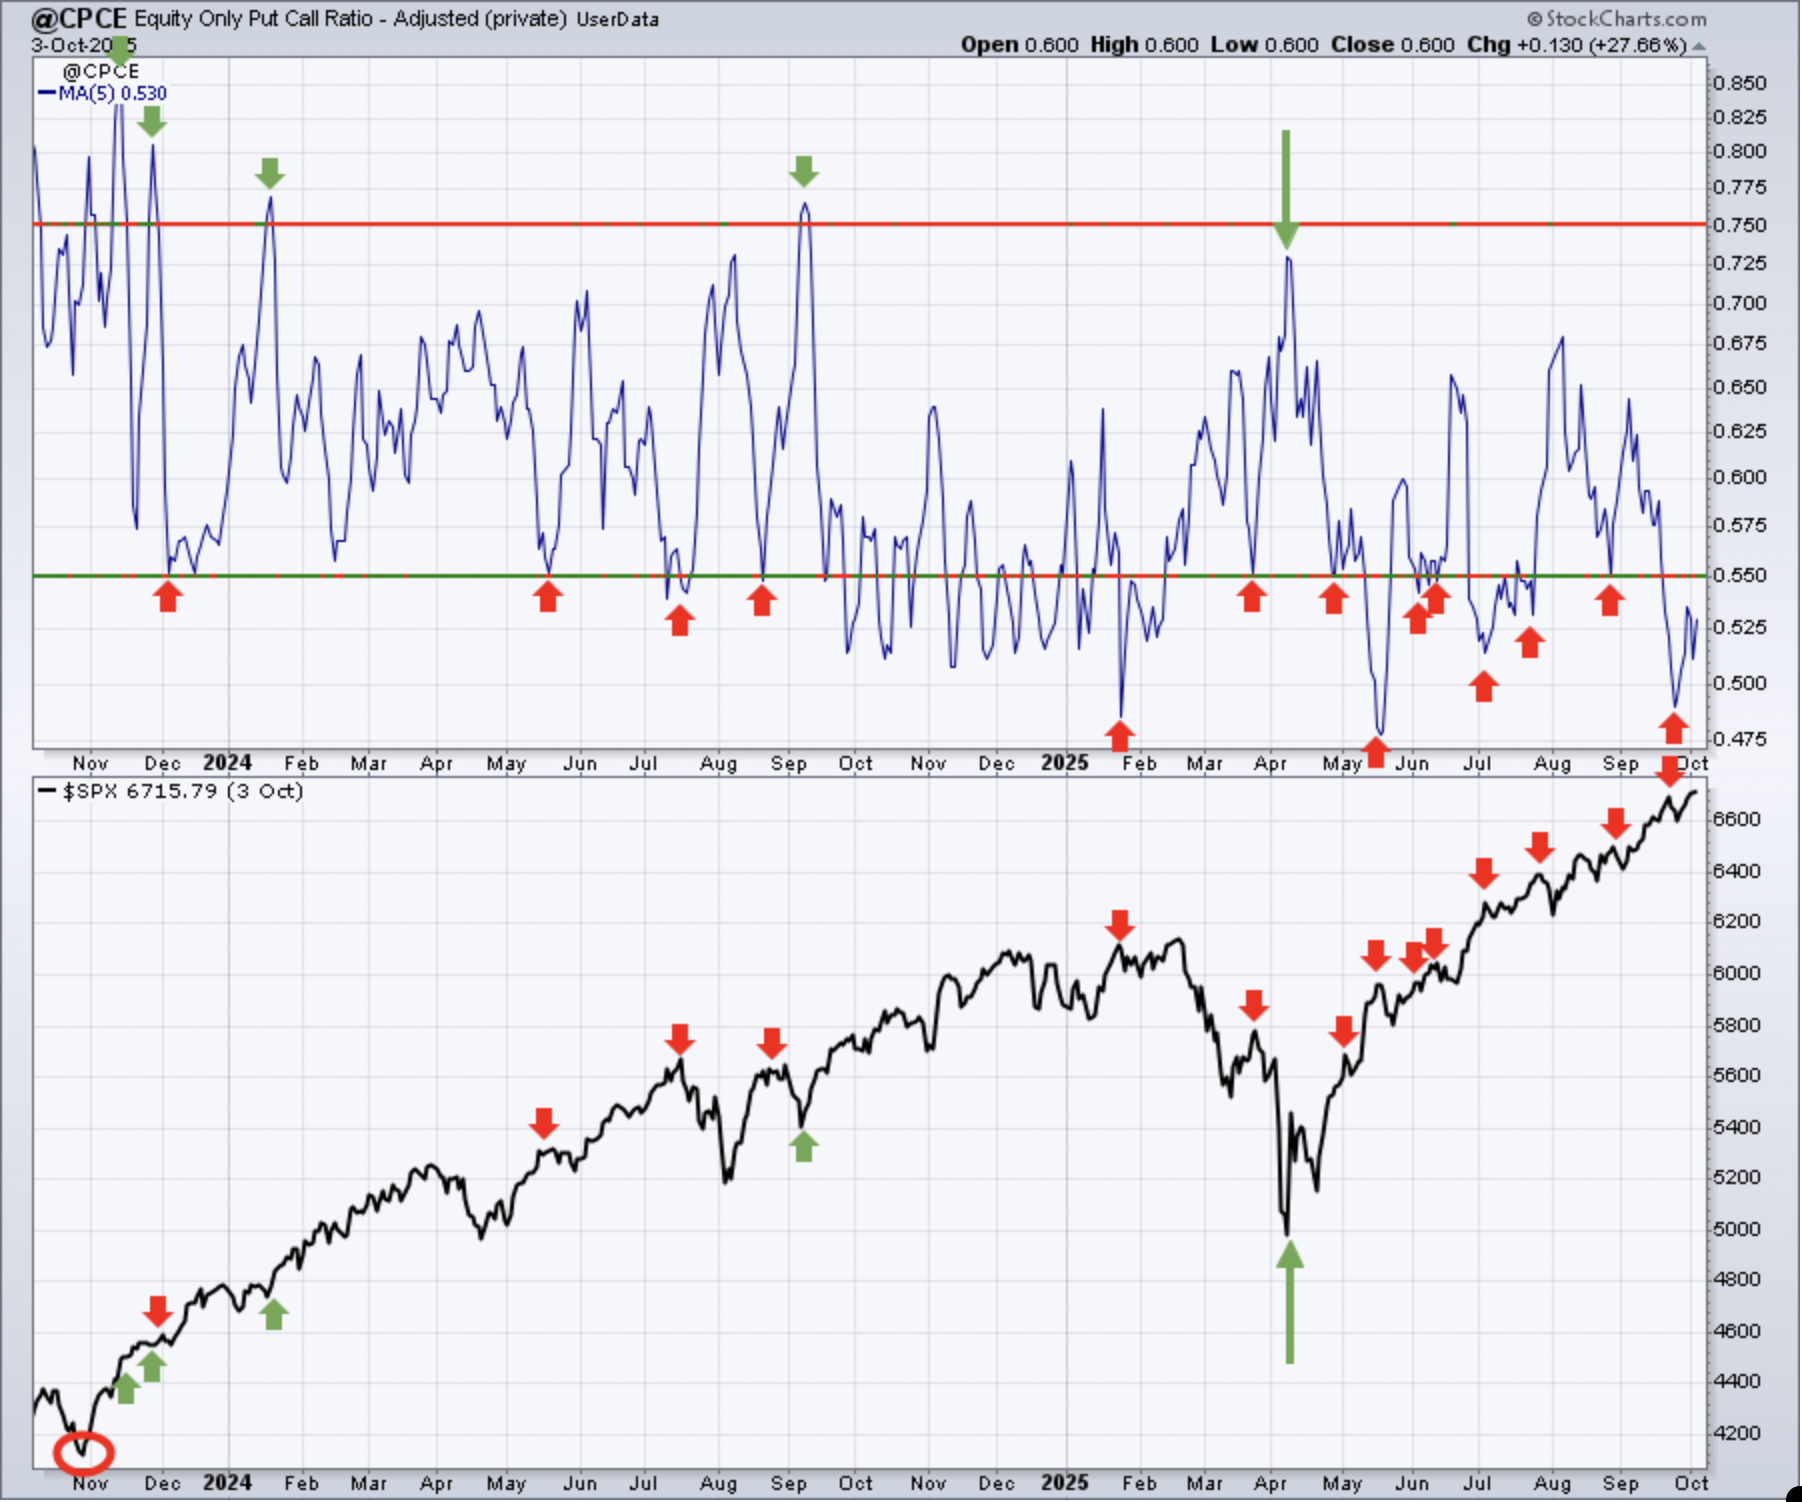
Sentiment indicators are contrarian indicators. When they show extreme bullishness, we need to be a bit cautious and when they show extreme pessimism, it could be time to become much more aggressive. Major market bottoms are carved out when pessimism is at its absolute highest level.
Keep in mind that the above 5-day SMA reading of the CPCE is our "speed boat" sentiment indicator that changes quite frequently. We remain very low and below a 5-day moving average of .55, which indicates that we could be "toppy" from a short-term perspective. But we also know that an overbought and complacent market can remain that way for a long, long time. Traders should remain nimble, but long-term buy and holders should remain long - all in my humble opinion, of course.
253-day SMA ($CPCE)
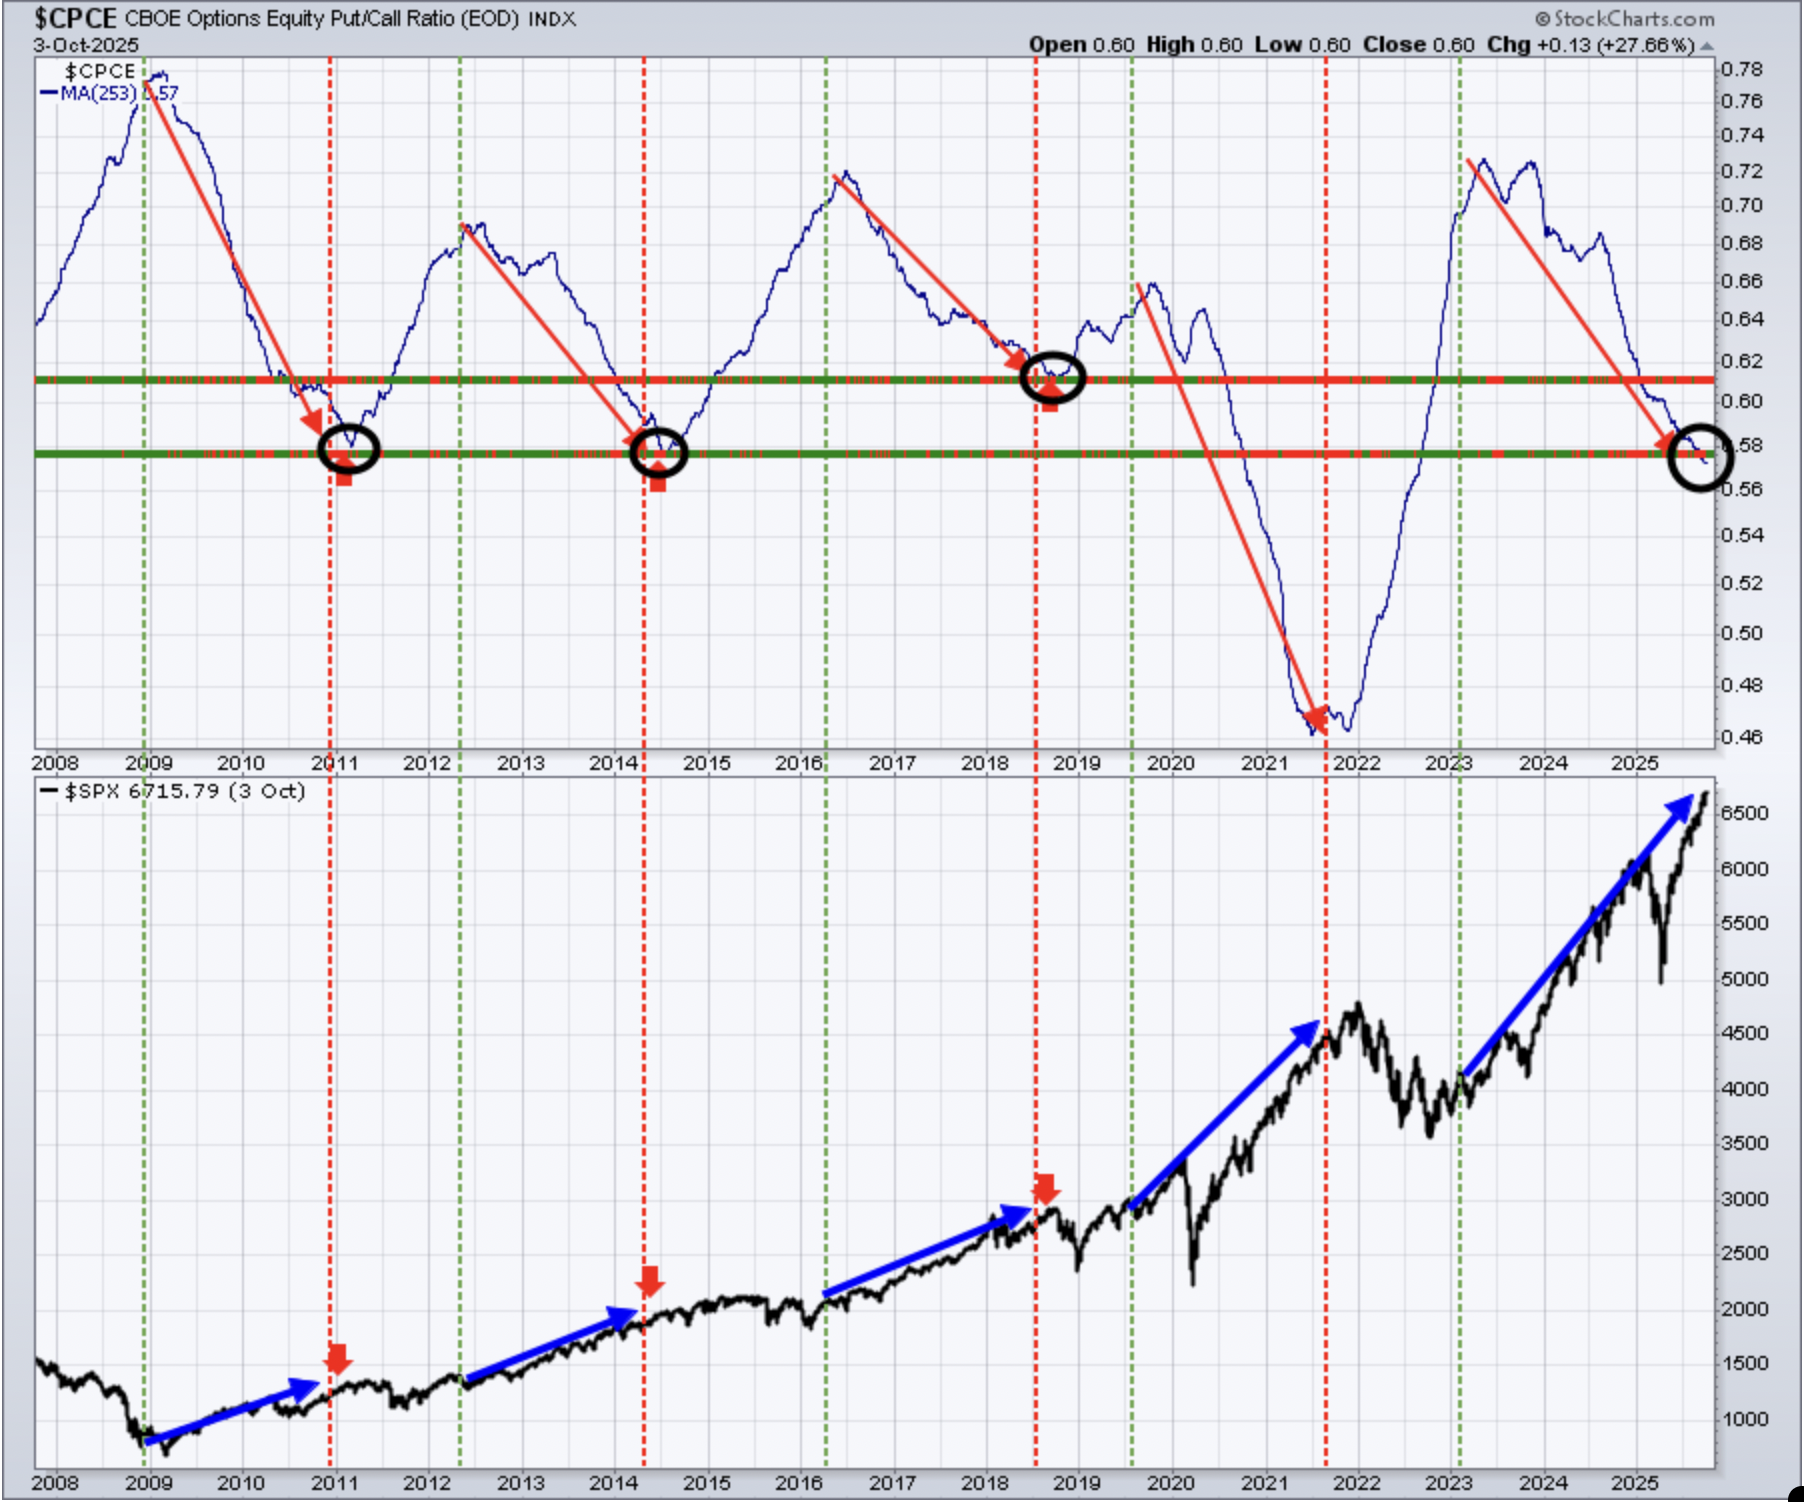
This longer-term 253-day SMA of the CPCE is our "ocean-liner" signal, unlike our short-term speedboat indicator. This one usually provides us a very solid long-term signal as the overall market environment moves from one of pessimism to complacency and vice versa. The above chart suggests the secular bull market rally off of the April low has legs to run further. I don't try to predict when this downtrend will reverse, making the stock market riskier and perhaps a bit more unpredictable. Instead, I view the current signal as very bullish, leaving my bullish S&P 500 forecast at 7000.
Long-Term Trade Setup
Since beginning this Weekly Market Report in September 2023, I've discussed the long-term trade candidates below that I really like. Generally, these stocks have excellent long-term track records, and many pay nice dividends that mostly grow every year. Only in specific cases (exceptions) would I consider a long-term entry into a stock that has a poor or limited long-term track record and/or pays no dividends. I try to review the long-term picture once a month or so. Below is a quick recap of how these stocks look as we kick off Q4:
- JPM – very strong advance heading into earnings next week
- BA – recent pullback to test rising 20-month EMA
- FFIV – steady push higher has been relentless
- MA – mostly consolidating in 2025, but remains comfortably above 20-month EMA
- GS – very strong uptrend, nearly tripling over last 20 months
- FDX – pushing back above its 20-month EMA, encouraging
- AAPL – monthly RSI test of 50 provided excellent buying opportunity
- CHRW – trending up since breakout above 110
- JBHT – monthly RSI in 40s, typically solid entry point for long-termers
- STX - buyers everywhere since the long-term breakout in May
- HSY – trending up now above 20-month EMA, needs to break above 200
- DIS – still needs breakout above 125, while looking for 20-month EMA support
- MSCI – lengthy sideways consolidation spanning most of past 2-3 years
- SBUX - another in a lengthy consolidation period, needs to hold 70 on selling
- KRE – breakout above 68-70 would likely spur much more buying, looks good
- ED – multiple successful tests of rising 20-month EMA
- AJG – looking to renew its long-term uptrend after 20-month EMA test
- NSC – breakout and all-time high now measures to 380
- RHI – appears headed to major price support test in 28-30 area
- ADM – trending higher, a push above 65 completely reverses downtrend
- BG – keeps testing its 20-month EMA from underneath, needs to clear
- CVS – move up to near 80 this month very positive development
- IPG – support in 22.00-22.50 range has held thus far
- HRL - moving below 25 not a good look, needs reversal now
- DE – love this 20-month EMA test after breaking out to all-time high
Keep in mind that our Weekly Market Reports favor those who are more interested in the long-term market picture. Therefore, the list of stocks above are stocks that we believe are safer (but nothing is ever 100% safe) to own with the long-term in mind. Nearly everything else we do at EarningsBeats.com favors short-term momentum trading, so I wanted to explain what we're doing with this list and why it's different.
Also, please keep in mind that I'm not a Registered Investment Advisor (and neither is EarningsBeats.com nor any of its employees) and am only providing (mostly) what I believe to be solid dividend-paying stocks for the long term. Companies periodically go through adjustments, new competition, restructuring, management changes, etc. that can have detrimental long-term impacts. Neither the stock price nor the dividend is ever guaranteed. I simply point out interesting stock candidates for longer-term investors. Do your own due diligence and please consult with your financial advisor before making any purchases or sales of securities.
Looking Ahead
Upcoming Earnings
The following list of companies is NOT a list of all companies scheduled to report quarterly earnings, however, just key reports, so please be sure to check for earnings dates of any companies that you own. Any company in BOLD represents a stock in one of our portfolios and the amount in parenthesis represents the market capitalization of each company listed:
- Monday: STZ ($25 billion)
- Tuesday: MKC ($18 billion)
- Wednesday: None
- Thursday: PEP ($195 billion)
- Friday: None
Key Economic Reports
- Monday: None
- Tuesday: None
- Wednesday: FOMC minutes
- Thursday: Initial jobless claims
- Friday: October consumer sentiment
This is a very light week for economic data, so not too much data will be lost if the government shutdown extends all week.
Historical Data
I'm a true stock market historian. I am absolutely PASSIONATE about studying stock market history to provide us more clues about likely stock market direction and potential sectors/industries/stocks to trade. While I don't use history as a primary indicator, I'm always very aware of it as a secondary indicator. I love it when history lines up with my technical signals, providing me with much more confidence to make particular trades.
Below you'll find the next two weeks of historical data and tendencies across the three key indices that I follow most closely. The percentage for each calendar day represents the annualized return for that day. An example of how this is calculated is reflected next to the first day under the S&P 500 and in parenthesis:
S&P 500 (since 1950)
- Oct 6: +35.15% (Ex: cumulative gains = +7.36% over 53 trading days since 1950. +7.36% x 253/53 = +35.15%%)
- Oct 7: -35.61%
- Oct 8: +6.60%
- Oct 9: -60.94%
- Oct 10: +10.99%
- Oct 11: +28.18%
- Oct 12: +10.11%
- Oct 13: +66.86%
- Oct 14: +6.44%
- Oct 15: -13.58%
- Oct 16: -2.28%
- Oct 17: -0.27%
- Oct 18: +63.55%
- Oct 19: -131.47%
NASDAQ (since 1971)
- Oct 6: +0.80%
- Oct 7: -79.06%
- Oct 8: +3.65%
- Oct 9: -50.30%
- Oct 10: +15.02%
- Oct 11: +79.53%
- Oct 12: +38.25%
- Oct 13: +124.64%
- Oct 14: +25.65%
- Oct 15: -2.21%
- Oct 16: +1.79%
- Oct 17: -32.32%
- Oct 18: +32.51%
- Oct 19: -83.58%
Russell 2000 (since 1987)
- Oct 6: -24.21%
- Oct 7: -162.09%
- Oct 8: -66.42%
- Oct 9: -144.18%
- Oct 10: +101.81%
- Oct 11: +30.34%
- Oct 12: +8.61%
- Oct 13: +80.92%
- Oct 14: +42.18%
- Oct 15: +10.28%
- Oct 16: +143.27%
- Oct 17: -44.07%
- Oct 18: +6.10%
- Oct 19: -18.45%
The S&P 500 data dates back to 1950, while the NASDAQ and Russell 2000 information date back to 1971 and 1987, respectively.
Final Thoughts
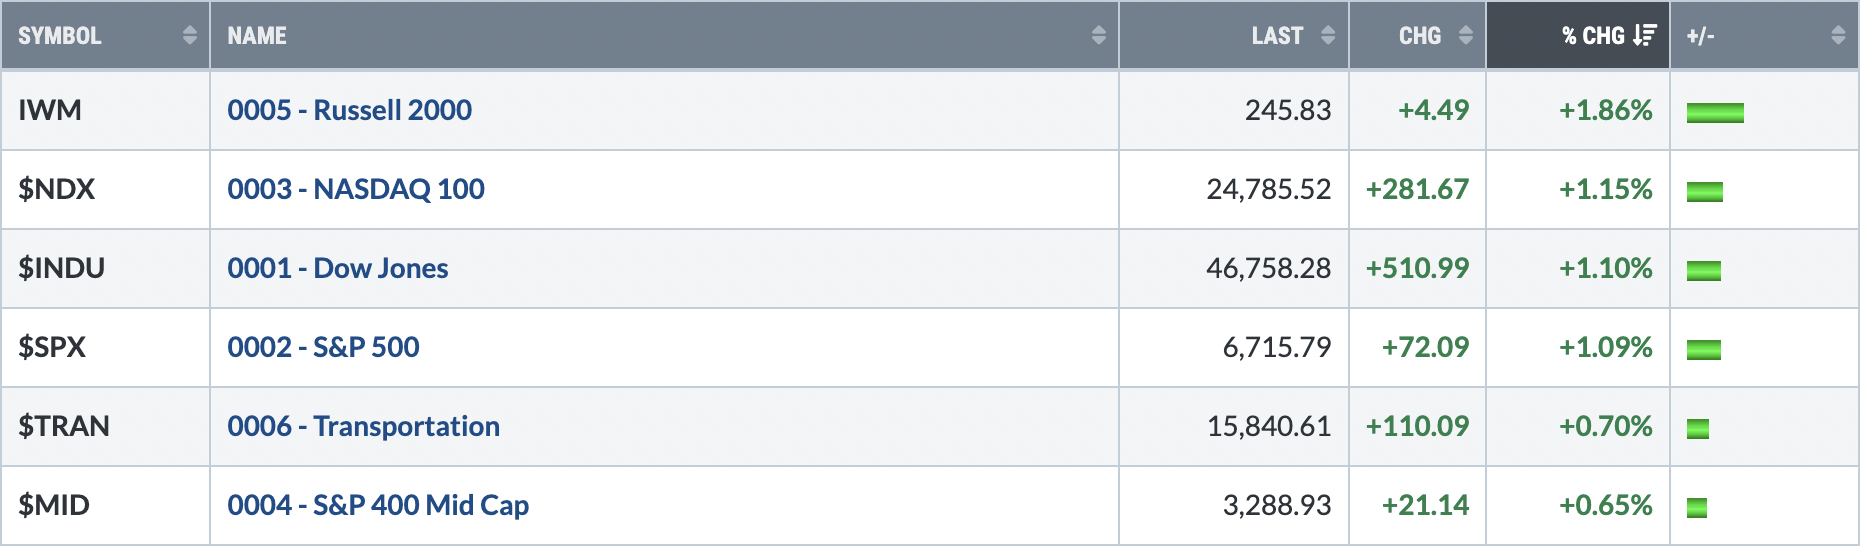
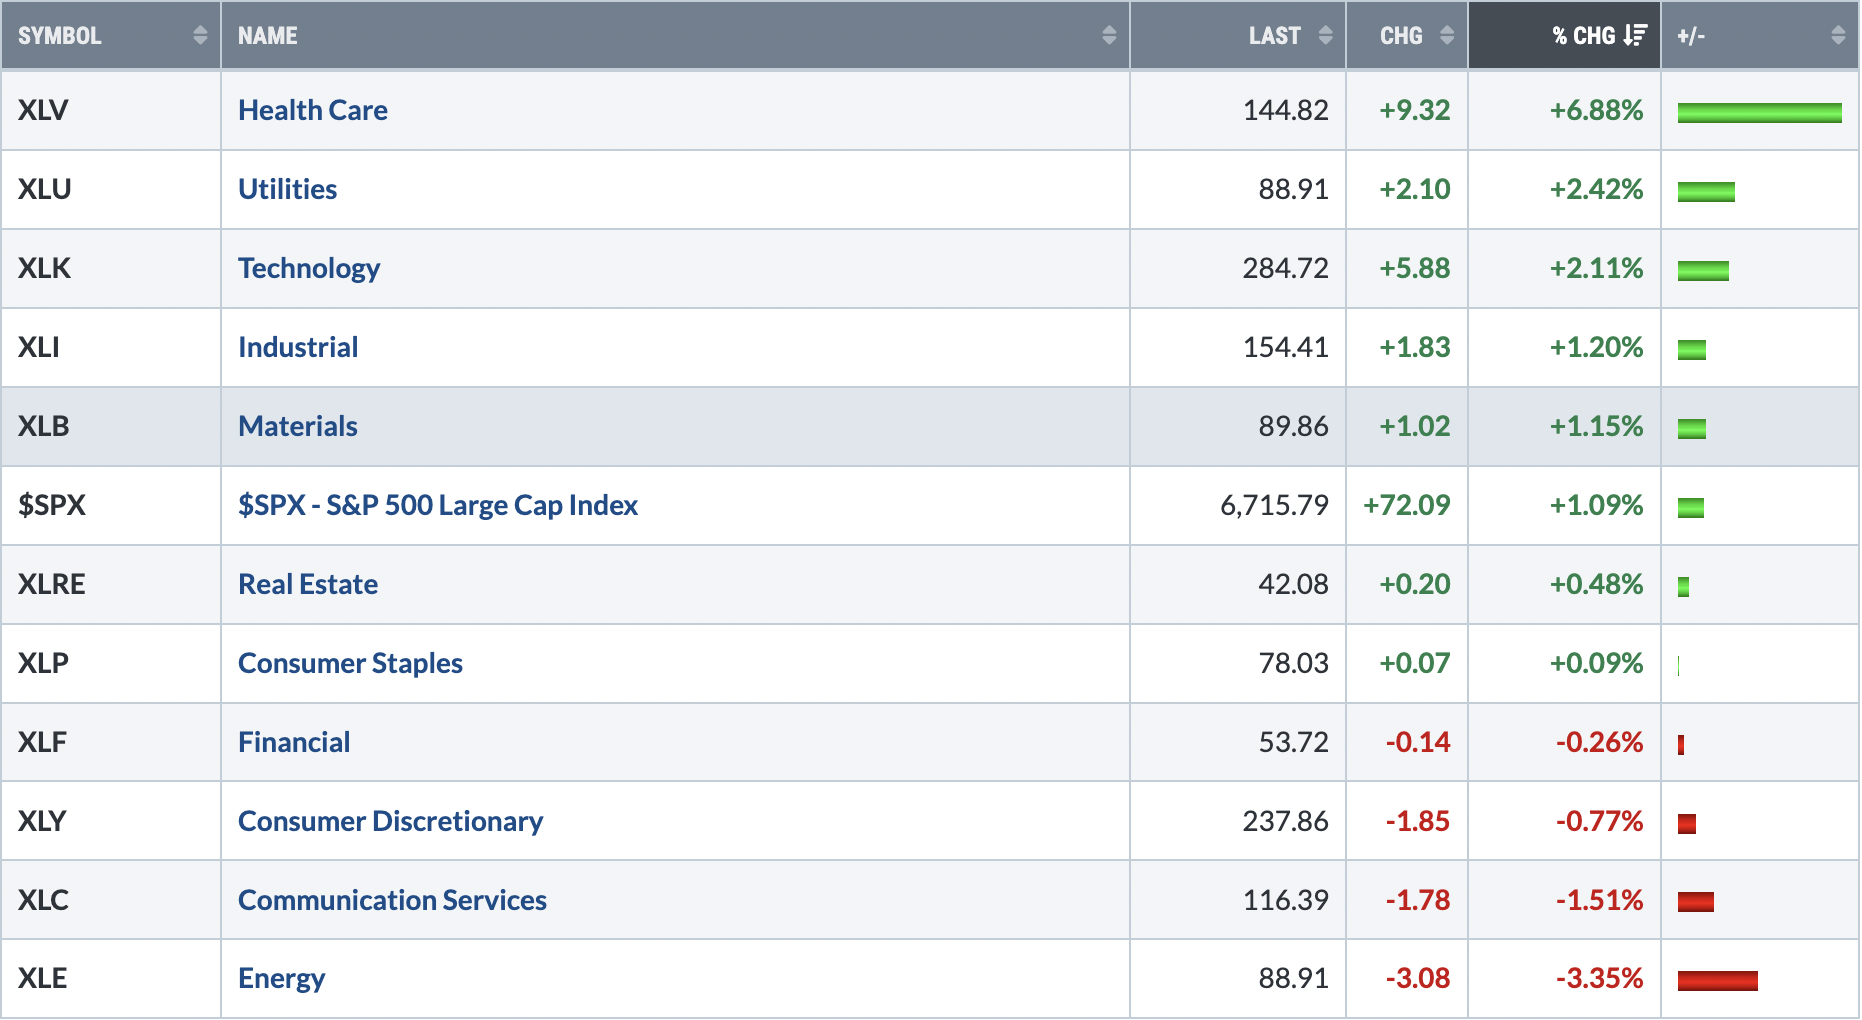
Last week saw new record highs across our major indices with the small cap Russell 2000 (IWM) leading the way. Health care (XLV), a laggard for over 2 1/2 years vs. the benchmark S&P 500, had a fantastic week, gaining nearly 7% and 4 full percentage points above utilities (XLU), which was the 2nd best performing sector. Health care represents more than 15% of the IWM, while only 9% and 4% of the S&P 500 and NASDAQ, respectively. That helps to partially explain the relative strength in small caps last week. Meanwhile, technology (XLK) favors the NASDAQ 100 and the XLK too had a solid week, gaining over 2%.
Perhaps somewhat surprisingly, the gains to all-time highs last week came with a government shutdown that began to start October. Not every group participated in last week's rally, however, as energy shares (XLE, -3.35%) were hit the hardest as crude oil prices ($WTIC) tumbled throughout the week, falling roughly 7% to close last week below $61 per barrel.
Here are a few things I'm pondering as we move closer to the start of Q3 earnings season:
Government Shutdown. Thus far, it hasn't seemed to matter to anyone trading stocks. However, the longer this shutdown lasts, the more impact that it will have on GDP. Given that the economy already appears to be teetering on the brink of a potential recession, an extended shutdown could push the economy over the edge. That would all but guarantee two more rate cuts in 2025 and possibly more to start 2026. There's a chance that Wall Street is viewing the shutdown as a positive, helping to lower interest rates and eventually strengthen the economy in 2026.
Earnings. It's almost time! I expect that banks will kick off earnings season with robust results, easily clearing rising expectations. While a weak economy can cause earnings to contract, the lower interest rates ahead should have a very positive impact on banks' net interest margins.
Technical Conditions. I don't argue with all-time highs. Remember, in my view, there is nothing more important than price action. When the S&P 500 is hitting all-time highs on a regular basis, I need to see a massive number of warning signs to be bearish. I simply don't see them. We've had a few short-term warning signs, but these signs do not create an environment where a bear market would thrive. Instead, we see bits of selling here and there, like the recent 20-day EMA test, and then more buying resumes. It's not time to get bearish.
Banks. I believe the environment remains such that banks should thrive. As a result, I remain overweight the group and am looking for small and regional banks, in particular, to provide rosy forecasts ahead. I like the larger banks too, as Q4 typically provides very strong tailwinds for the entire group. I won't be at all surprised to see a strong pre-earnings run higher in anticipation of strong results and a healthy forecast.
Happy trading!
Tom